2596
Comparison of the QIBA MRE ROI-drawing method to a method standardized by tracing liver parenchyma boundariesWalter C Henderson1, Alexandra N Schlein1, Jonathan C Hooker1, Yesenia Covarrubias1, Tanya Wolfson2, Adrija Mamidipalli1, Jennifer Y Cui1, Yingzhen Zhang1, Ethan Z Sy1, Nikolaus M Szeverenyi1, Rohit Loomba3, and Claude B Sirlin1
1Liver Imaging Group, Department of Radiology, UC San Diego, La Jolla, CA, United States, 2Computational and Applied Statistics Laboratory, UC San Diego, La Jolla, CA, United States, 3NAFLD Research Clinic, Division of Gastroenterology, Department of Medicine, UC San Diego, La Jolla, CA, United States
Synopsis
While the Quantitative Imaging Biomarker Alliance (QIBA) draft recommendations on ROI placement in 2D MRE image analysis prescribe that only linear waves and parenchyma at least 1 cm from the liver edge be included, another abstract submitted to this meeting (Mamidipalli et al.) has found that analysts with equivalent experience and skill level draw significantly different ROIs when using these guidelines. This study compares the QIBA method of ROI placement to a method that is more standardized and inclusive, and compares the agreement and bias between each method on 2D MRE liver stiffness measurements.
Introduction
Guidelines published by the Radiological Society of North America’s (RSNA) Quantitative Imaging Biomarker Alliance (QIBA) describe a standardized method of drawing ROIs for the calculation of mean shear stiffness using MR Elastography (MRE)1. The guidelines state that ROIs should be drawn manually by an analyst to include only coherent (linear) shear waves, exclude major blood vessels, and avoid the outer ~1 cm of liver tissue. As suggested in other work being submitted as a scientific abstract to this meeting (Mamidipalli et al.), agreement in ROI selection between two similarly-trained MRE analysts following these guidelines still exhibit significantly different ROI selections. In that abstract, the mean Jaccard similarity coefficient between two analysts is 0.49 (49%). The purpose of this study is to compare the shear stiffness results obtained using two different image analysis techniques: one in which the analyst follows the QIBA guidelines, and one in which the analyst relies on more consistent anatomical landmarks by capturing all liver tissue in a given ROI slice, including the peripheral parenchyma and blood vessels, relying solely on the confidence threshold of the analysis software to exclude non-viable waves.Materials and Methods
This retrospective analysis was IRB-approved and HIPAA compliant. Patients with known or suspected non-alcoholic fatty liver disease were scanned on a GE Signa Excite at 3T and 2D-GRE MRE was run at 60 Hz. The standard MRE inversion algorithm was used to calculate shear stiffness maps, and a threshold value of 0.95 for the R2 goodness-of-fit parameter during data fitting was used to classify reliable and unreliable data. Two ROI placements were used to analyze each patient’s images (Figure 1). For analysis method A, a trained analyst applied the QIBA method using MRE/Quant software (Mayo Clinic), to specify the largest possible adequate ROIs in the liver while excluding large blood vessels, liver edges, and including only regions with shear wave propagation determined by the analyst to be sufficiently linear. The analyst then analyzed the images a second time using method B, drawing the ROIs at the liver edge and including blood vessels within the liver. The shear wave data captured by outlining the entire liver was composed of all stiffness data considered reliable by the 0.95 R2 confidence threshold set in the analysis software. ROI sizes (pixels) and MRE stiffness values (kPa) were computed and recorded. The agreement of stiffness values between the two ROI placement methods was assessed using intra-class correlation coefficient (ICC), coefficient of variation for paired data (CV), and Bland-Altman analysis.Results
35 patients were included in the MRE analysis (22 male and 13 female). Mean BMI for all 35 patients was 29.6 kg/m2, with a standard deviation of 6.7 kg/m2. One patient had unusable MRE data due to iron overload and was not included in the statistical analysis. The ICC for the two ROI-drawing methods was 0.980, with a 95% confidence interval of (0.955, 0.991). The CV was 6.27%. The Bland-Altman bias was 0.161 with a standard deviation of 0.353, limits of agreement (-0.531, 0.854), and a p-value of 0.0119 (Figure 2).Discussion
The ICC and CV suggest strong agreement between the two methods, although a statistically significant bias was observed. As illustrated in Figure 2, method B increasingly underestimates stiffness relative to method A as stiffness increases. This is likely because in method A, the areas of lower stiffness in livers with elevated stiffness are typically excluded by the reader due to poor wave quality. An advantage to method B is that subjectivity is minimized by simply tracing the liver, and decisions regarding wave quality are removed from the analysis process.Conclusion
Drawing MRE ROIs by tracing the liver edge and relying on only the confidence mask agrees well with analysis following the QIBA guidelines. However, a bias is present that grows as stiffness increases. Further study with larger cohorts and additional data analysts is needed to further explore our findings.Acknowledgements
No acknowledgement found.References
1. Qiba Profile: Magnetic Resonance Elastography of the Liver. https://qibawiki.rsna.org/images/c/ca/Draft-MRE-QIBAProfile-2017-07-28_clean.pdf. Quantitative Imaging Biomarker Alliance, 2017 Accessed: 8 Nov 2017Figures
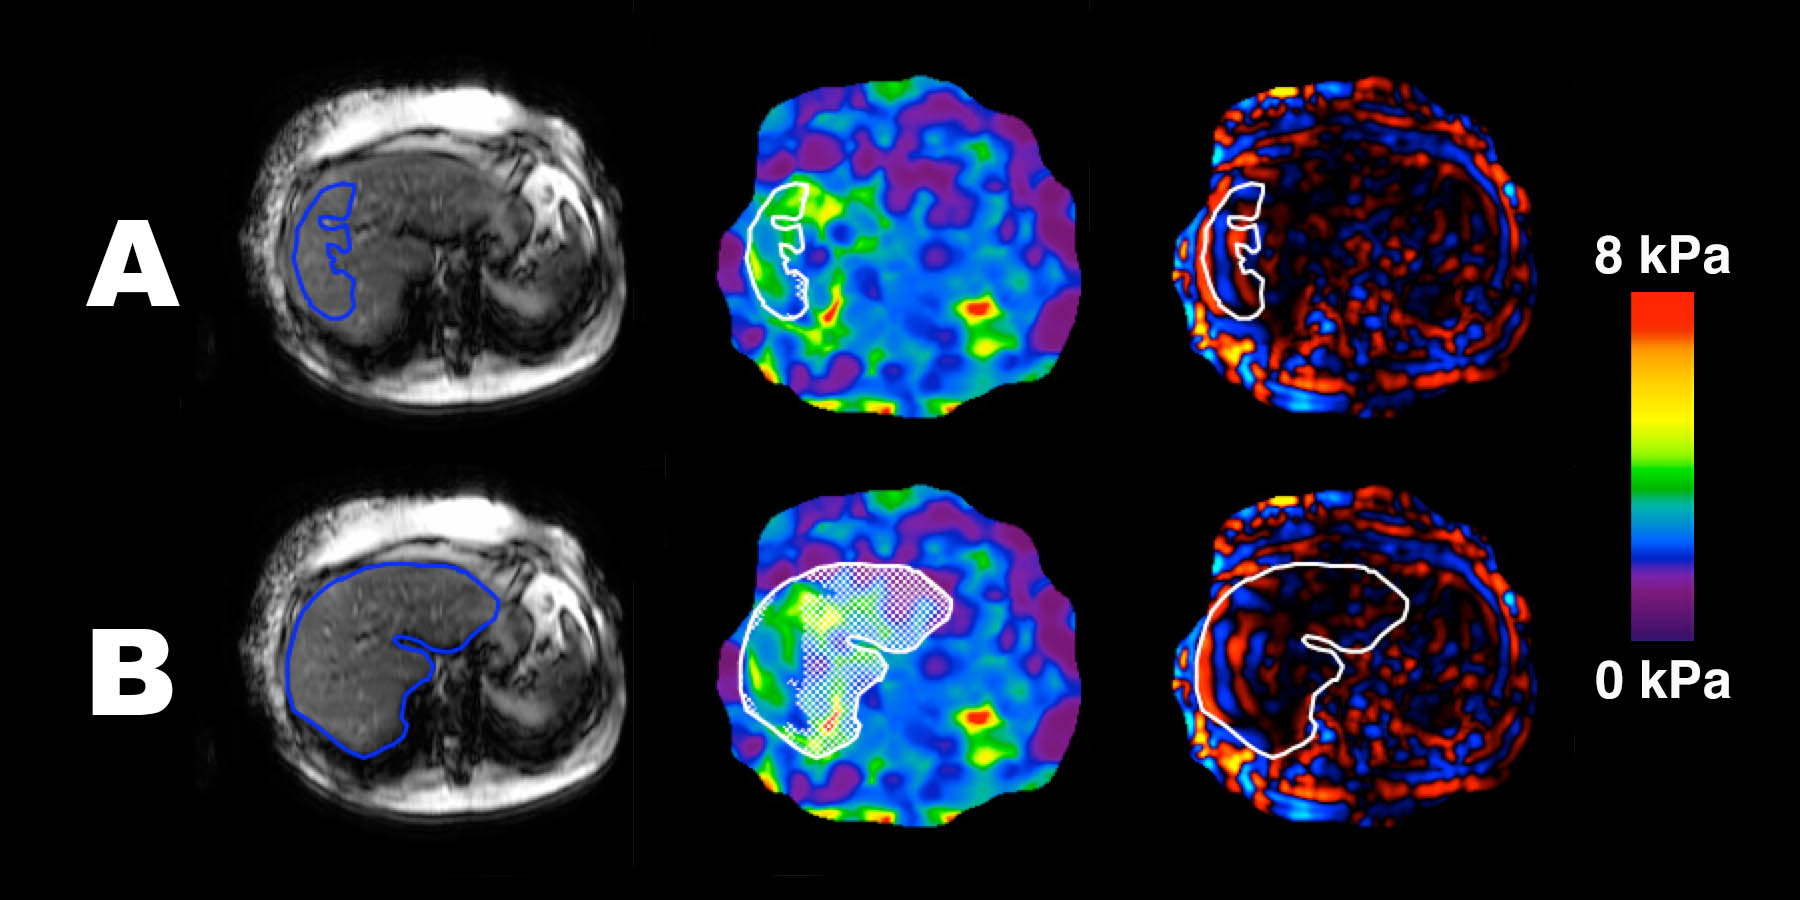
Figure 1 shows ROIs drawn using both methods on magnitude images, stiffness maps, and wave images.
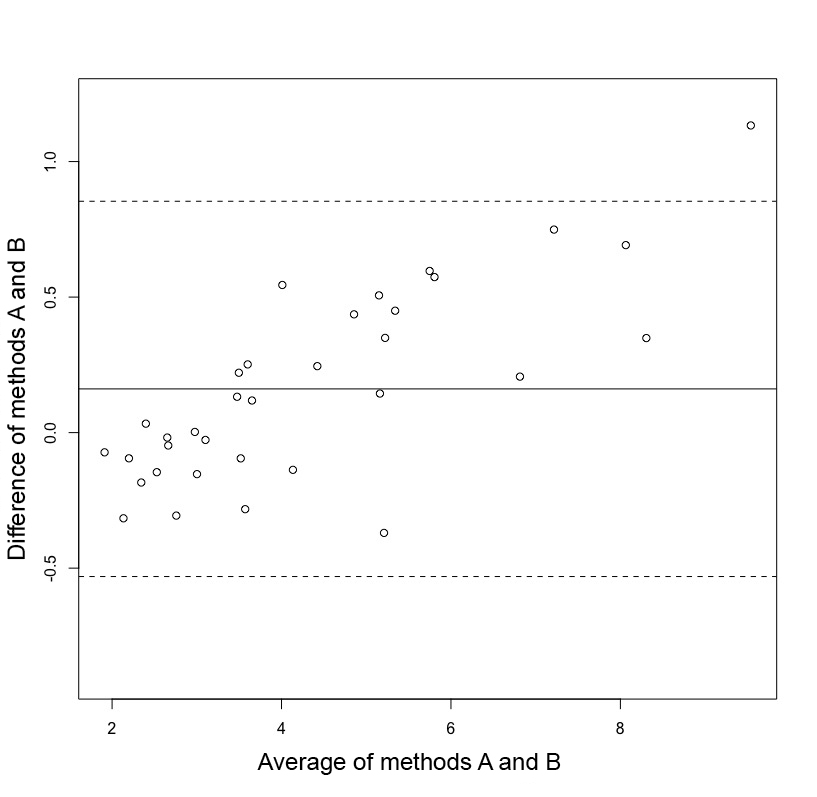
Figure 2 shows a Bland-Altman plot comparing stiffness values obtained from the two methods (kPa).