2595
Impact of Motion-Encoding Gradient (MEG) Direction, Slice Position and Slice Orientation on the estimation of Liver Stiffness using Magnetic Resonance Elastography (MRE) in clinical patients1Diagnostic and Interventional Radiology, Baylor St Luke's Medical Center, Houston, TX, United States, 2Physics and Texas Center for Superconductivity, University of Houston, Houston, TX, United States
Synopsis
As an extension of our previous work done in healthy subjects, we evaluate the impact of the direction of motion-encoding gradient (MEG), slice orientation, and coverage on the estimation of LS in 99 clinical patients referred for MRE. The results from the study show that: (a) liver stiffness (LS) measured with MEG superimposed over RL and AP directions was higher than that of LS measured with MEG in the FH direction; (b) Slight variations in the angulation of the transverse slice has negligible impact on LS estimates; and (c) The percentage area of the liver in which LS can be confidently measured (confidence map area) can have substantial variations (independent of direction of MEG) between slices and therefore, it may be beneficial to acquire more than one slice in a clinical setting.
INTRODUCTION
Studies at expert centers have shown that liver stiffness (LS) by MRE strongly correlates with invasive biopsy-based determination of LS1,2. Broader clinical acceptance of MRE can be facilitated if it is determined that LS estimation is robust across non-expert centers. Previously we evaluated the impact of experimental variables such as MEG direction, slice position and meal ingestion on the repeatability of LS in healthy volunteers3. In this study, we sought to evaluate the impact of following factors on the LS estimation in clinical subjects referred for a liver MRI: 1) MEG direction; 2) slice coverage and 3) slightly angulated non-transverse acquisition slice (15o with respect to transverse slice).METHODS
Patient Population: Clinical subjects (46/99 women; age, 59±14yrs; body mass index = 30.8±7.1kg·m-2) were recruited in this prospective IRB approved study after providing written informed consent.
Patient setup: All subjects were imaged at either 1.5 or 3.0T scanner (Philips). A 16-channel coil was used for signal reception. A passive acoustic transducer (Resoundant™, Rochester, MN) was tightly secured at the level of the xyphoid. The position of the transducer was adjusted if necessary to assure the best coupling of sound wave to liver. A TTL signal from the MR scanner was used to synchronize 60Hz acoustic motion with MEG. The acoustic amplitude was adjusted (30%-60% of the peak capacity of the driver) to ensure sufficient penetration of shear waves within the liver.
MRE acquisition: Three contiguous 10mm-thick transverse slices positioned at the largest area of liver in the scout images were used to measure LS. The MEG was applied sequentially along Anterior-Posterior (AP), Foot-Head (FH), Right-Left (RL) directions. Four wave images were acquired at progressively increasing the time delays between MEG and mechanical motion for each slice in 19s-breathold. Another set of three angulated transverse slices -a rotation of 15o with respect to FH direction-was acquired in 31/99 subjects to evaluate the effect of slice obliquity on LSFH. Other MRE parameters were: TR/TE/flip angle: 50ms/21.6ms/30o; field of view: 420mmx400mm; voxel size: 1.6mmx4.6mmx10mm; bandwidth: 110 Hz/pixel; sense factor of 2.
Data analysis: The four shear wave images for each slice at different MEG directions were processed using the program provided by Mayo Clinic (under a research agreement) to generate the LS and confidence maps reflecting the quality of wave data4. All images were further exported and analyzed using custom-built functions in MatLab (MathWorks, Natick,MA). The following comparisons using paired student t-test, linear regression and Bland-Altman methods were performed: 1) The LS estimated from MEG direction at AP and RL directions (LSAP, and LSRL) were compared to the LS from MEG direction at FH (LSFH); 2) LSFH was compared between a non-angulated transverse slice and slightly angulated transverse slice; 3) Confidence areas of reliable estimation of LS was compared among different MEG directions.
RESULTS
A total of 891 estimates of LS were analyzed (99 subjects x 3 slices/subject x 3 directions/subject). The absence or severity of liver fibrosis was staged per LS (measured with MEG in FH direction) criteria5,6 resulting in 62.2% (62/99) 21.2% (21/99), 4.0% (4/99), 6.1% (6/99), 5.0%(5/99) and 13.1% (13/99) subjects as those with normal and fibrosis grades F0, F1, F2, F3 and F4 respectively.
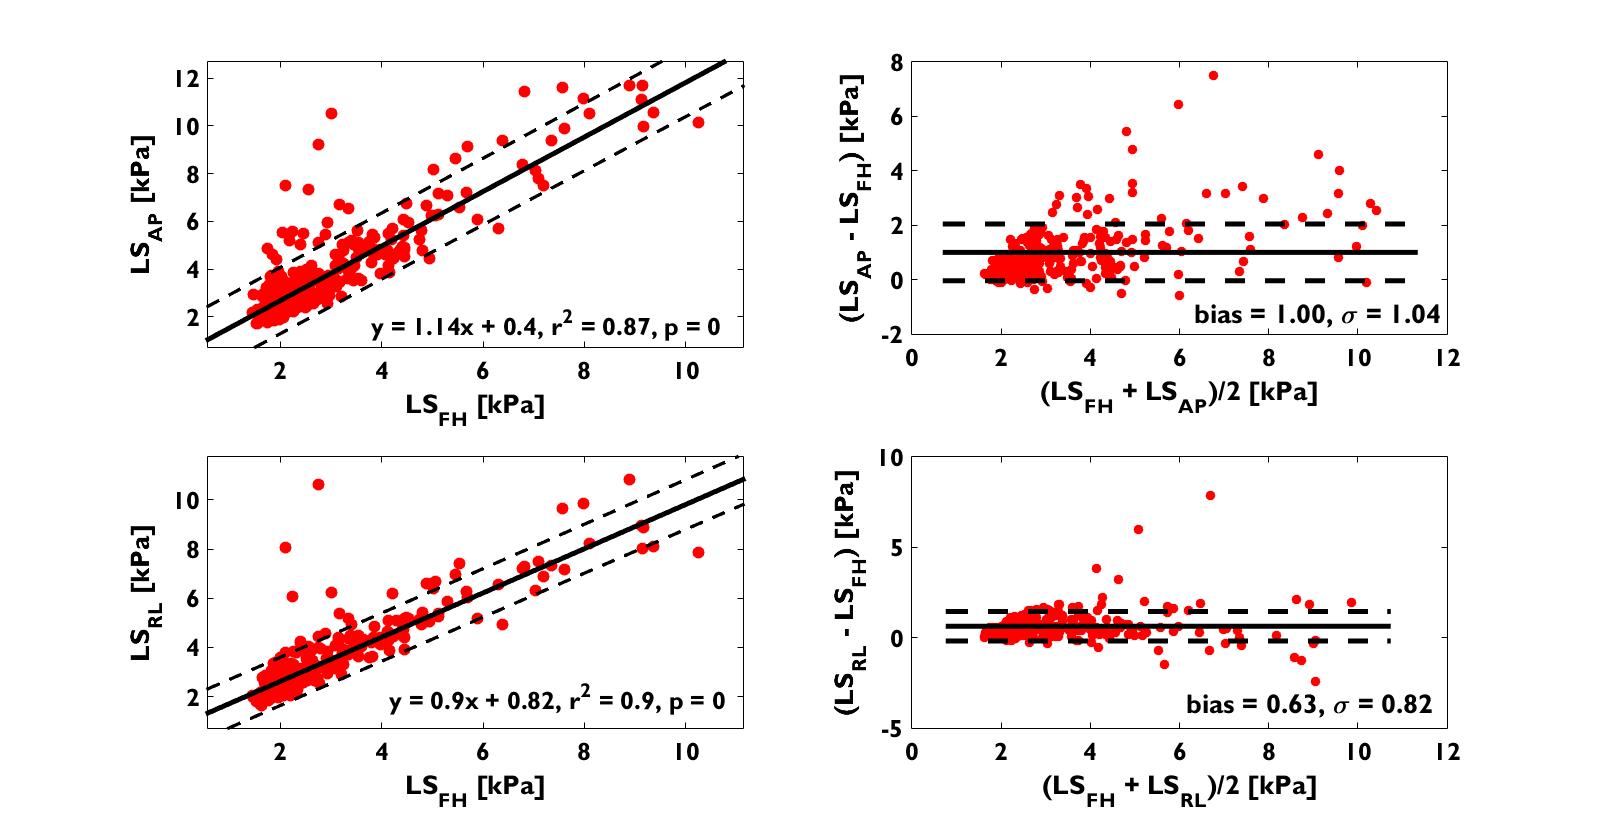
1. Both LSAP and LSRL strongly correlated with LSFH (r2=0.87, p<0.001 and r2=0.89, p<0.001 respectively) and demonstrated over estimations (bias±1SD) of 0.63±0.82kPa and 1.00±1.04kPa respectively (Figure 1). A paired Student’s t-test showed LSAP and LSRL are statistically significant different from LSFH (P<0.001).
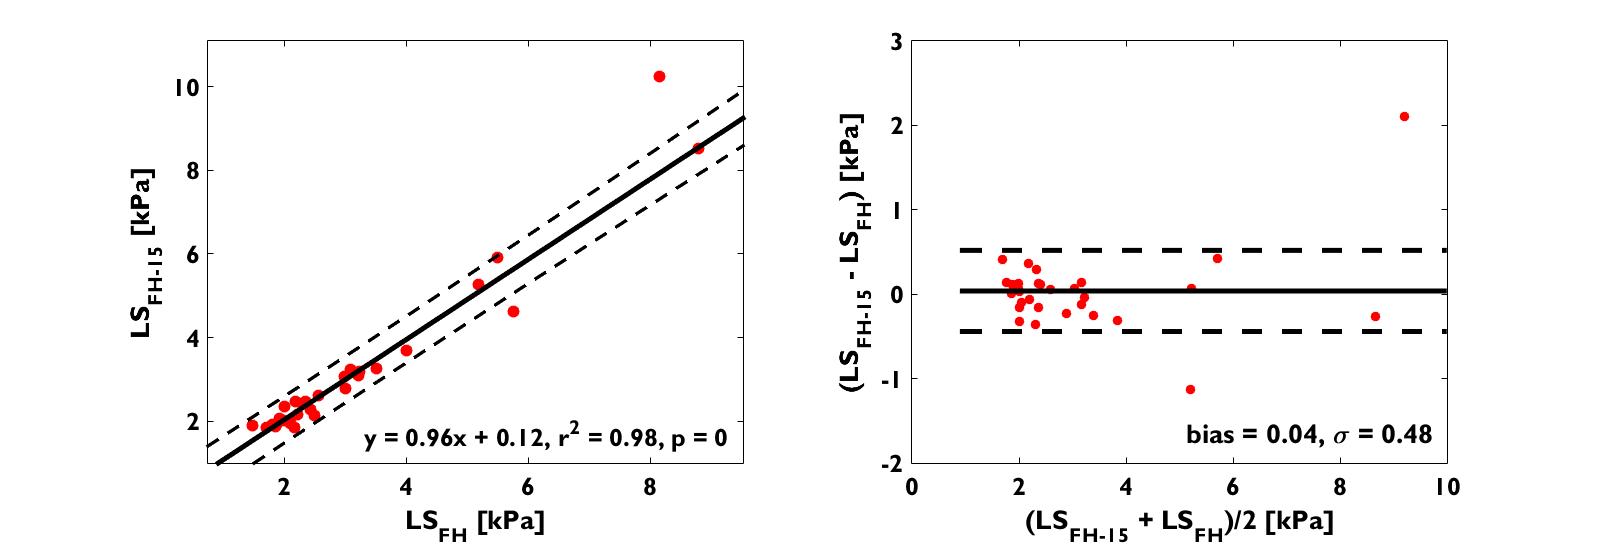
2. There is no statistical significant difference between LSFH measured in axial and oblique slice of 15o from 31 subjects (p = 0.66), and the difference was negligible: 0.04±0.48kPa. (Figure 2).
3. The percentage of liver area over which LS can be confidently estimated can vary across the three slices by 42%, 30%, and 27% for LSAP, LSFH, and LSRL, and there was no statistically significant difference between slices or MEG directions.
DISCUSSION AND CONCLUSION
Analogous to the findings in normal volunteers, LSAP and LSRL were significantly elevated when compared to LSFH across the entire range of LS; LSAP and LSRL both strongly correlated with LSFH. Furthermore, slight angulations (<15° in FH direction) of the transverse slice –as one may encounter in clinical settings -has little impact on the estimation of LSFH. This is because the expected LS change is ~0.25kPa which is within the measurement error (~0.3kPa) of LS. However, a greater obliquity may potentially introduce significant variation in LS. Similarly, while a single slice location can yield LSFH values, the large variability of the confidence area across slices suggest that it may be more practical to acquire more than one slice as a matter of practical convenience.Acknowledgements
No acknowledgement found.References
1. Yin M, Talwalkar JA, Glaser KJ, et al. Assessment of hepatic fibrosis with magnetic resonance elastography. Clin Gastroenterol Hepatol 2007;5(10):1207-1213 e1202.
2. Huwart L, Peeters F, Sinkus R, et al. Liver fibrosis: non-invasive assessment with MR elastography. NMR Biomed 2006;19(2):173-179.
3. Zhang J, Arena C, Pednekar A, et al. Short-Term Repeatability of Magnetic Resonance Elastography at 3.0T: Effects of Motion-Encoding Gradient Direction, Slice Position, and Meal Ingestion. J Magn Reson Imaging 2015.
4. Manduca A, Oliphant TE, Dresner MA, et al. Magnetic resonance elastography: non-invasive mapping of tissue elasticity. Med Image Anal 2001;5(4):237-254.
5. Singh S, Venkatesh SK, Wang Z, et al. Diagnostic performance of magnetic resonance elastography in staging liver fibrosis: a systematic review and meta-analysis of individual participant data. Clin Gastroenterol Hepatol 2015;13(3):440-451 e446.
6. Venkatesh SK, Ehman RL. Magnetic resonance elastography of liver. Magn Reson Imaging Clin N Am 2014;22(3):433-446.
Figures