2592
Comparison of Breath-Hold (BH) and Respiratory-Triggered (RT) Fast Field Echo (FFE) Hepatic MR Elastography (MRE)1Philips, Cincinnati, OH, United States, 2Philips, Wickliffe, OH, United States, 3Radiology, Cincinnati Children's Hospital Medical Center, Cincinnati, OH, United States
Synopsis
We compared breath-hold (BH) and respiratory-triggered (RT) two-dimensional (2D) fast field echo (FFE) MR elastography (MRE) liver stiffness measurements in adult volunteers showing comparable results between t techniques.
Introduction
MRE allows noninvasive measurement of hepatic stiffness which correlates with histopathologic grading of fibrosis (1-3). Currently, MRE images are acquired with breath holding to limit motion artifact. However, children and adults with chronic liver diseases may have difficulty holding their breath for the required acquisition time. In this work, we compare BH and RT 2D FFE MRE liver stiffness measurements in adult volunteers.
Materials and Methods
Twenty-two volunteers (14 female, 8 male; mean age 33 years; range 20-61 years) (6 hours fasting status) were recruited under an approved institutional review board protocol. 2D FFE MRE was performed on a Philips Ingenia 1.5T scanner (Best, The Netherlands) using a 28-channel posterior and anterior coil array. Scan parameters were as follows: TR=50 msec; TE=22 msec; flip angle=30°; acquisition matrix=256x64; 3 motion cycles per TR; motion frequency=60 Hz; slice thickness=10 mm, slice gap=1 mm; and SENSE factor=2. Motion encoding gradients were applied along the slice select direction. Respiratory-triggering was accomplished using a sensor placed on the abdomen and implemented so that image acquisition occurred during expiration. The scan time for RT MRE was about 3 minutes. BH MRE was acquired in 4 breath holds of 14 seconds each.
Four axial slices through the mid liver were obtained for each sequence. MR elastograms were generated using a multimodal direct inversion (MMDI) algorithm (Mayo Clinic, Rochester, MN), with overall liver stiffness calculated as an average of mean stiffness measured on each slice (kPa). The size of the reliable region of interest (ROI) provided by the MMDI algorithm and bounded by the confidence maps was recorded. Mean liver stiffness values were compared using paired t-test and Bland-Altman difference analysis. Absolute agreement in liver stiffness measurements was determined by calculating the single-measure intra-class correlation coefficient (ICC). ROI size was compared using the paired t-test.
Results
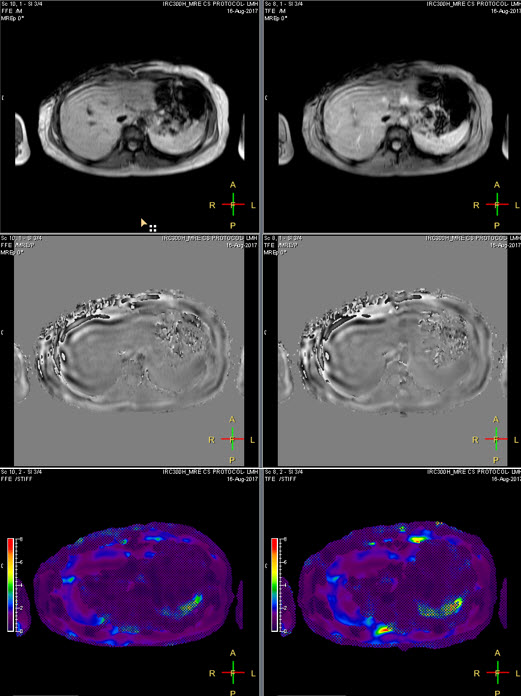
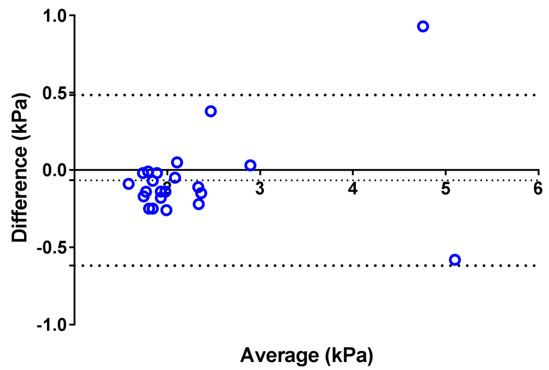
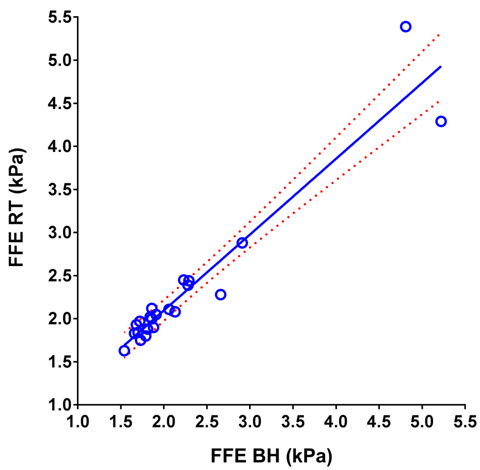
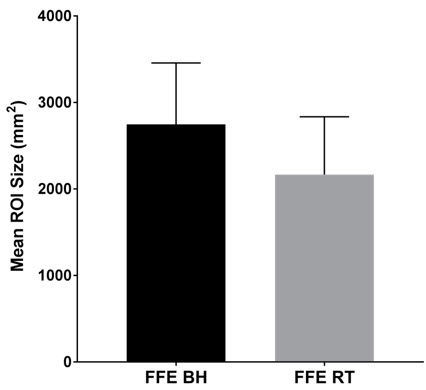
Fig.1 shows representative MRE data from one of the volunteer subjects acquired with both techniques. For the entire population, mean liver stiffness was 2.25 ± 0.96 kPa by BH FFE MRE and 2.32 ± 0.88 kPa by RT FFE MRE (p=0.28). Mean bias between techniques was -0.07 kPa (95% limits of agreement: -0.62 to +0.49 kPa), with a single statistical outlier (Fig. 2). There was excellent agreement between liver stiffness values derived from the two acquisition techniques with ICC=0.95 (Fig. 3). Measurable ROIs were larger, on average, with BH MRE vs. RT MRE (2748 ± 710 mm2 vs. 2167 ± 668 mm2; p=0.003) (Fig. 4).Conclusion
RT 2D FFE MRE measurements provide comparable liver stiffness measurements to BH 2D FFE MRE in adult volunteers. RT MRE may serve as an alternative to the standard BH MRE technique in patients with limited breath-holding capacity.Acknowledgements
No acknowledgement found.References
[1] Yin et.al, Radiology 2016, 278(1):114-24. [2] Xanthakos et. al, J Pediatr 2014, 164(1):186-8. [3] Serai et. al, Abdom Imaging 2015, 40(4): 789-94.Figures