2591
Inter reader agreement for liver Magnetic Resonance Elastography region-of-interest (ROI)-size, -overlap, -placement, and stiffness estimation in adults in a clinical trial1Liver Imaging Group, Radiology, UCSD, San Diego, CA, United States, 2Computational and Applied Statistics Laboratory, UCSD, San Diego, CA, United States, 3NAFLD Research Center, Division of Gastroenterology, Department of Medicine, UCSD, San Diego, CA, United States
Synopsis
MR elastography (MRE) is an established technique for the non-invasive assessment of hepatic stiffness and fibrosis, and is commonly performed using a gradient-echo-acquisition of four slices through the widest portion of the liver. The mean liver-stiffness is calculated as the average of the ROI pixel values over all four stiffness map slices. Identification (drawing) of these ROIs is subjective, relying on reader judgment to assess the wave-quality. This study examines the inter-reader agreement of MRE-ROI-size, overlap and placement, and how they affect the MRE shear-stiffness values in adults with known or suspected nonalcoholic fatty liver disease.
Introduction
MR elastography (MRE) is an established technique for the non-invasive assessment of hepatic stiffness and fibrosis1,2,3, and commonly is performed using a gradient-echo-acquisition. The inter-examination repeatability of MRE is well studied and has formed the basis for an MRE QIBA(Quantitative-Imaging-Biormarker-Alliance)-Profile with pooled repeatability-coefficient of 22% (95% CI: 16.1%, 28.2%)4. QIBA-profile requires same reader at all time points, as there is lack of data about reader agreement. MRE analysis has objective and subjective components. Objective component is the mathematically defined and automatically generated confidence map computed to depict portions of the elastogram5,6 within the liver edges with reliable MRE data, based on the goodness of data fitting. Subjective components are exclusion of “large vessels” (not objectively defined) and assessment of wave quality. These latter steps are considered important because the MRE data may be “reliable” based on confidence map and yet include large vessels, and/or areas with low wave quality (e.g., non-coherent wave motion), factors that may introduce errors. Regions-of-interest (ROIs) are drawn manually on magnitude images of the liver to include liver tissue with good wave-quality data. The mean shear-stiffness value is then computed from these regions. The drawing of these ROIs is subjective, relying on reader judgment to assess the wave quality. Consequently, there may be reader variability in ROI-size and placements and the effects of which on stiffness estimation is unknown. Therefore, the purpose of this study is to assess inter-reader agreement of MRE ROI-size, overlap and placement, and how they affect the MRE shear-stiffness values in adults with known or suspected nonalcoholic fatty liver disease (NAFLD).Methods
This is a retrospective cross-sectional analysis of patients in a clinical-trial with known or suspected NAFLD, who underwent 3T 2D-GRE-MRE for hepatic stiffness quantification. Two highly experienced readers, each of whom has analyzed in excess of 1000 MRE exams placed the largest possible ROIs using custom software (MRE/Quant software, Mayo Clinic). The ROIs included liver tissue with reliable MRE data (based on the confidence maps) and adequate wave propagation (based on qualitative inspection), while excluding large blood vessels and liver edges. ROI-sizes and MRE stiffness values were computed and recorded. Bland-Altman (BA) plots for the two readers’ ROI-sizes and for the associated stiffness were computed. The correlation agreement between stiffness values of the two readers and the relationship between ROI-size and stiffness differences of the two readers were assessed using Pearson’s r. Jaccard similarity coefficient, defined as the intersection divided by the union (i.e. proportion of ROI overlap), was computed for the two readers’ ROIs of each subject.Results
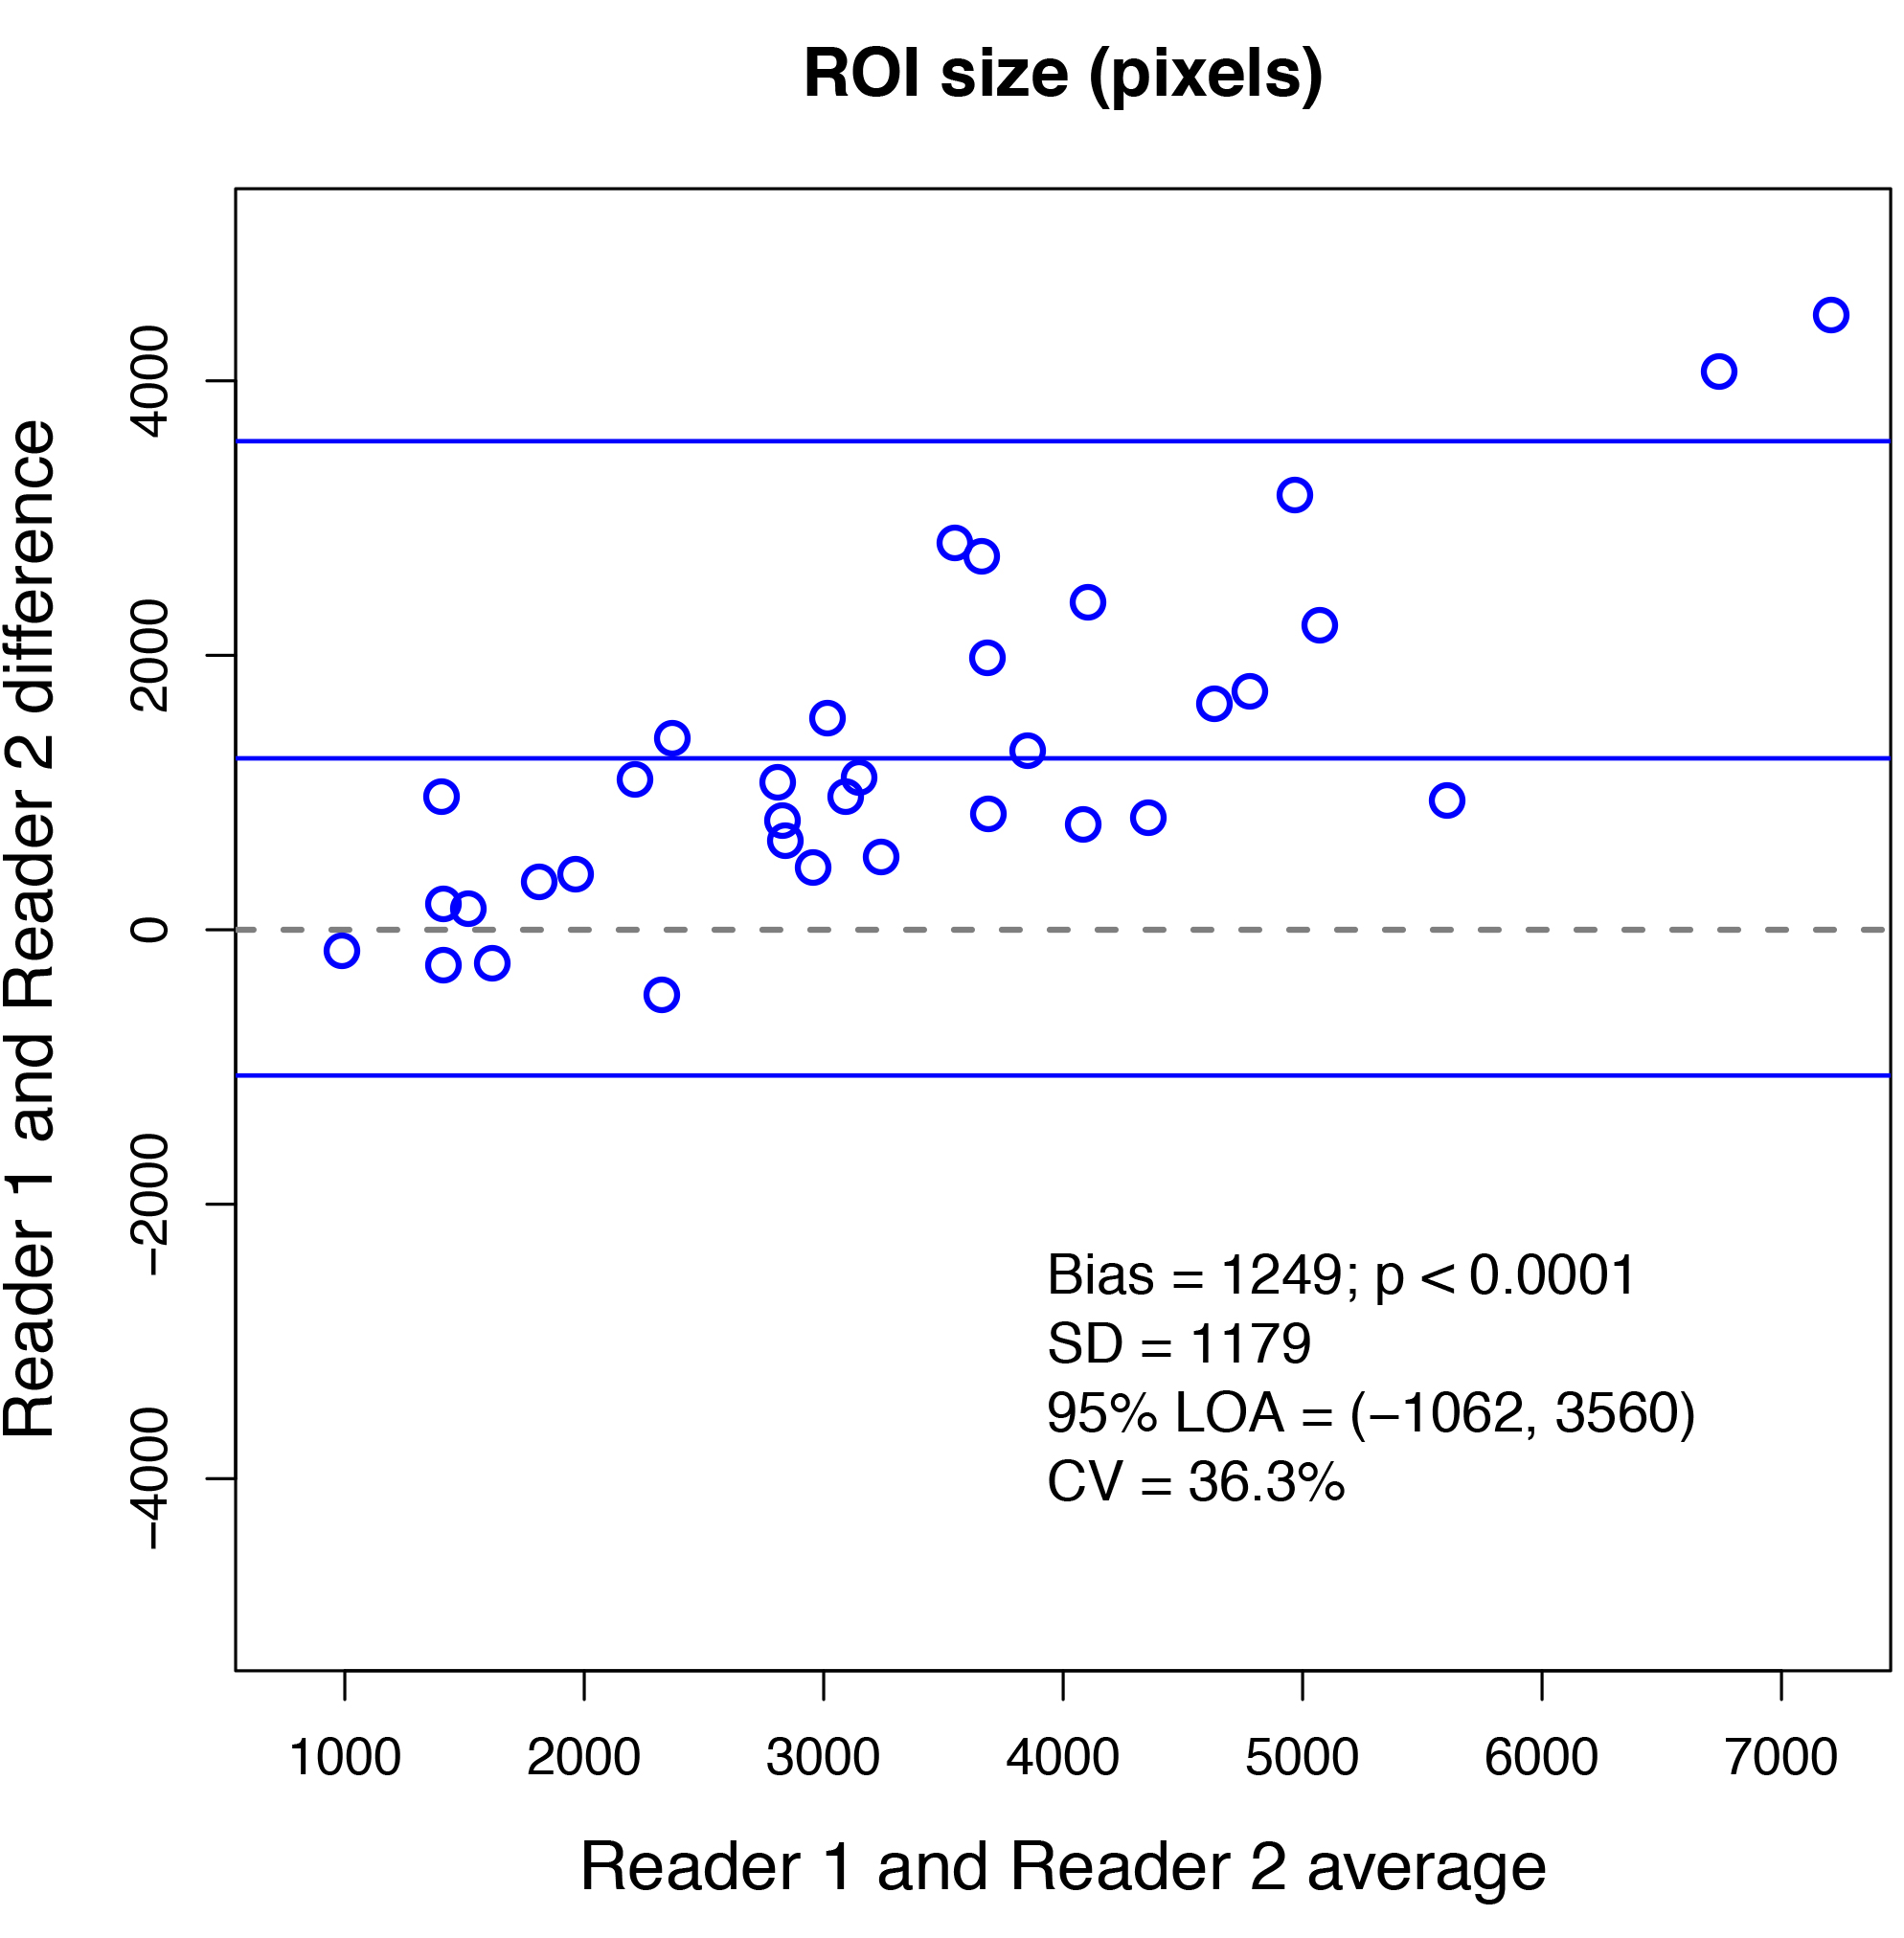
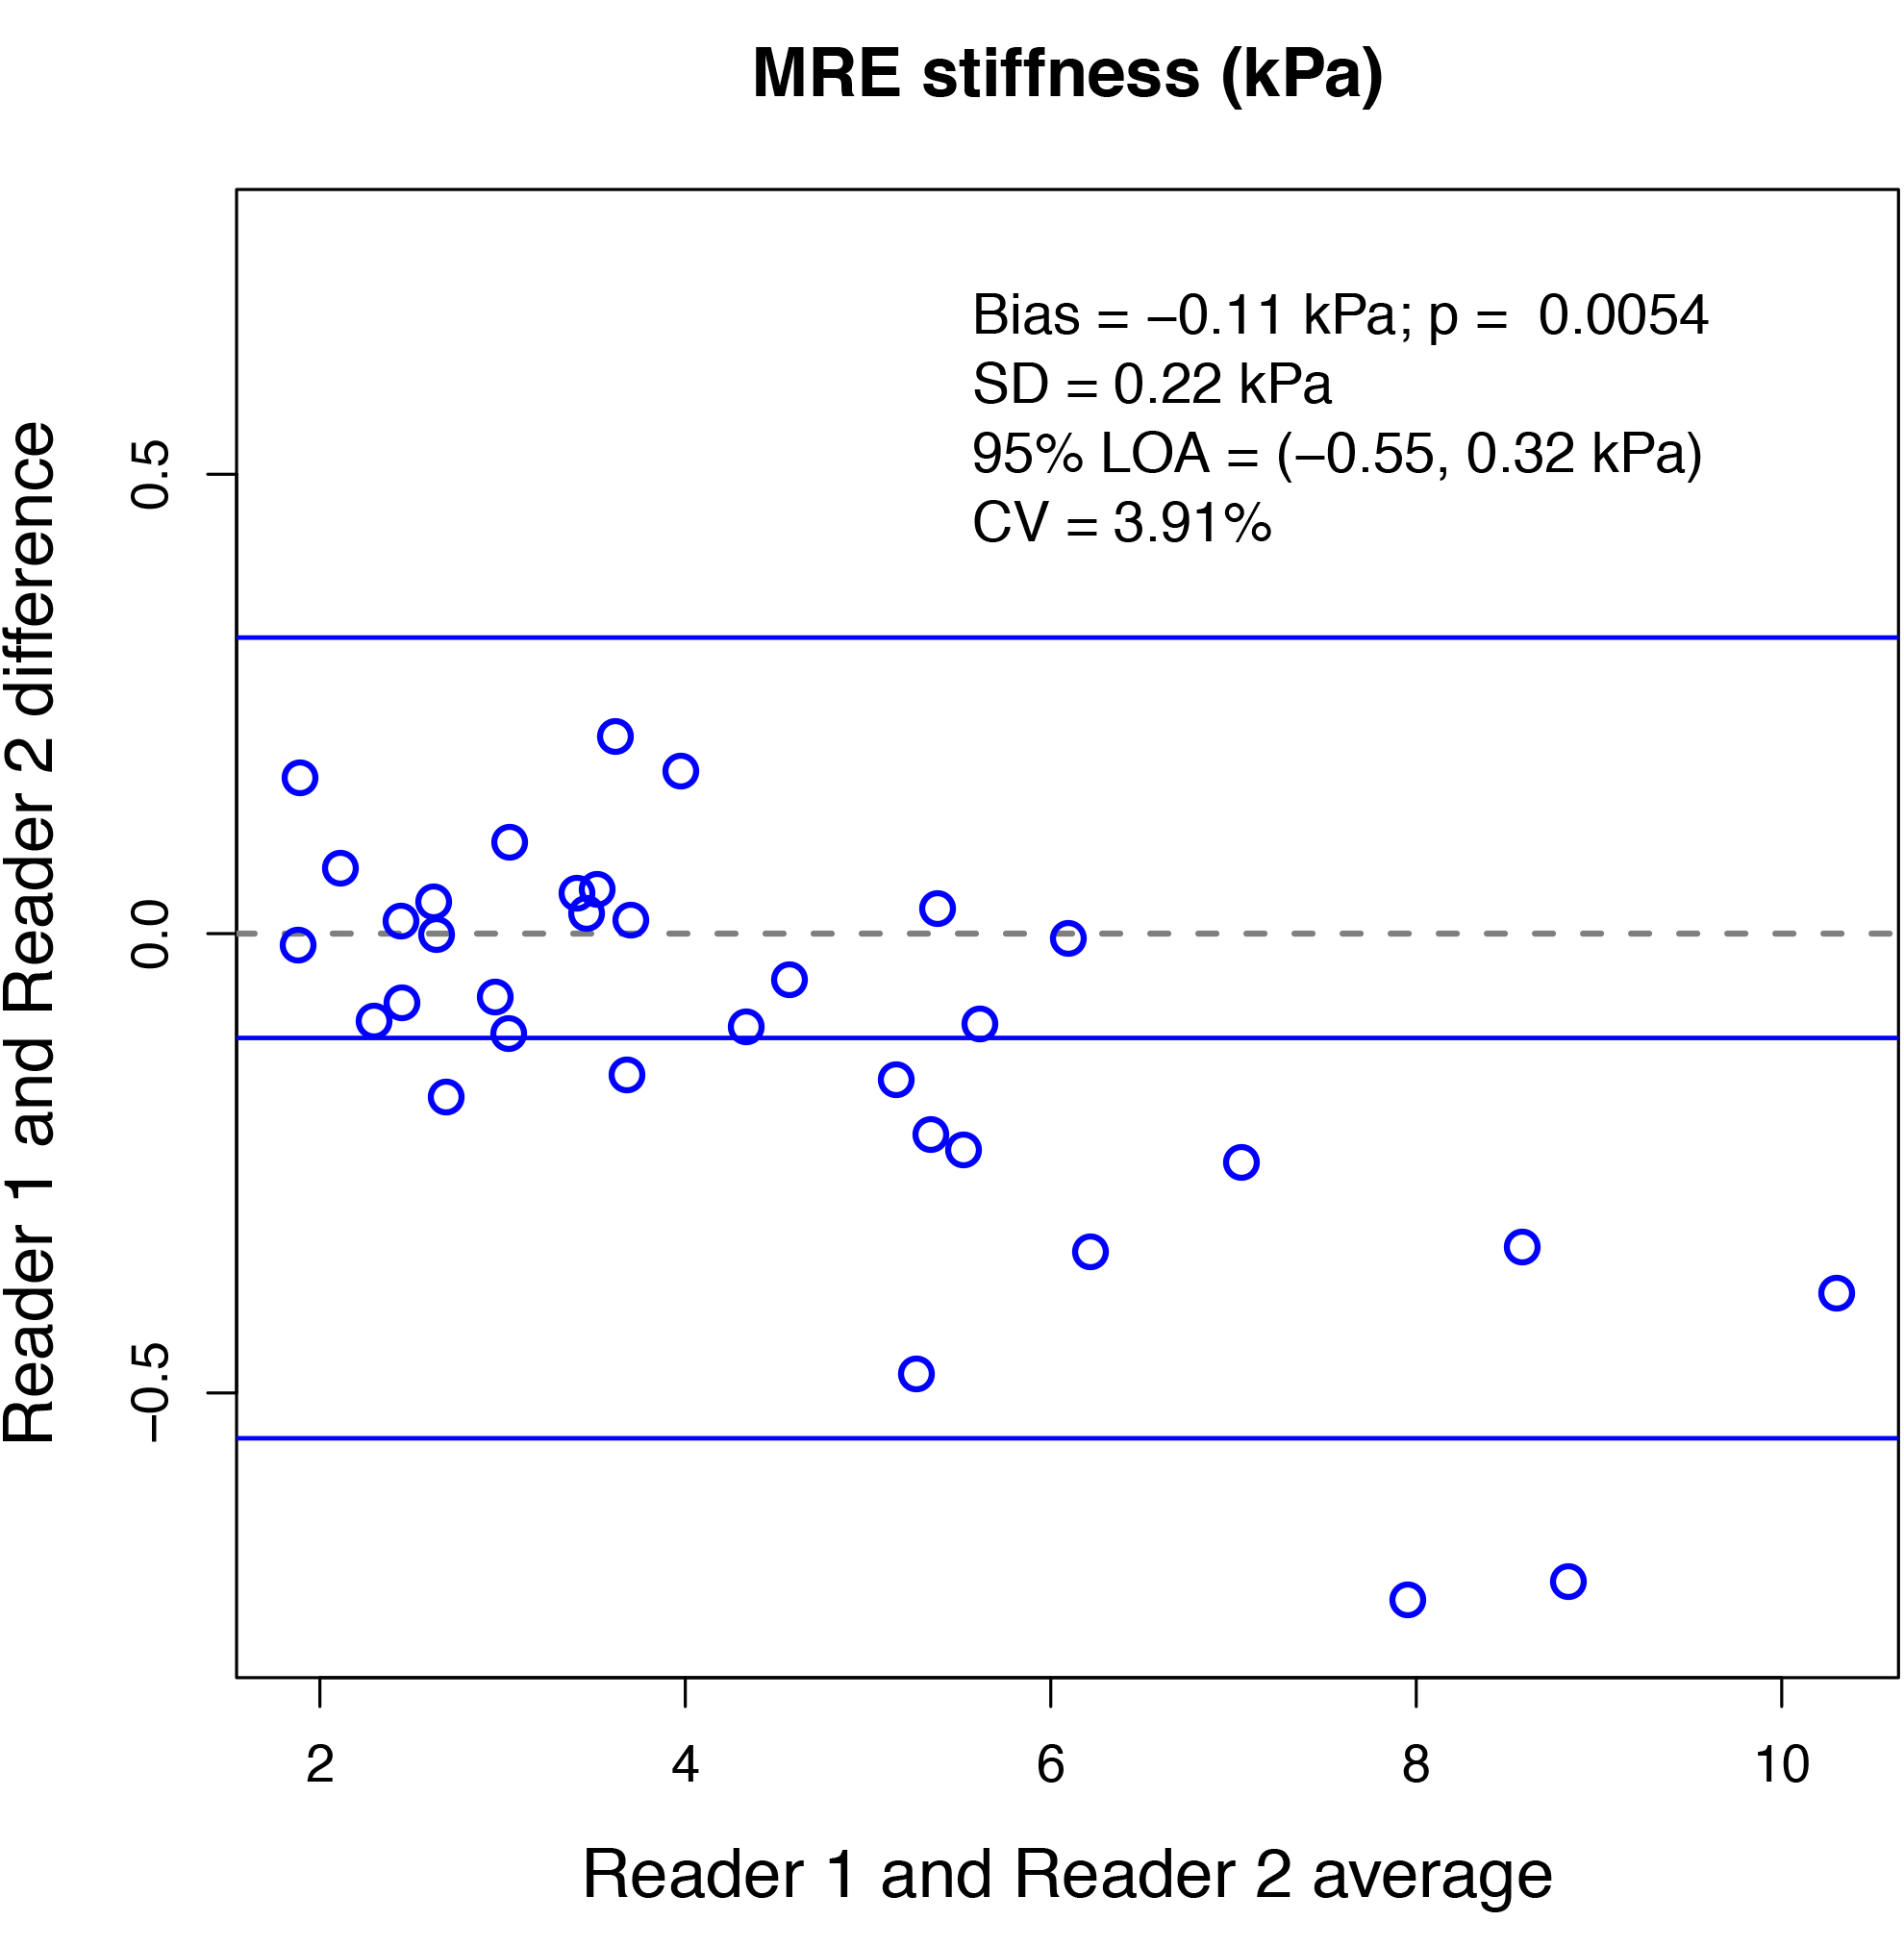
35 patients were included in the MRE analysis (22 male and 13 female). Mean BMI for all 35 patients was 29.6 kg/m2, with a standard deviation (SD) of 6.7 kg/m2. One patient was excluded because there were no valid MRE pixels by either readers’ analysis. Limits of agreement (LOA) were (-1062, 3560), SD was 1179 and BA bias was 1249 for ROI-sizes; LOA were (-0.55, 0.32), SD was 0.22 and BA bias was -0.11 for associated liver stiffness values between the two readers (figures 1, 2). The mean liver stiffness was 4.4 kPa for reader one, 4.5 kPa for reader two, and the Pearson r between the two readers was 0.99 (p < 0.0001). Difference in ROI-size between readers was significantly correlated with difference in estimated stiffness between two readers (Pearson’s r=-0.35, and p=0.0444). The average Jaccard index was 0.49 with a SD of 0.09.Discussion
Two highly experienced readers trained in the same setting and qualified to perform clinical-trial analyses have modest agreement on ROI size and placement. There is a bias with one reader consistently drawing larger ROIs. The larger ROIs are associated with higher stiffness in the low stiffness range and lower stiffness in the high stiffness range. Although there was a significant difference in the estimated liver stiffness, the differences were small and not likely clinically significant. The modest agreement between highly trained analysts is likely due to differences in subjective components of MRE ROI analysis.Conclusion
Although we found significant differences in the areas found by two readers, this had no clinical effect on the estimated liver stiffness value.Acknowledgements
No acknowledgement found.References
1. Tang A, Cloutier G, Szeverenyi NM, Sirlin CB. Ultrasound Elastography and MR Elastography for Assessing Liver Fibrosis: Part 1, Principles and Techniques. AJR Am J Roentgenol 2015;205(1):22-32.
2. Tang A, Cloutier G, Szeverenyi NM, Sirlin CB. Ultrasound Elastography and MR Elastography for Assessing Liver Fibrosis: Part 2, Diagnostic Performance, Confounders, and Future Directions. AJR Am J Roentgenol 2015;205(1):33-40.
3. Loomba R, Wolfson T, Ang B, et al. Magnetic resonance elastography predicts advanced fibrosis in patients with nonalcoholic fatty liver disease: a prospective study. Hepatology 2014;60(6):1920-192
4. Serai, S. D, Obuchowski, N. A, Venkatesh, S. K, Sirlin, C. B, Miller, F. H, Ashton, E, Cole, P. E, Ehman, R. L. Repeatability of MR Elastography of Liver: A Meta-Analysis. Radiology 2017;285(1):92-100.
5. Manduca A, Oliphant TE, Dresner MA, et al. Magnetic resonance elastography: non-invasive mapping of tissue elasticity. Med Image Anal 2001;5(4):237-254.
6. Manduca A, Lake DS, Kruse SA, Ehman RL. Spatio-temporal directional filtering for improved inversion of MR elastography images. Medical Image Analysis 2003;7(4):465-473.
Figures