2590
The role of MRE in predicting the degree of esophageal varices in patients with hepatitis B cirrhosis1Captial medical university, Beijing friendship hospital, Beijing, China, 2Hepatology, Captial medical university, Beijing friendship hospital, Beijing, China
Synopsis
This abstract showed that liver and spleen stiffness value based on MRE was correlated well with the degree of esophageal varices, and they can be used to predict the degree of esophageal varices on hepatitis b cirrhosis patients.
Objective: to evaluate the role of liver stiffness (HS), spleen stiffness (SS) based on magnetic resonance elastography (MRE) in the prediction of the degree of esophageal varices as a complication of patients with hepatitis B cirrhosis.
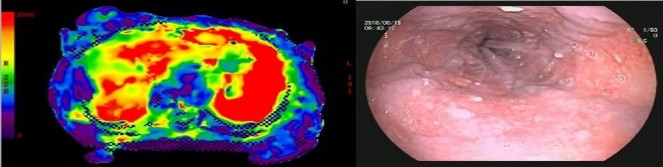
Materials and methods: 53 patients who met the inclusion criteria were included in the study group and the MRE and gastroscopy were conducted. The time between MRE and gastroscope was not more than one month. After MRE scan, the average values of HS, SS were obtained by four times measurements. Esophageal varices are classified into four types (0-3) based on the endoscopic expression of the gastroscope. Among them, 0 and 1 are classified as low-risk groups, and 2 and 3 are classified as high-risk groups. To evaluate the correlation between HS, SS and the degree of esophageal varices. To evaluated the differences in HS and SS between high and low risk groups. The ROC curves were used to evaluate and compared diagnostic efficacy of HS and SS in differentiation the degree of esophageal varicose veins between low and high-risk groups.
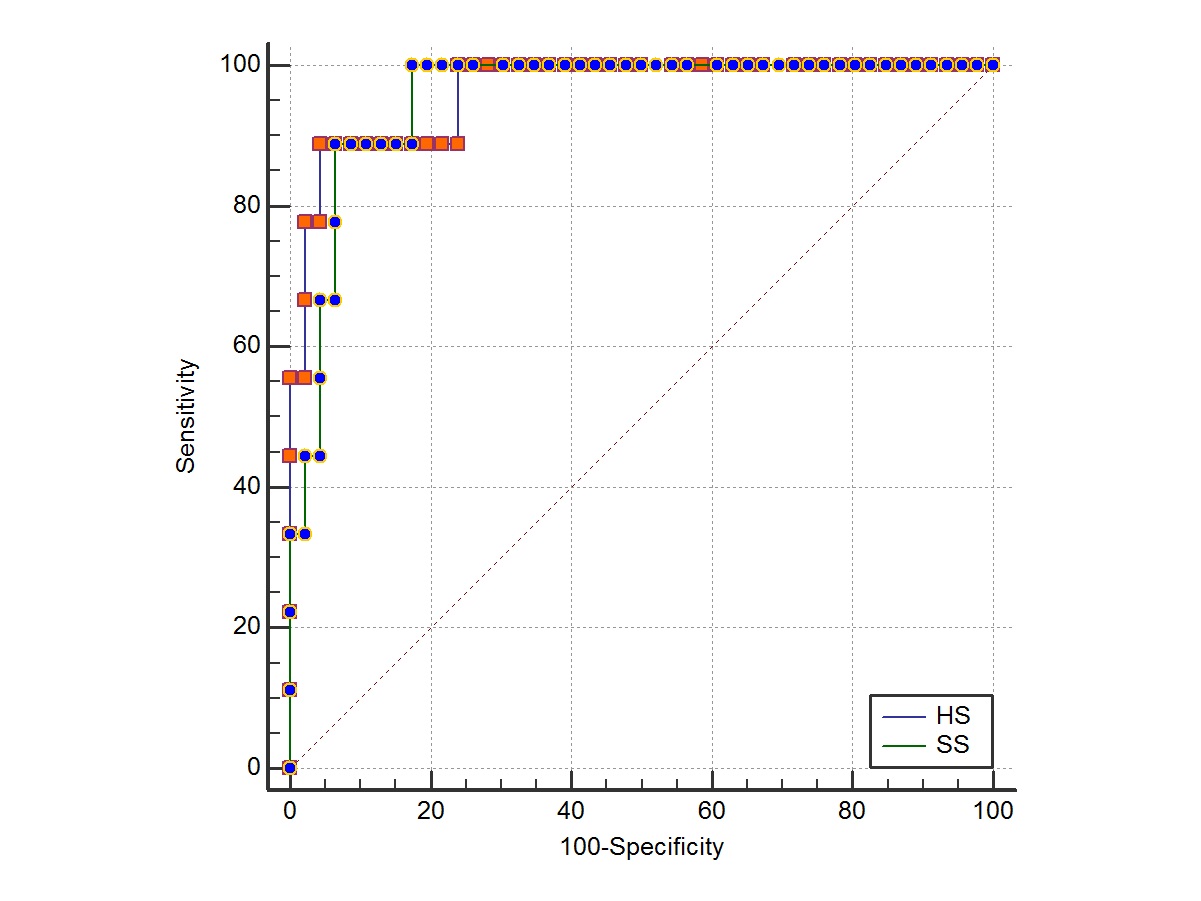
Results: the degree of HS and SS was correlated well with the degree of esophageal varices (r =0.627, p<0.01 for HS, r=0.730, p<0.01 for SS, respectively). The mean value of HS of high and low risk group was 5.72kPa and 3.69kPa, respectively, and there was significant difference between them (p < 0.01). The mean value of SS of high and low risk group were 11.86 kPa and 7.98 kPa respectively, and there were significant statistical differences (p < 0.01). The area under ROC curve of HS and SS in differentiation of low and high risk esophageal varices was 0.964 and 0.954, respectively, with no statistical difference. With 5.37 kPa as the cut-off value, the sensitivity and specificity of the HS between high and low risk esophageal varices were 88.89% and 95.65% respectively. The sensitivity and specificity of SS between high and low risk esophageal varices were 100% and 82.61%, respectively, with 8.96 kPa as the cut-off value.
Conclusion: the liver and spleen stiffness value based on MRE can be used to predict the degree of esophageal varicosity on hepatitis b cirrhosis patients.
Acknowledgements
noReferences
- Shin S U, Lee J M, Yu M H, et al. Prediction of Esophageal Varices in Patients with Cirrhosis: Usefulness of Three-dimensional MR Elastography with Echo-planar Imaging Technique[J]. Radiology, 2014, 272(1):143-53.
- Singh S, Eaton J E, Murad M H, et al. Accuracy of spleen stiffness measurement in detection of esophageal varices in patients with chronic liver disease: systematic review and meta-analysis.[J]. Clinical Gastroenterology & Hepatology, 2014, 12(6):935-945.
- Ma X, Wang L, Wu H, et al. Spleen Stiffness Is Superior to Liver Stiffness for Predicting Esophageal Varices in Chronic Liver Disease: A Meta-Analysis[J]. Plos One, 2016, 11(11):e0165786.
Figures