2589
MR Elastography in Primary Sclerosing Cholangitis: Interobserver Agreement for Liver Stiffness Measurement1Radiology, Mayo Clinic, Rochester, MN, United States, 2Gastroenterology and Hepatology, Mayo Clinic, Rochester, MN, United States
Synopsis
Primary sclerosing cholangitis (PSC) is a chronic liver disease characterized by heterogeneous distribution of increased stiffness in periphery, segmental or lobar pattern. The heterogeneity of liver stiffness has raised concerns for reproducibility of liver stiffness measurement (LSM). We performed interobserver agreement analysis for LSM with two readers drawing manual regions of interest (ROI) and with an automated algorithm. Our study results show that large geographical ROIs including the focal regions of increased liver stiffnesses have excellent agreement between readers and automated method. Therefore large geographical ROIs using either manual or automated methods should be used for LSM in PSC patients.
Introduction
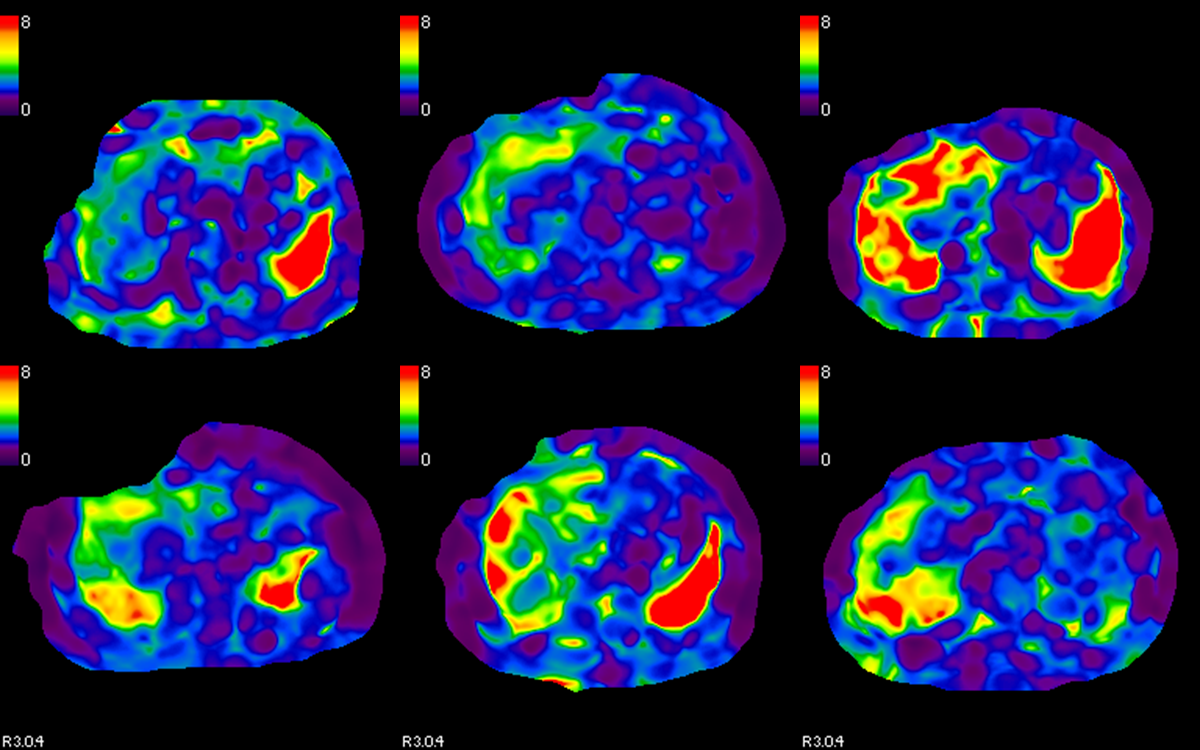
Primary Sclerosing Cholangitis (PSC) is a chronic liver disease of unknown etiology characterized by multifocal and segmental biliary strictures and associated with an increased risk of cholangiocarcinoma. Untreated PSC leads to liver fibrosis and progresses to cirrhosis and its associated complications. Detection and staging of liver fibrosis is important in clinical follow-up as these patients would ultimately need liver transplantation. MR Elastography is an established technique for evaluation of liver fibrosis in chronic liver diseases (1). MR Elastography of PSC shows characteristic peripheral/multifocal/segmental or lobar regions of increased stiffness with central less stiff regenerative parenchyma/regenerative nodules (1,2) (fig.1). This heterogeneous distribution of stiffness has raised doubts about reproducibility of the liver stiffness measurement (LSM). It is therefore important to evaluate the reproducibility of LSM in PSC patients and reliability of the MRE in the evaluation of liver fibrosis in PSC.Methods
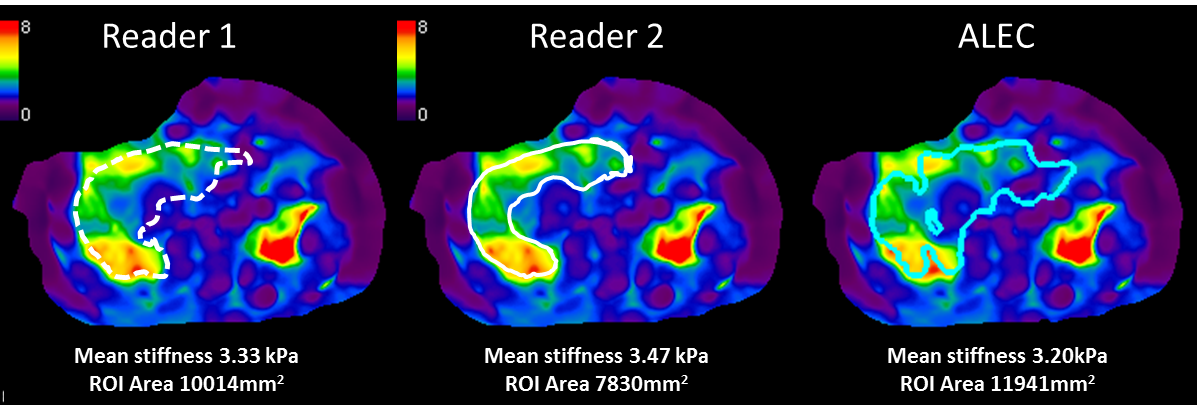
The study group consistent of 79 consecutive patients with known PSC and who had a liver MRI and MRE performed as either a diagnostic or follow up study. The MRE was performed with our standard clinical MRE protocol that consisted of 2D-GRE-MRE sequence, 4 x 10mm thick slices through the largest cross-section of the liver. Elastograms (stiffness maps) were generated automatically by inversion algorithm installed on the scanner. Gray scale, color scale maps and color scale with overlaid confidence maps were produced. Two radiologists with variable experience in MRE (11 years and 1 year) independently performed LSM on an advantage window station (Advantage Windows, 2.0, GE). The readers drew geographical region of interest (ROI) avoiding liver edges, fissures, large vessels, wave interference and artifacts using the magnitude image and adjusted the ROIs to fit within the valid regions of the confidence map. ROIs were drawn as large as possible and included focal or regional areas of increased stiffness. The mean liver stiffness measurement (LSM) and area of the ROI for each slice were recorded. LSM for whole liver (average of all four slices) and the total volume of liver interrogated (sum of ROIs) was also recorded. The same MRE data sets were also processed using Automatic liver elasticity calculation (ALEC) software (3) for automated LSMs (fig.2). Data was expressed as mean and SD. Correlation between LSM by readers and ALEC was assessed with Pearson correlation analysis. Absolute intra-class correlation coefficient (ICC) analysis was performed for interobserver agreement.
Results
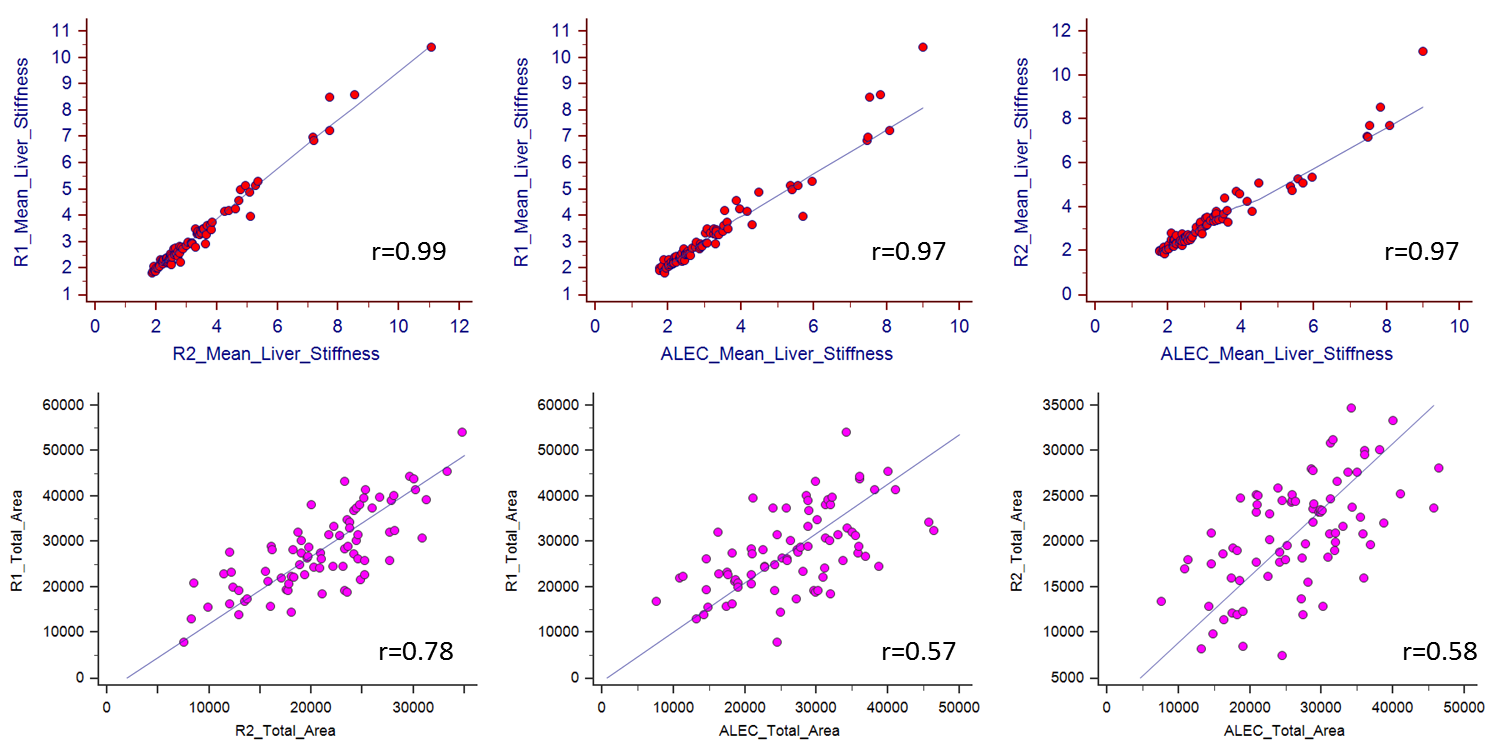
LSM data of 79 livers and 315 liver slices was available from both readers and ALEC. One slice was excluded due to obliquity of waves through the top section of the liver near the diaphragm. LSMs ranged from 1.8 to 11.1kPa. The total area of ROIs ranged from 75.2- 541cm2. Pearson correlation analysis showed excellent correlation between LSM between two readers and ALEC (0.97-0.99, p<0.0001). ICC analysis also showed excellent interobserver agreement between readers and readers and ALEC (0.97, 95% CI, and 0.966-0.985). For individual slices, correlation coefficient was excellent (0.96-0.98, p<0.0001) and ICC was 0.967 (95% CI, 0.96-0.974).
The total area of ROIs evaluated by readers and ALEC showed only moderate correlation (0.57-0.77, p<0.0001) and the ICC was also moderate0.49 (95% CI, 0.25-0.67). Similarly at the slices level the ROI area showed only moderate correlation (0.44-0.69, p<0.0001) and ICC was 0.42 (95% CI, 0.27-0.55).
Discussion
Excellent interobserver agreement was demonstrated between LSM using manual geographical ROIs by readers and automated method in PSC patients. The ICC was excellent even with modest correlation between areas of ROIs drawn by each reader and ALEC. The larger ROIs reduced sampling errors and therefore produced excellent correlation of LSM. The readers also included focal/segmental/lobar increased stiffness. Despite the differences in the volume interrogated by the readers, the correlation remained excellent confirming the robustness of LSM with MRE in PSC subjects.
As overall fibrosis burden correlates with progression of disease; assessment of larger volume of liver is needed for accurate fibrosis staging. Therefore drawing larger geographical ROIs on MRE stiffness maps that include both focal regions of increased stiffness and normal stiffness is recommended in patients with PSC.
Conclusions
LSM with MRE in PSC patients shows excellent interobserver agreement when large geographical ROIs are drawn that include focal regions of increased stiffness caused by the heterogeneous distribution of disease process in PSC.
Acknowledgements
Ms. Miranda Chamley for assistance in entering the data
References
1.Venkatesh SK, Yin M, Ehman RL. Magnetic resonance elastography of liver: technique, analysis, and clinical applications.JMRI 2013; 37(3):544-55.
2.Venkatesh SK, Yin M, Ehman RL.Magnetic resonance elastography of liver: clinical applications. J Comput Assist Tomogr. 2013 Nov-Dec;37(6):887-96.
3. Dzyubak B, Venkatesh SK, Manduca A, Glaser K, Ehman RL. Automated Liver Elasticity Calculation for MR Elastography. Magn Reson Imaging. 2016 May;43(5):1055-63.
Figures