2587
A study on the weighting factor investigating of liver parenchyma for 6-point interference Dixon fat percentage imaging accuracy in non-alcoholic fatty liver diseaseSeung-Man Yu1
1Gimcheon University, Seoul Korea, Republic of Korea
Synopsis
The aim of this study was to determine the most accurate weighting factor for precise quantification of fatty liver when the 6-point interference Dixon fat percentage imaging technique is used by analyzing changes in WFs of fatty acid metabolites in liver. The importance of accurate WFs in the calculation of 6-pt-DIXON-based FP was confirmed in the phantom experiment. This study proposes average WF values that can be effectively used to acquire accurate 6-pt-DIXON FP images for non-alcoholic fatty liver. In addition, if the WFs of liver parenchyma FMs are applied, the accuracy of 6-pt-DIXON FP imaging can further increase.
Introduction
The aim of this study was to determine the most accurate weighting factor (WF) for precise quantification of fatty liver when the 6-point interference Dixon fat percentage imaging technique (6-pt-DIXON) is used by analyzing changes in WFs of fatty acid metabolites(FM) in liver.Methods
Phantom experiment and MRI/1H-MRS acquisition A lipid phantom experiment comprised of four test tubes, which contained oleic, linoleic acid, and soybean oil was manufactured in preparation for the repeatability test, which was aimed at studying the repeatability of 6-pt-DIXON measurements of FP in response to WF changes (figure 1). We used a point-resolved spectroscopy (PRESS) sequence for localized 1H-MRS with TR = 1.5 s s, TE = 35 ms, and NEX = 64. A 10×10×10 mm3 voxel was placed within a homogeneous area to avoid air. WF calculation from phantom series MRS data The integrated areas under peaks were measured .We calculated the WF of each of the 7 peak FMs with the following equation: Individual FM weighting factor=(appropriate lipid proton concentration )/(7 peak lipid ptrons intergrated areas ) WFs for individual FMs were calculated for oleic acid (WF1), linoleic acid (WF2), soybean oil (WF3), and soybean oil2 (WF4) based on the concentration ratios of the 7 peak lipid protons using integrated areas. Also, the average WF (WFave3,4) of WF3 and WF4 was calculated for use in the FP experiments during the 6-pt-DIXON examination. Various WF applied 6-Echo Interference Dixon MR Imaging (6-pt-DIXON) Fat Percentage image acquisition and analysis The 3T MR was used to evaluate the differences in FP value of 6-pt-DIXON pulse sequences difference. The reference weighting factor (WFref) was calculated using the 7T MRS data of calf subcutaneous tissues in reference to the study by Ren et. al [1]. The values of WF1, WF2, and WFave3,4 obtained from the MRS phantom experiment were applied to the 6-pt-DIXON method to acquire FPs. High fat diet fatty liver rat model MRS experimental protocol and analysis Ten male 8-week-old Sprague­Dawley rats were fed a 60% high fat diet until the end of the experiment. The baseline MRS/I were acquired before rats were fed the HF diet, and MRS/I data was then acquired every 2 weeks for 8 weeks. We use a point-resolved spectroscopy sequence for localized 1H-MRS with TR = 1,500 msec, TE = 35 msec, NEX = 64 and Voxel = 8×8×8 mm3. The concentrations associated with fat deposition were calculated as the water-to-total 7 lipid peak integrated concentration ratios using water scaling and were grouped into 4 groups: 0-10%, 11-20%, 21-30%, and > 31%.Results and Discussion
The lipid proton profiles obtained from the test tube MRS data are different from each other, as shown in Fig. 2. Individual lipid proton weighting factors indicate the weighting factors of oleic acid (WF1), linoleic acid (WF2), soybean oil (WF3), and soybean oil2 (WF4), which were calculated based on the concentration ratios of the 7 peak lipid protons using integrated areas. The WF of the soybean oil (test tubes 3 and 4) was determined as the average of the values of the two test tubes, weighted with coefficients (WFave3,4). Fig. 3 shows the results of the statistical analysis comparing mean differences based on the 6-pt-DIXON images obtained 10 times each, after the 4 WFs were applied. When those WFs were applied, the mean FP was unchanged in test tube 1 (oleic acid) (p = 0.146), whereas the mean FPs of the remaining 3 test tubes were significantly changed. The liver fat percentage (%) in by MRS data was calculated using the equation: sum of 7 peak lipid proton concentrations/(water concentration + sum of 7 peak lipid proton concentrations). The WFs for FM in these four groups were not statistically significant. However, the p-values of WFs at 0.9 and 1.6 ppm were substantial, 0.078 and 0.045, respectively, albeit not statistically significant. By fat composition, methylene metabolite was the leading composition, accounting for 63-71% of the total FM concentration in high fat diet-induced fatty liver tissue, followed by methylene, methylene protons β to COO, and diallylic metabolite with similar concentration levels. The methane and diallylic metabolite made up about 4.5~4.8% of total FM concentration and allylic metabolite made up about 3.8%, representing the lowest concentration in hepatic lipid compositionConclusion
This study proposes average WF values that can be effectively used to acquire accurate 6-pt-DIXON FP images for non-alcoholic fatty liver. In addition, if the WFs of liver parenchyma FMs, which are specific to each liver disease, are applied, the accuracy of 6-pt-DIXON FP imaging can further increase.Acknowledgements
This research was supported by Basic Science Research Program through the National Research Foundation of Korea(NRF) funded by the Ministry of Science, ICT & Future Planning(2015R1C1A1A02036988).References
1. Ren J, Dimitrov I, Sherry AD, Malloy CR. Composition of adipose tissue and marrow fat in humans by 1H NMR at 7 Tesla. J Lipid Res. 2008:49(9):2055-2062.Figures
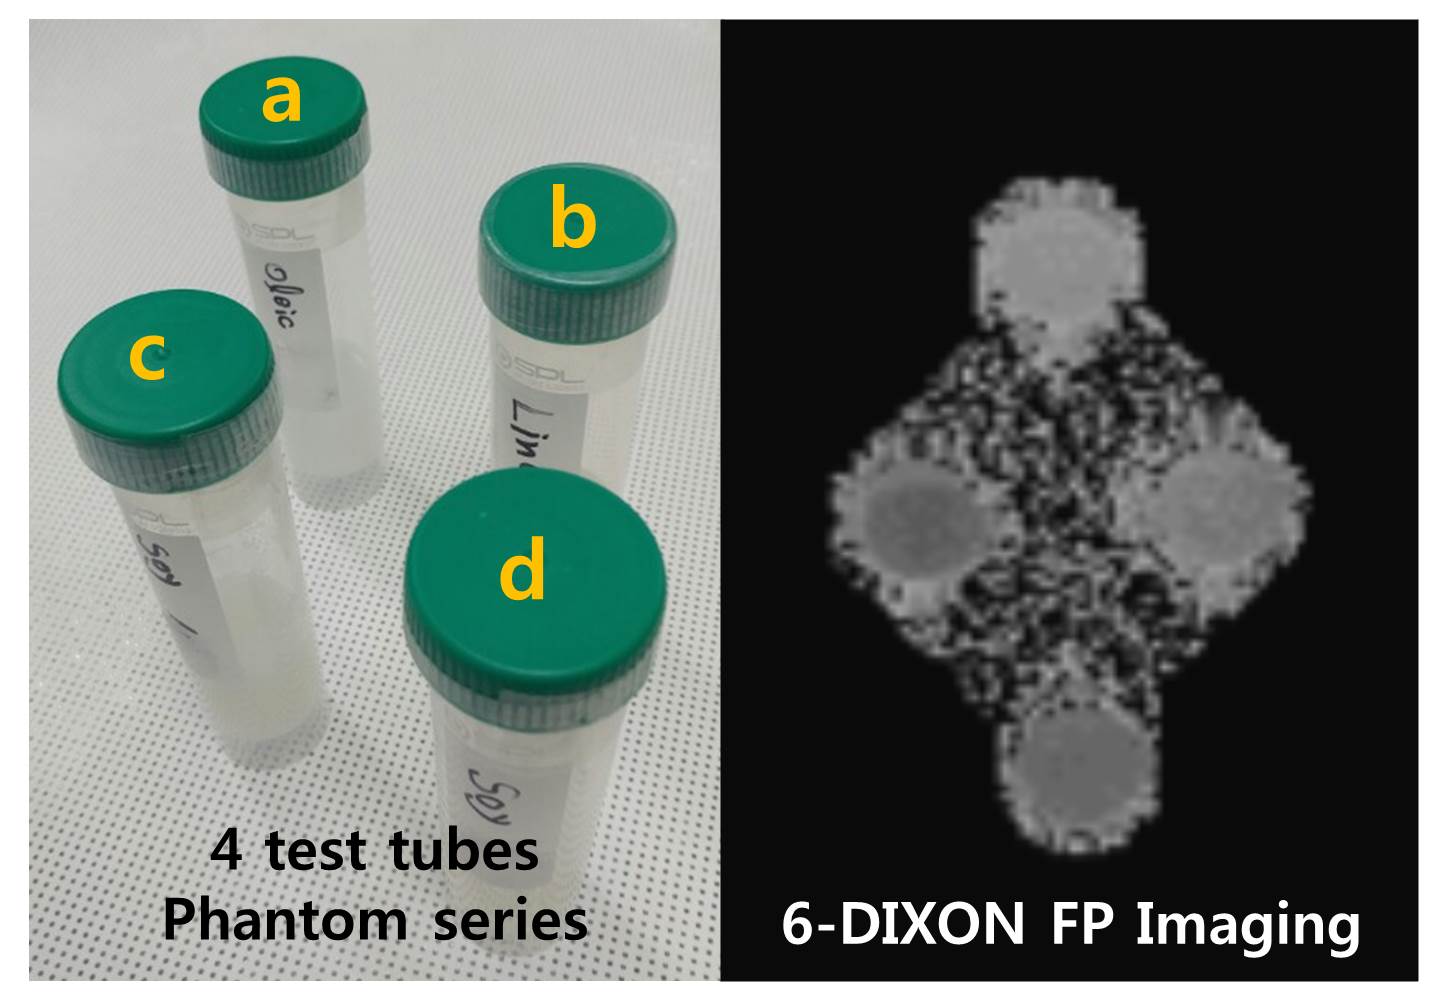
Figure 1. The
phantom series comprised of 4 test tubes.
(a)
Oleic acid, (b) linoleic acid, (c) soybean oil 1, and (d) soybean oil 2, which had
a different oil-to-water ratio than was in test tube (c).
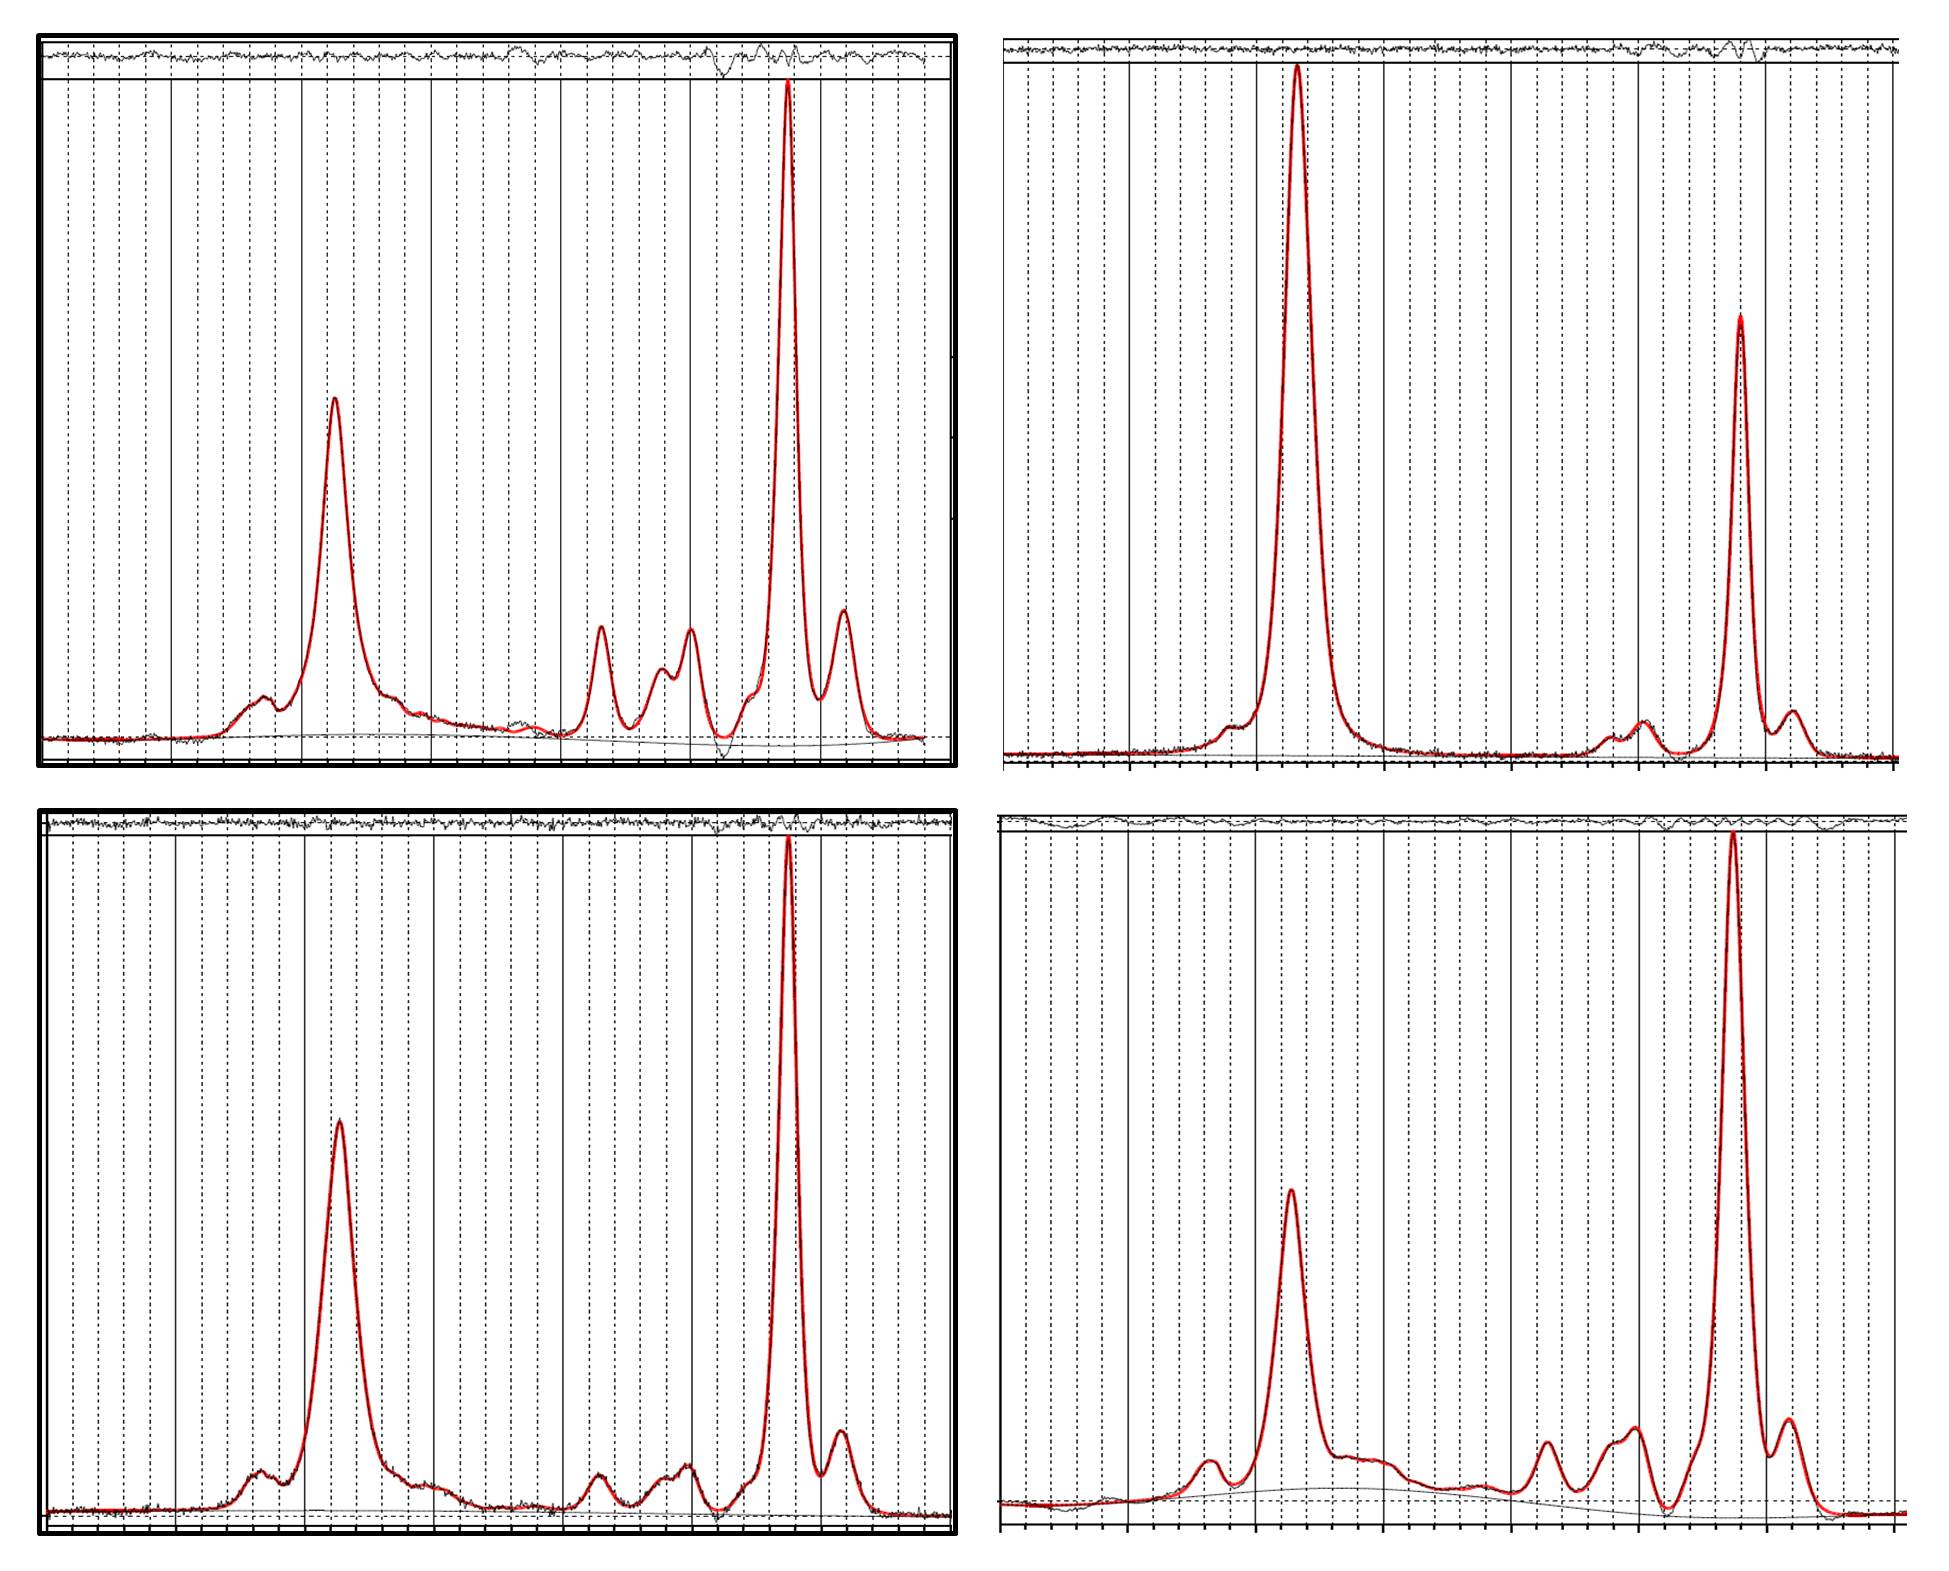
Figure 2. The
phantom series MRS data profile as obtained by LCModel analysis.
(a), (b), (c), and (d) are test tubes oleic, linoleic,
soybean oil 1, and soybean oil 2, respectively.
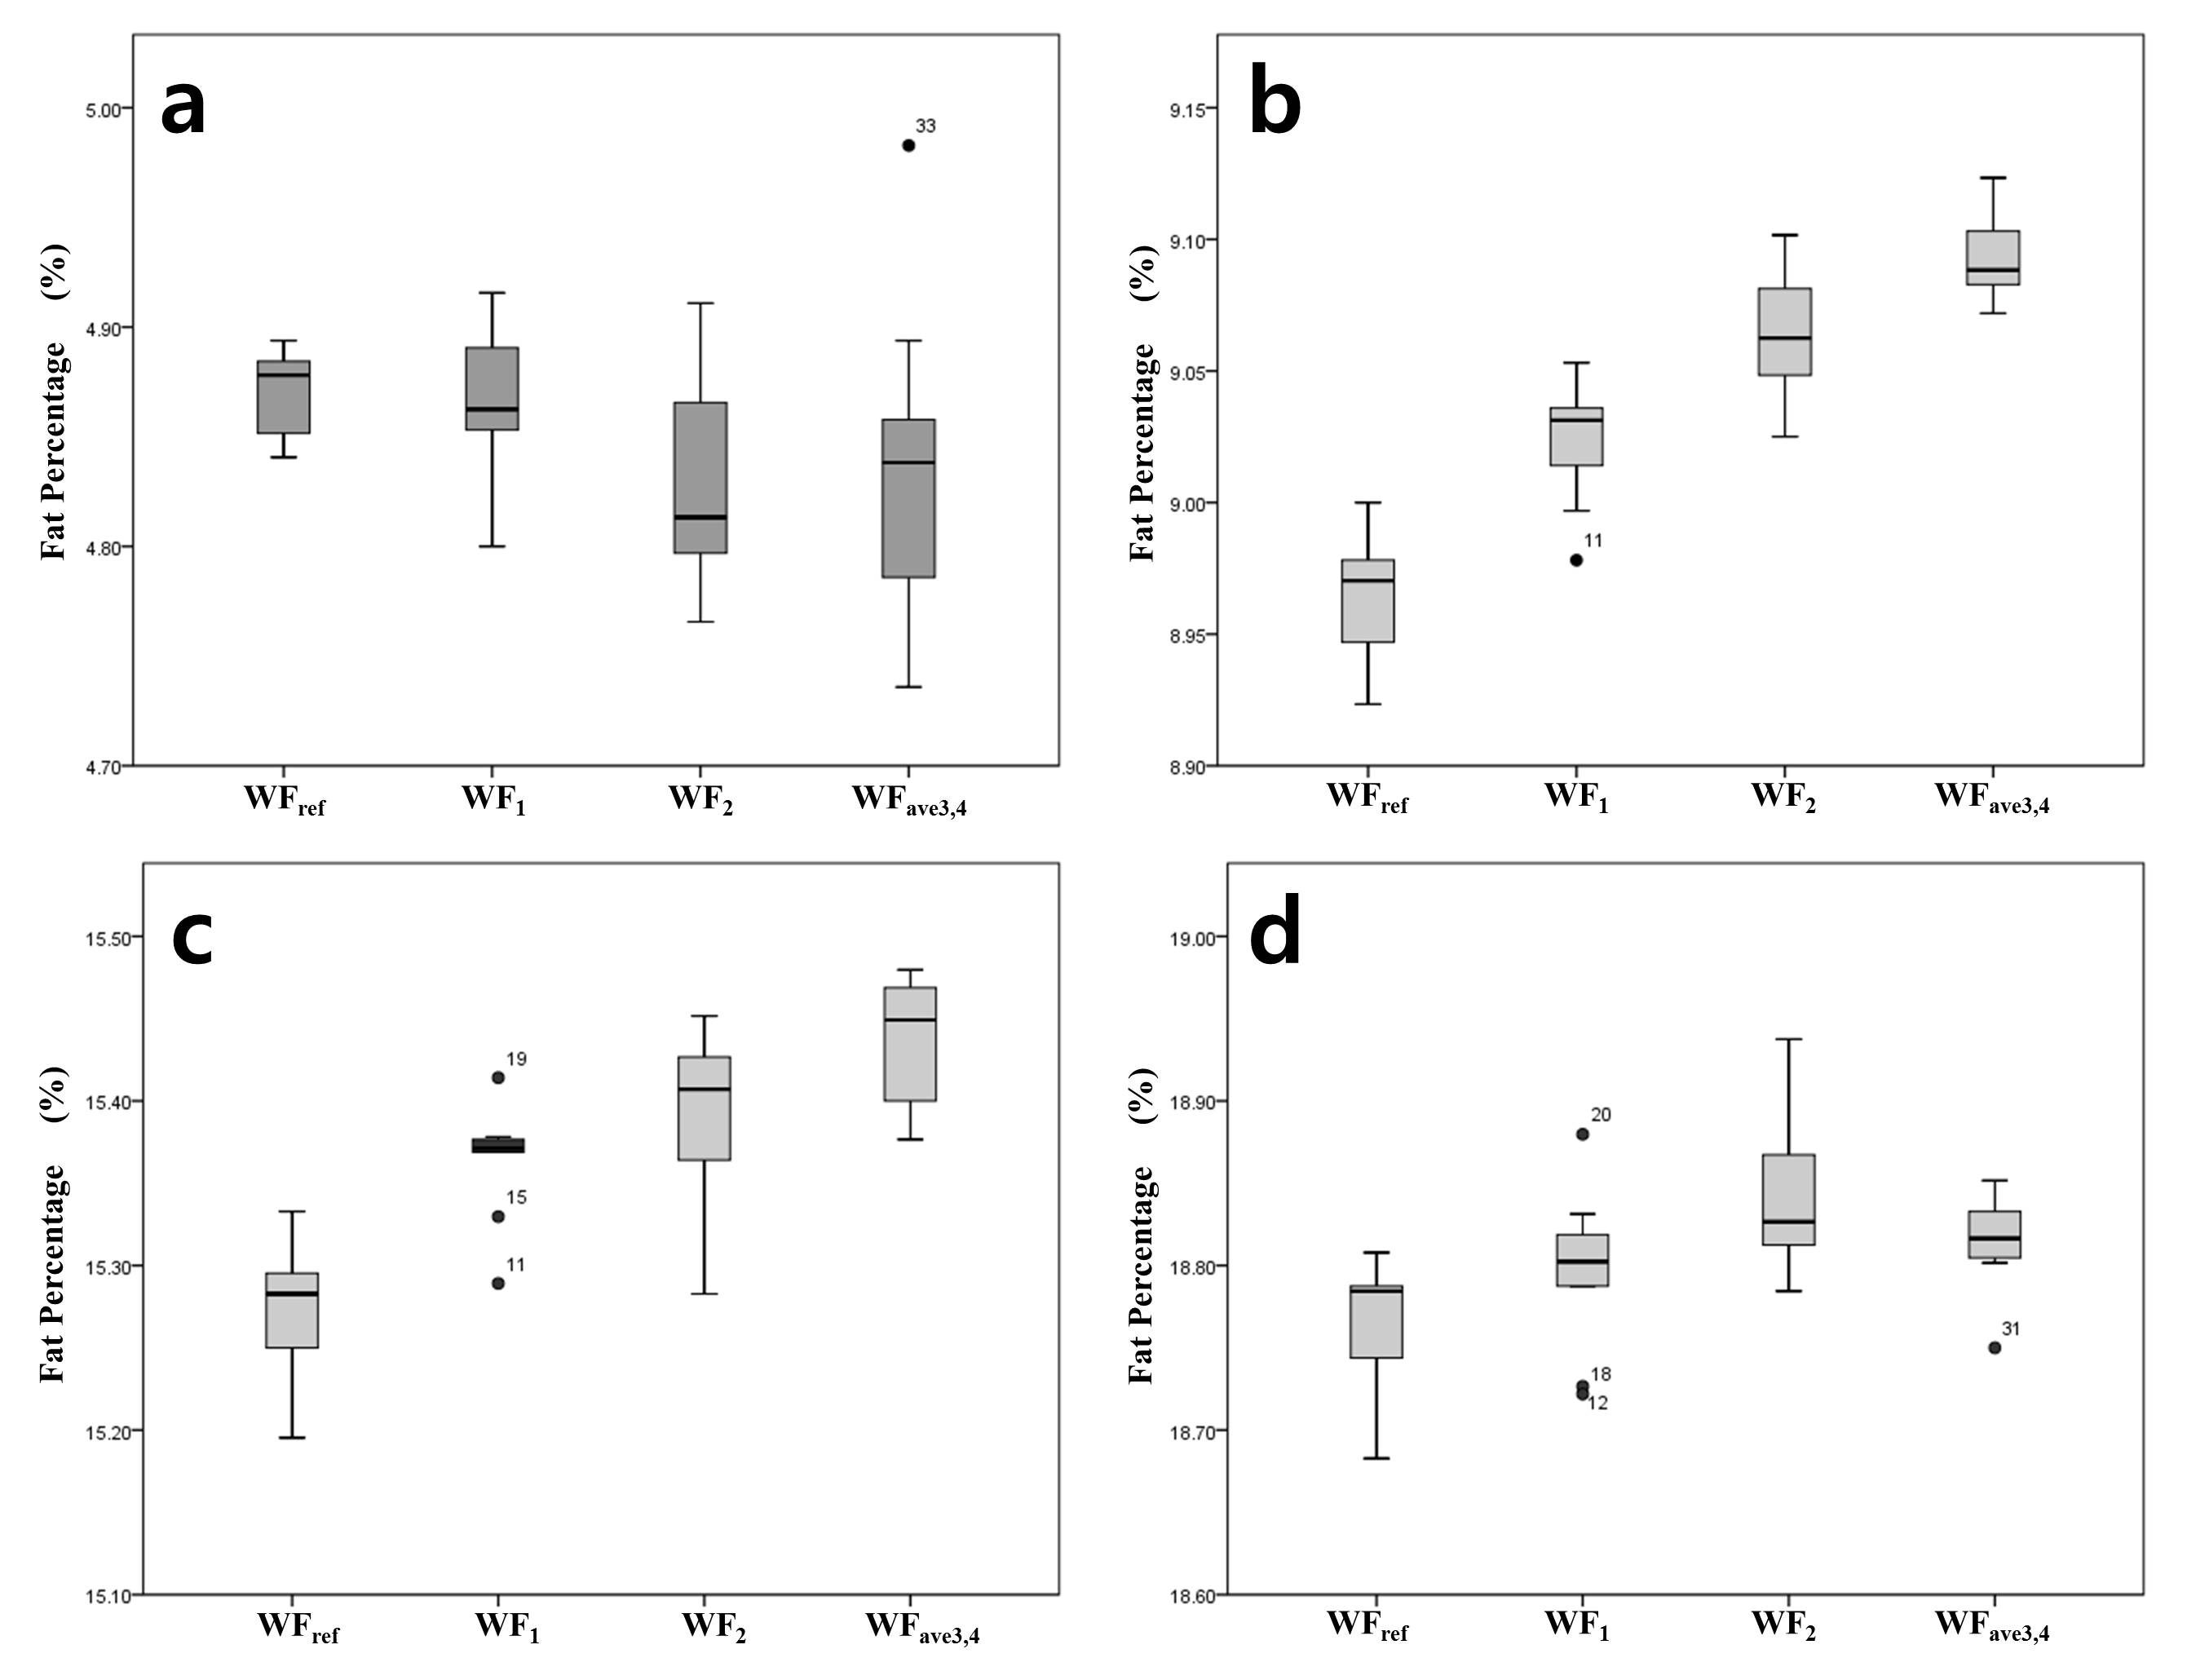
Figure 3. The
difference in mean FP value depending on the 4 different WFs.
(a), (b), (c), and (d) are the 6-pt-DIXON FP
data of test tubes 1, 2, 3, and 4, respectively.