2584
Effect of Signal to Noise Ratio and Estimator Type on Bias of Hepatic Proton Density Fat Fraction Measurement1Radiology, University of Wisconsin-Madison, Madison, WI, United States, 2Electrical & Computer Engineering, University of Wisconsin-Madison, Madison, WI, United States, 3Medical Physics, University of Wisconsin-Madison, Madison, WI, United States, 4Medicine, University of Wisconsin-Madison, Madison, WI, United States, 5Emergency Medicine, University of Wisconsin-Madison, Madison, WI, United States, 6Biomedical Engineering, University of Wisconsin-Madison, Madison, WI, United States
Synopsis
Proton-density fat-fraction (PDFF) is typically measured by calculating the mean PDFF value within a region of interest (ROI). However, the mean estimator has been shown to result in bias when signal-to-noise ratio (SNR) is low. This work characterizes the accuracy of median and maximum likelihood estimator (MLE) as alternative estimators for the measurement of liver PDFF. Our results demonstrate that at low-SNR, the mean estimator has a larger error than either the median or MLE values obtained from the same ROIs, when compared to the PDFF value obtained from spectroscopy, and had a bias of approximately -1%.
Introduction
Proton density fat fraction (PDFF) estimated using chemical shift-encoded MRI (CSE-MRI) is an emerging quantitative biomarker of tissue triglyceride content1-3. Importantly, there is recognition of the need for accurate and precise PDFF measurements at low PDFF values (0-10%)1-5.
Recent work has demonstrated that clinically accurate and precise PDFF measurements are confounded at low SNR values by noise-related bias6-8. In low SNR PDFF maps, the mean estimator of a region of interest (ROI) is biased regarding the true underlying PDFF of the tissue. This bias is a result of an asymmetric probability density function of the noise on PDFF estimates8.
To address this challenge, two alternative ROI-based estimators have been proposed: the median estimator and a maximum likelihood estimator (MLE)8. However, the performance of these alternative estimators for liver PDFF is unknown. Therefore, the purpose of this work is to determine the bias of the mean and the relative performance of the median and MLE estimators for in vivo liver PDFF measurements.
Methods
A prospective IRB-approved HIPAA compliant study was performed. Eligible subjects who were undergoing abdominal MRI were recruited for additional add-on research sequences and informed consent was obtained. Exclusion criteria included standard contraindications to MRI.
MRI Acquisition and Reconstruction:
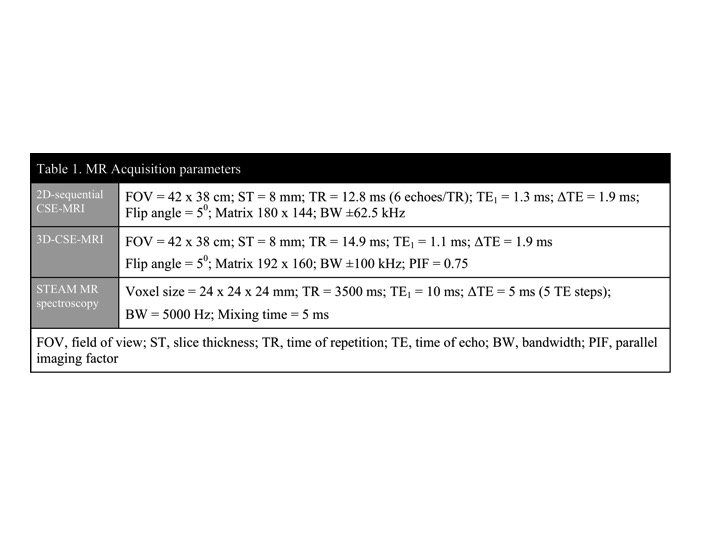
All imaging was performed on a 3.0T clinical MRI system (MR750, GE Healthcare) using a 32-channel phased array torso coil (Neocoil, Pewaukee, WI). First, a “low-SNR” 2D-sequential CSE-MRI was acquired9, 10. This sequential acquisition strategy acquires all phase encode lines for a particular slice before moving on to the next slice which results in improved motion robustness at the expense of SNR. For a “high-SNR” reference, conventional 3D-CSE-MRI was also acquired in each subject. Additionally, single vowel STEAM MR spectroscopy (MRS) was acquired in hepatic segment 6 or 7 using multiple echoes to enable T2-corrected PDFF estimation11. Both the image and MRS data12 were reconstructed offline and the PDFF maps were generated on a pixel-by-pixel basis with correction for known confounders using a mixed complex-magnitude reconstruction13. Acquisition parameters for 2D-CSE-MRI, 3D-CSE-MRI and MRS are shown in table 1.
PDFF Map Analysis:
Automatically co-localized ROIs were created on 3D-CSE-MRI PDFF maps to match the MRS voxel. ROIs were propagated to the 2D-CSE-MRI PDFF map, with minor repositioning based on local anatomical landmarks, to account for any intra-acquisition changes in position. PDFF measurements from these ROIs were obtained using mean, median, and MLE from each acquisition8.
Statistical Analysis:
The resulting PDFF measurements from both the low-SNR and high-SNR acquisitions were analysed for bias using Bland-Altman analysis14. PDFF estimates from ROIs in the high and low-SNR PDFF maps were compared to a reference standard generated from MR spectroscopy to assess accuracy.
Results
Twenty subjects were included (average age, 57 years; 12:8 males:females). The average MRS-PDFF value was 8.5% (range, 0.8-27.9%) and half of the subjects had a MRS-PDFF value from 2-10%.
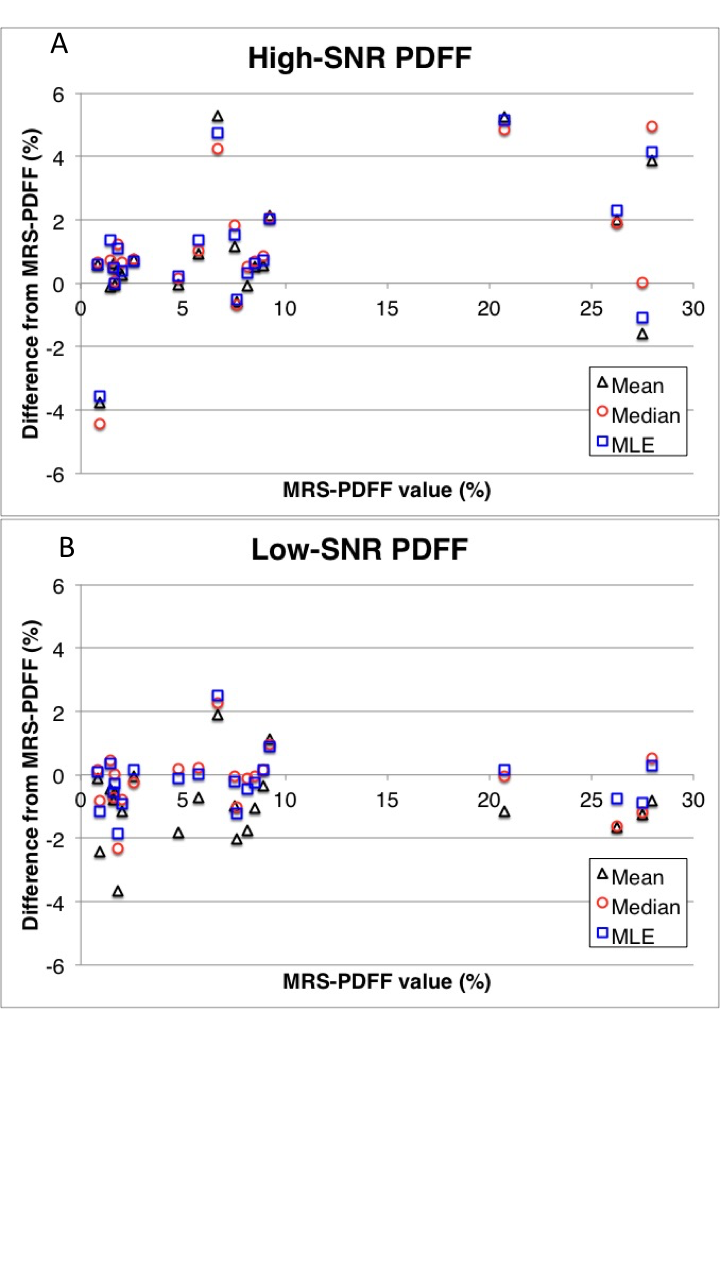
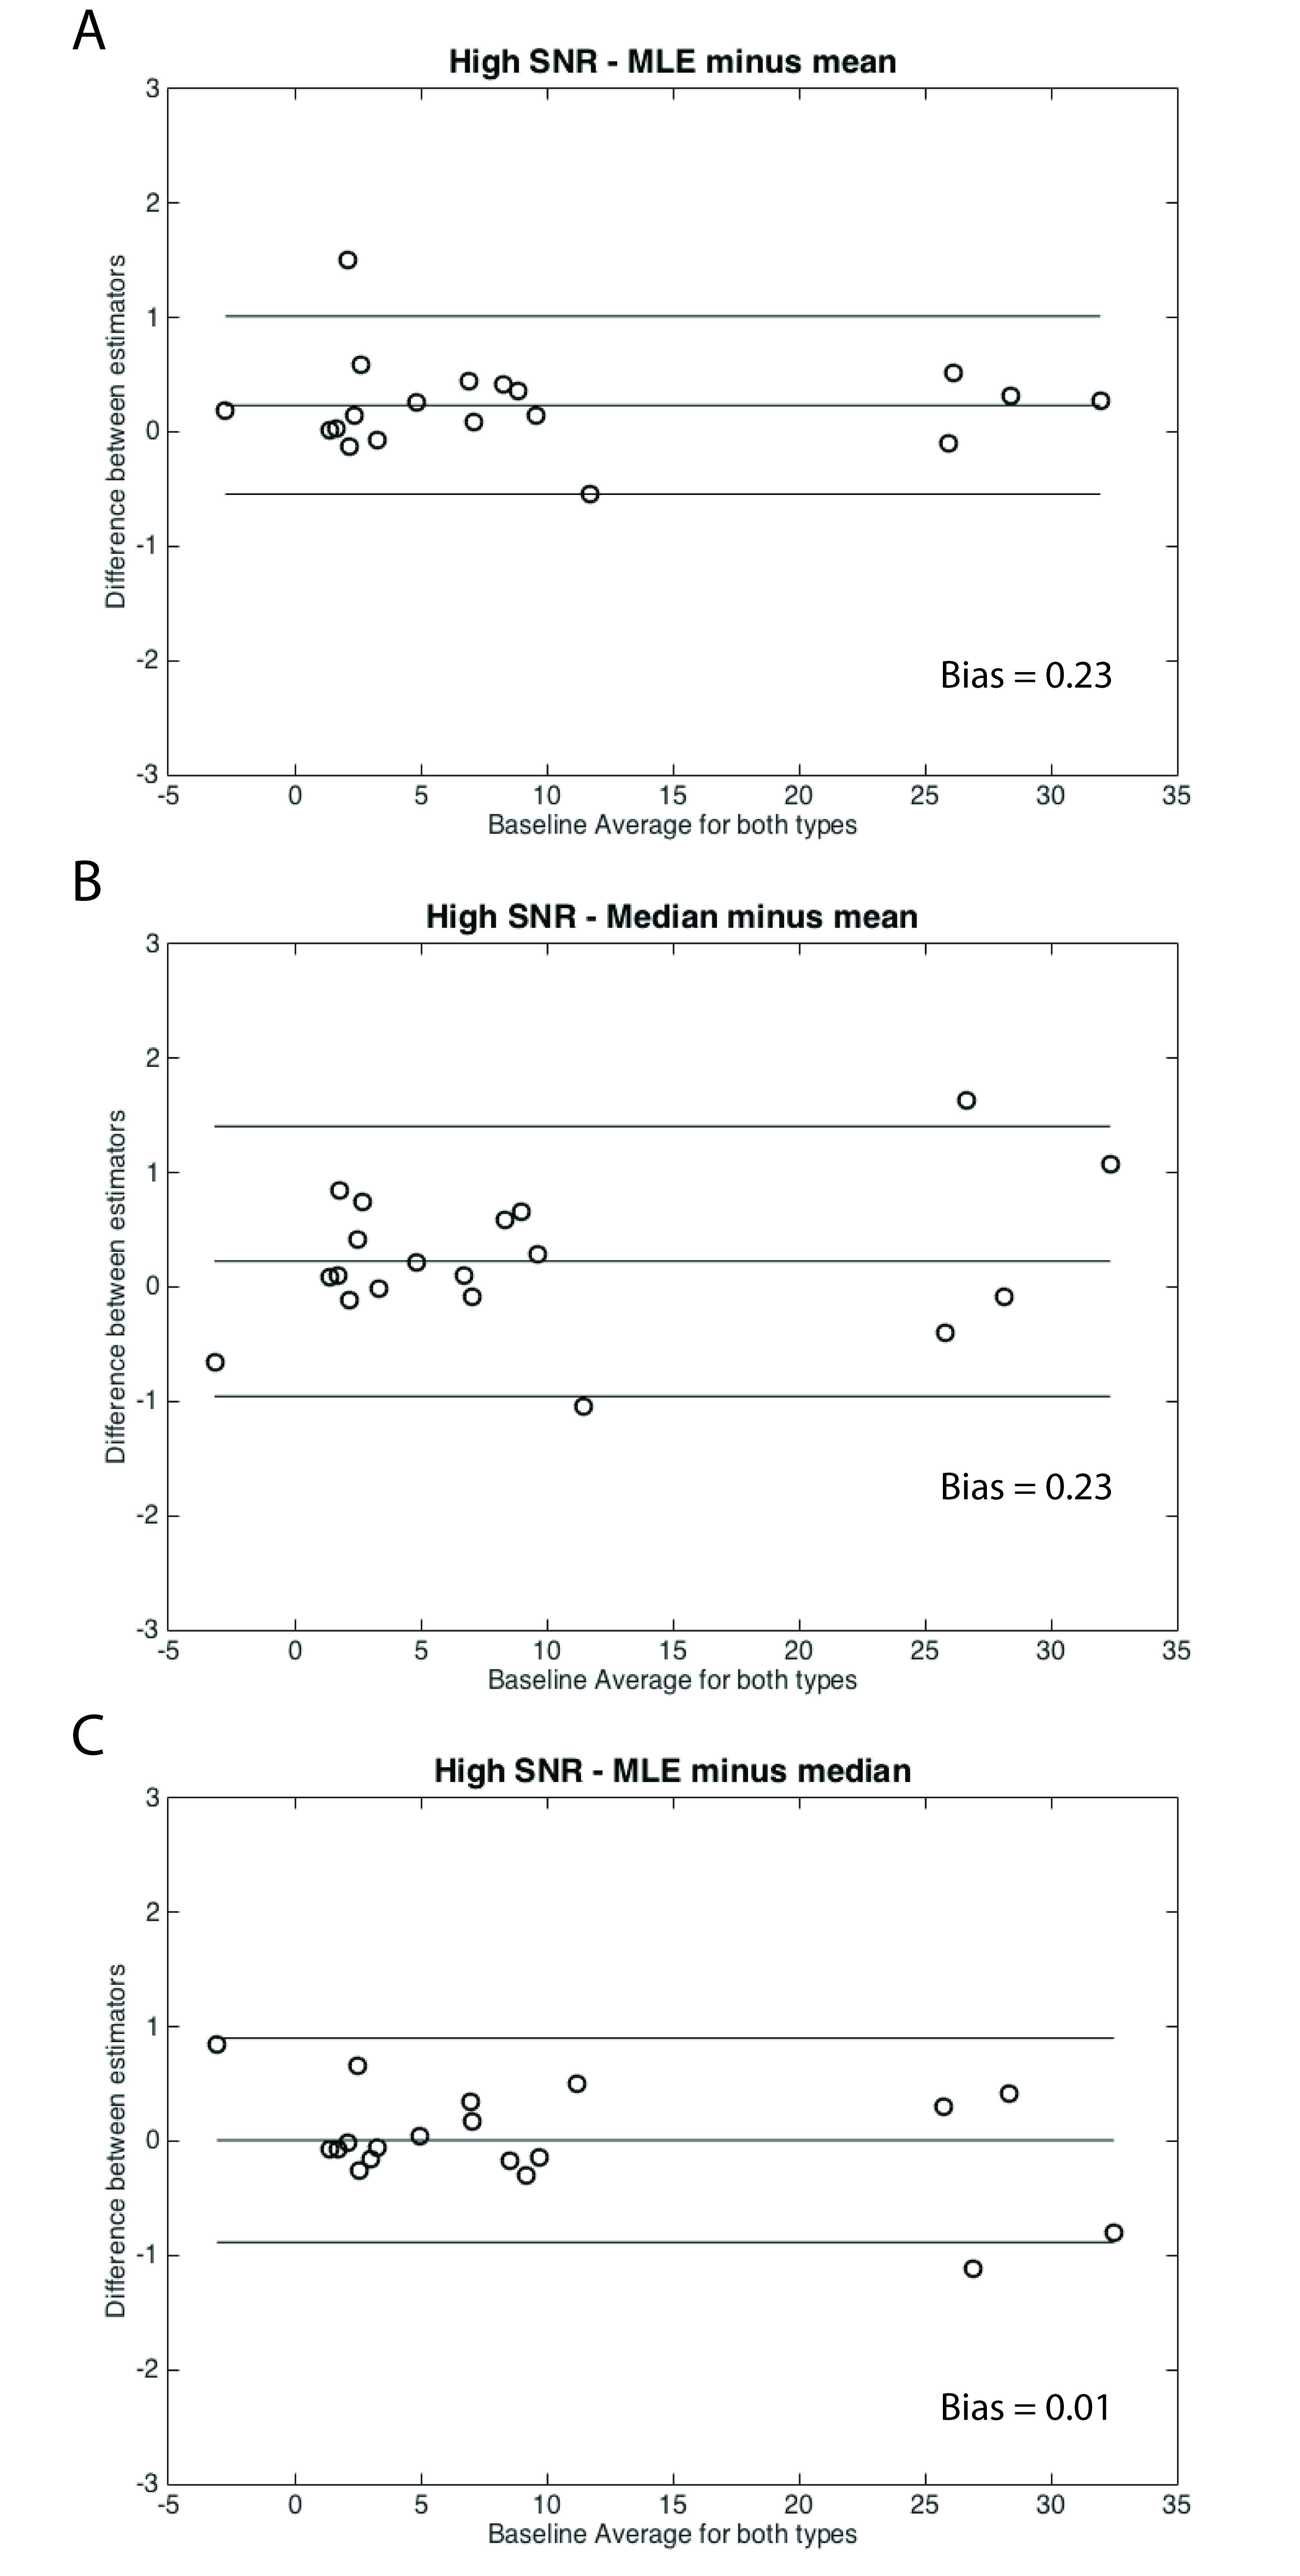
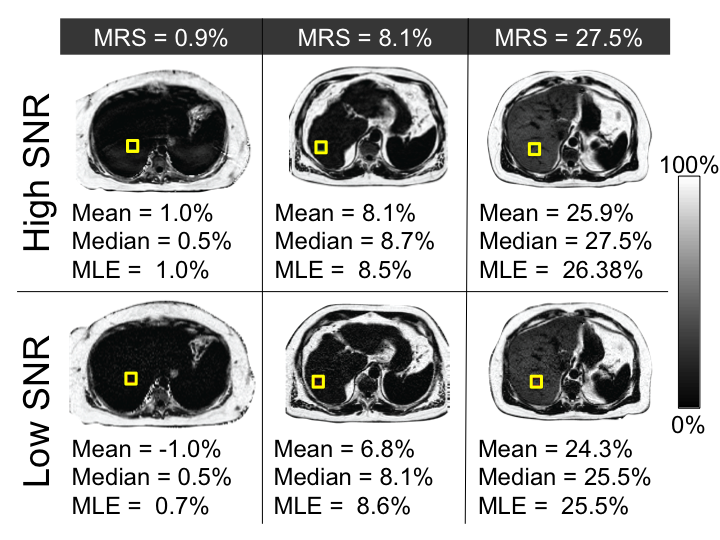
As shown in figure 1, for the high-SNR 3D-CSE-MRI acquisition the mean estimator performed similarly to median and MLE estimators to estimate the PDFF in comparison to MRS-PDFF. The median difference between the estimated PDFF and the MRS-PDFF value was 0.54 %, 0.69 %, and 0.64 % for mean, median, and MLE estimators respectively. Additionally, there was minimal bias between the different estimators at high-SNR (Figure 2).
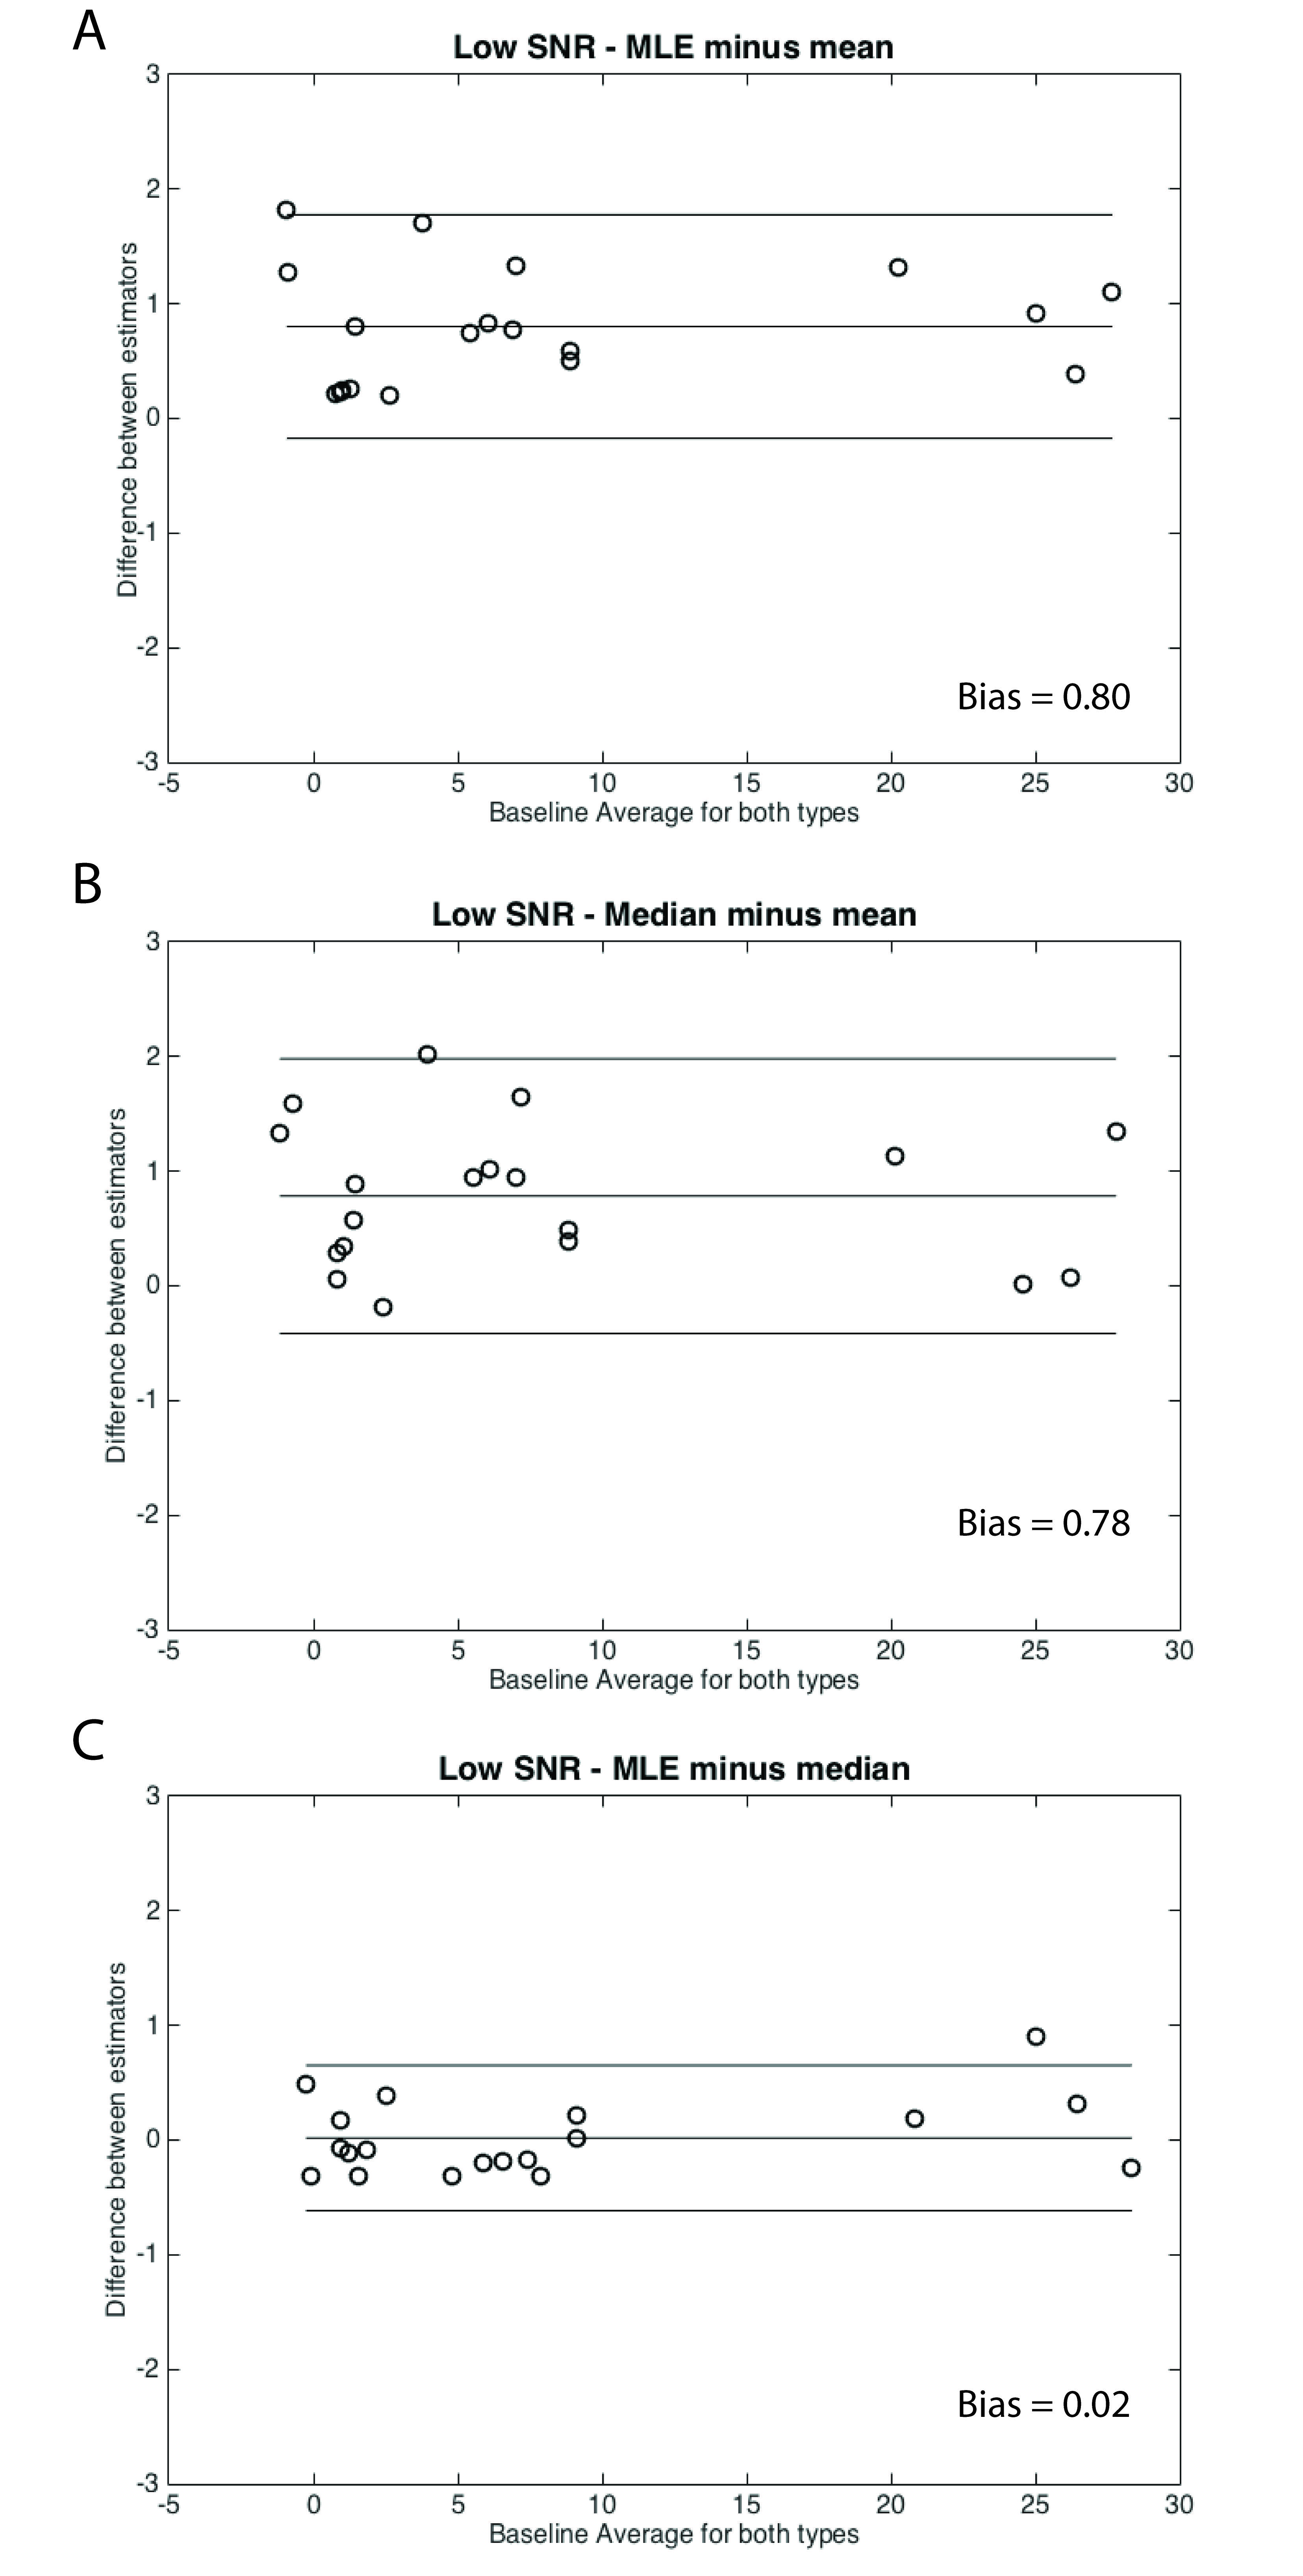
However, at low-SNR the median and MLE estimators provided more accurate estimates of PDFF than the mean estimator, using MRS-PDFF as the reference standard (Figure 1), with a median difference between MRS-PDFF value and MRI-PDFF of -0.03 % for median and -0.25 % for MLE compared to -1.06 % for the mean estimator. Furthermore, at low-SNR there was also a negative bias for the mean estimator compared to either the median or MLE estimators (Figure 3).
Discussion
In this work, we have demonstrated that the mean estimator for ROI analysis leads to an SNR-dependent bias for the measurement of liver PDFF. Further, we demonstrated that the use of either a median or MLE-based estimator provide more accurate estimates of PDFF, particularly at low SNR.
Current CSE-MRI methods used to estimate PDFF have inherently low SNR performance. Low SNR results from the use of low flip angles to avoid T1-bias6 the simultaneous estimation of PDFF, R2* and B0 field maps, and the use of parallel imaging for single breath-hold imaging. Emerging approaches such as motion-robust 2D sequential acquisitions further exacerbate this challenge15. While new approaches that improve SNR performance would be helpful, the use of alternative ROI analysis strategies such as median or MLE estimators may aid in mitigating SNR-related bias, at effectively no cost.
Acknowledgements
The authors wish to acknowledge support from the NIH (UL1TR00427, R01 DK083380, R01 DK088925, R01 DK100651, K24 DK102595), as well as GE Healthcare who provides research support to the University of Wisconsin.References
1. Kühn JP, Meffert P, Heske C, Kromrey ML, Schmidt CO, Mensel B, Völzke H, Lerch MM, Hernando D, Mayerle J, Reeder SB. Prevalence of Fatty Liver Disease and Hepatic Iron Overload in a Northeastern German Population by Using Quantitative MR Imaging. Radiology 2017;284(3):706-716.
2. Szczepaniak, LS, Nurenberg P, Leonard D, Browning JD, Reingold JS, Grundy S, Hobbs HH and Dobbins RL. Magnetic resonance spectroscopy to measure hepatic triglyceride content: prevalence of hepatic steatosis in the general population. Am J Physiol Endocrinol Metab 2005;288(2): E462-468.
3. Rehm JL, Wolfgram PM, Hernando D, Eickhoff JC, Allen DB, Reeder SB. Proton density fat-fraction is an accurate biomarker of hepatic steatosis in adolescent girls and young women. Eur Radiol 2015;25(10): 2921-2930.
4. Tang A, Tan J, Sun M, Hamilton G, Bydder M, Wolfson T, Gamst AC, Middleton M, Brunt EM, Loomba R, Lavine JE, Schwimmer JB, Sirlin CB. Nonalcoholic fatty liver disease: MR imaging of liver proton density fat fraction to assess hepatic steatosis. Radiology 2013;267(2):422-431.
5. Nasr P, Forsgren MF, Ignatova S, Dahlstrom N, Cedersund G, Leinhard OD, Noren B, Ekstedt M, Lundberg P, Kechagias S (2017). Using a 3% Proton Density Fat Fraction as a Cut-off Value Increases Sensitivity of Detection of Hepatic Steatosis, Based on Results from Histopathology Analysis. Gastroenterology. 2017 Jul;153(1):53-55.e7.
6. Liu CY, McKenzie CA, Yu H, Brittain JH, Reeder SB. Fat quantification with IDEAL gradient echo imaging: correction of bias from T(1) and noise. Magn Reson Med 2007;58(2):354-364.
7. Holmes JH, Hernando D, Wang K, Shimakawa A, Roberts N, Reeder SB. Analysis of Bias with SNR in Multi-echo Chemical Shift Encoded Fat Quantification. International Society for Magnetic Resonance in Medicine Annual Meeting. Singapore, Asia. May 7, 2016.
8. Roberts N, Hernando D, Holmes JH, Wiens C, Reeder SB. Noise Properties of Proton Density Fat Fraction Estimated Using Chemical Shift Encoded MRI. International Society for Magnetic Resonance in Medicine Annual Meeting 2017. Honolulu, HI, USA.
9. Luo H, Wiens C, Shimakawa A, Reeder SB, Johnson KM, Hernando D. A novel fat and iron quantification technique with non-rigid motion-corrected averaging based on non-local means. 25th Annual Meeting of the International Society for Magnetic Resonance in Medicine, 2017. Honolulu, HI, USA.
10. Ruby JA, Hernando D, Campo C, Shimakawa A, Vigen K, Holmes JH, Wang K, Reeder SB. Motion Insensitive Quantification of Liver Proton Density Fat-Fraction Using a Single-Shot Sequential 2D Technique. International Society for Magnetic Resonance in Medicine Annual Meeting 2016. Singapore, Asia.
11. Hamilton G, Middleton MS, Bydder M, Yokoo T, Schwimmer JB, Kono Y, Patton HM, Lavine JE, Sirlin CB. Effect of PRESS and STEAM sequences on magnetic resonance spectroscopic liver fat quantification. J Magn Reson Imaging 2009;30(1):145-152.
12. Hernando D, Artz N, Hamilton G, Roldan A, Reeder SB. Fully Automated Processing of Multi-Echo Spectroscopy Data for Liver Fat Quantification, In Proceedings of the 22nd Annual Meeting of the International Society of Magnetic Resonance in Medicine, Milan, Italy 2014.
13. Hernando D, Hines CD, Yu H, Reeder SB. Addressing phase errors in fat-water imaging using a mixed magnitude/complex fitting method. Magn Reson Med 2012;67(3): 638-644.
14. Bland JM, Altman DG. Statistical methods for assessing agreement between two methods of clinical measurement. Lancet. 1986;327(8476): 307–10.
15. Pooler BD, Ruby JA, Hernando D, Shimakawa, Reeder SB. MRI Quantification of Liver Proton Density Fat Fraction during Free Breathing using a Motion-Insensitive Single-Shot 2D Technique. E-Poster. 25th Annual Meeting of the International Society for Magnetic Resonance in Medicine. Honolulu, HI. April 26, 2017.
Figures