2583
Diurnal Variation of Liver Fat Concentration1Radiology, University of Wisconsin - Madison, Madison, WI, United States, 2Medical Physics, University of Wisconsin - Madison, Madison, WI, United States, 3Medicine, University of Wisconsin - Madison, Madison, WI, United States, 4Biomedical Engineering, University of Wisconsin - Madison, Madison, WI, United States, 5Emergency Medicine, University of Wisconsin - Madison, Madison, WI, United States
Synopsis
Abnormal accumulation of intracellular triglycerides (hepatic steatosis) is the earliest and hallmark feature of nonalcoholic fatty liver disease (NAFLD). Confounder-corrected quantitative chemical-shift encoded MRI (CSE-MRI) is an accurate, precise and reproducible biomarker of hepatic steatosis as quantified by the proton density fat fraction (PDFF). However, the effect of meals and diurnal variability has not been established. In this study, we examined the variability of PDFF measurements resulting from meals, diurnal variation and between visits on different days. This study demonstrates that CSE-MRI liver fat estimation is not significantly affected by diurnal changes.
Introduction
Nonalcoholic fatty liver disease (NAFLD) is the most common cause of chronic liver disease in the US1. Abnormal intracellular accumulation of triglycerides (hepatic steatosis) can progress to hepatocyte injury and fibrosis, i.e.: non-alcoholic steatohepatitis (NASH), and eventually to cirrhosis, and liver failure2,3. Consequently, early diagnosis, grading, and treatment planning is crucial for improving the outcome of patients with NAFLD.
Chemical shift encoded MRI (CSE-MRI) techniques have demonstrated to be an accurate4, precise5 and reproducible6 measurement of the proton density fat fraction (PDFF) as a biomarker of liver fat concentration. However, the effects of meals, hydration status, time of day and variation between days on liver fat concentration has not been examined. Understanding the impacts of these effects on PDFF quantification is very important for longitudinal monitoring of interventions aimed at reducing liver fat concentration. Therefore, the purpose of this work is to assess the diurnal variation of liver fat concentration in asymptomatic adult subjects using CSE-MRI.
Methods
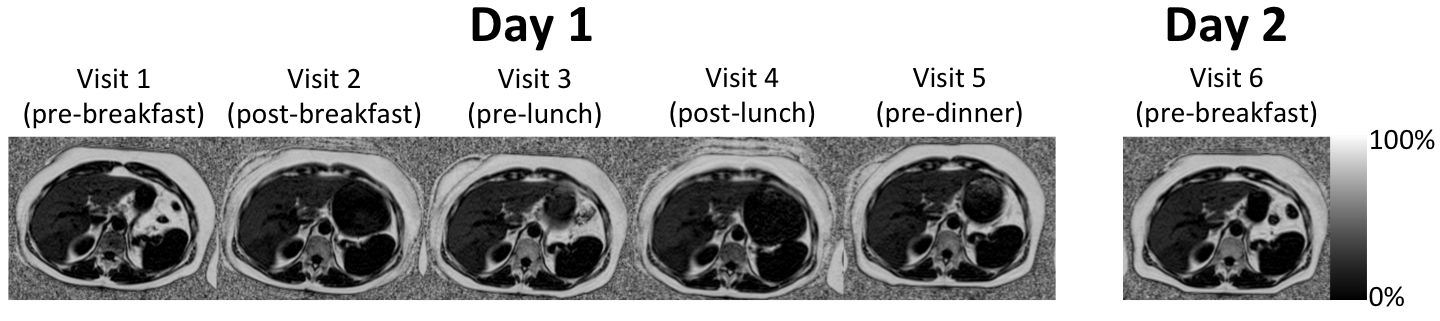
After receiving IRB approval and informed consent, 14 subjects were recruited for this prospective study. Each subject was recruited for 6 visits that took place over two days, as outlined in Figure 1. Subjects were asked to fast for at least 8 hours prior to visit 1, and were asked to avoid eating and drinking between meals. Subjects were also asked to complete a food diary of everything they ate over the course of the study.
On Day 1, each subject was scanned before breakfast. Then they were given a fixed breakfast (two granola bars, a 16 oz milk, and a 16 oz water) and scanned 15 minutes after finishing breakfast. Each subject was then scanned immediately before lunch and 30 minutes after finishing lunch. For lunch, subjects were given 16 oz of water and a food voucher. Subjects returned after lunch for scanning. To complete Day 1, the subject was scanned at approximately 4pm. Dinner was not controlled. Subjects then fasted for another 8 hours prior to the last visit, which took place in the morning of day 2 before they ate breakfast.
At each visit, the subjects were scanned using a commercial CSE-MRI method (IDEAL-IQ, GE Healthcare, Waukesha, WI) on a 1.5 T MRI scanner (HDxt, GE Healthcare, Waukesha, WI) using an 8-channel torso coil (USA Instruments, Cleveland OH). CSE-MRI was performed three separate times at each visit to assess repeatability of the measurement at each time point. The subject was removed from the bore of the scanner and asked to sit up and lay back down between repeated CSE-MRI acquisitions.
PDFF maps of the liver were automatically generated and analyzed as described by Campo et al7, where one reader drew circular regions of interest (ROI) in each of the nine Couinaud segments. The average PDFF from the 9 Couinaud segments was calculated.
The intra-exam variability and the variability across visits were assessed using a random effects model with the subject being a random effect and visits being a fixed effect.
Results
Representative fat fraction images for one subject across all six visits are shown in Figure 2. The stomach’s contraction/expansion can be seen depending on timing of the meals but only small variations are seen in the liver fat fraction.
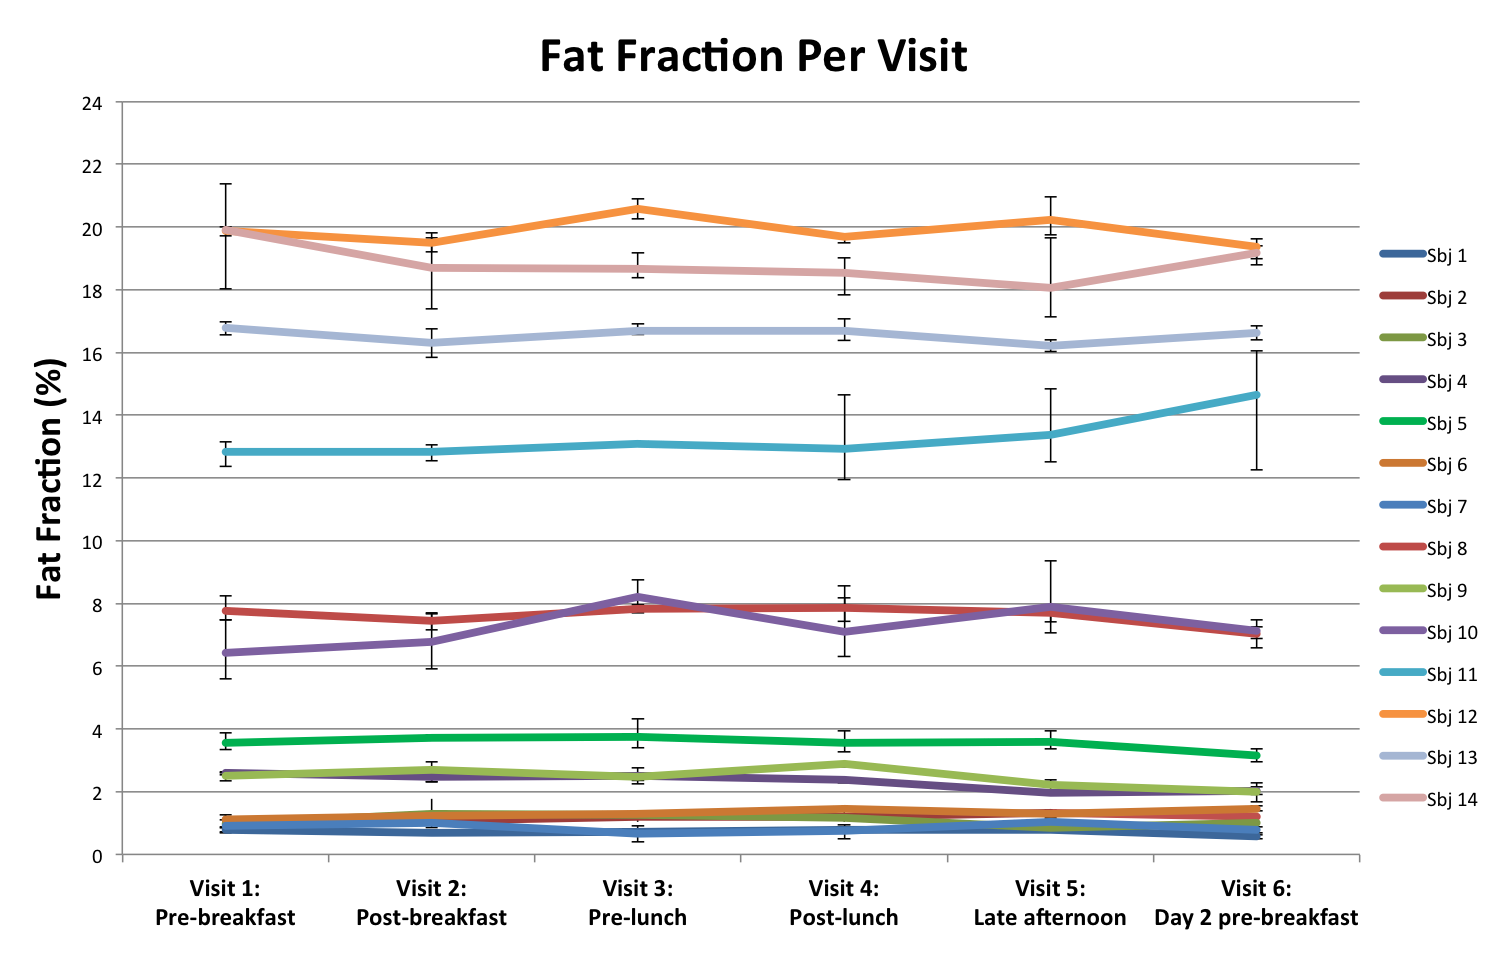
Figure 3 is the fat fraction of the liver, averaged over all Couinaud segments and all repeated scans, at each of the six visits. The range (minimum to maximum) of measured fat fraction over the three repeated measurements are shown as error bars for each visit. The variance between the repeated exams (intra-exam repeatability) was 0.3% fat fraction and the variance between visits was 0.4% fat fraction (diurnal variance). Testing for equality of the variances resulted in failing to reject the null hypothesis (p=0.54), i.e. our data suggested that the two variances were statistically the same.
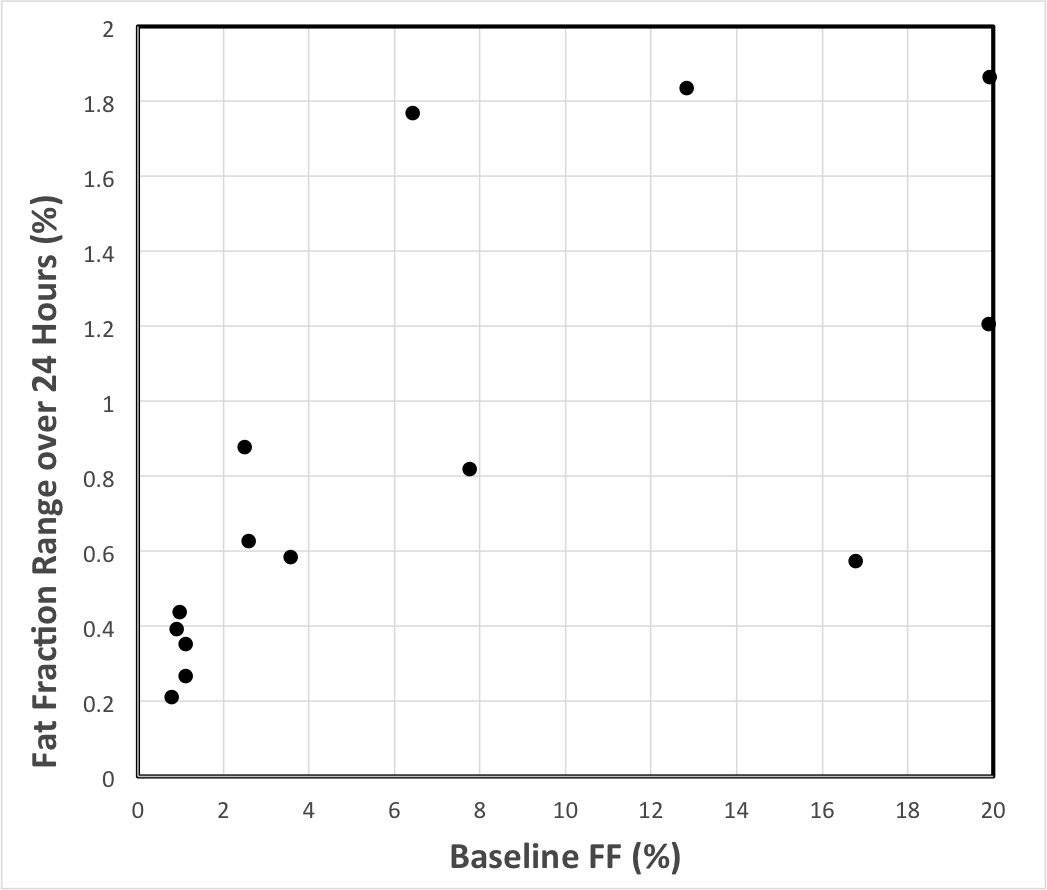
The range of fat fraction values over the six visits is shown in Figure 4 as a function of baseline fat fraction.
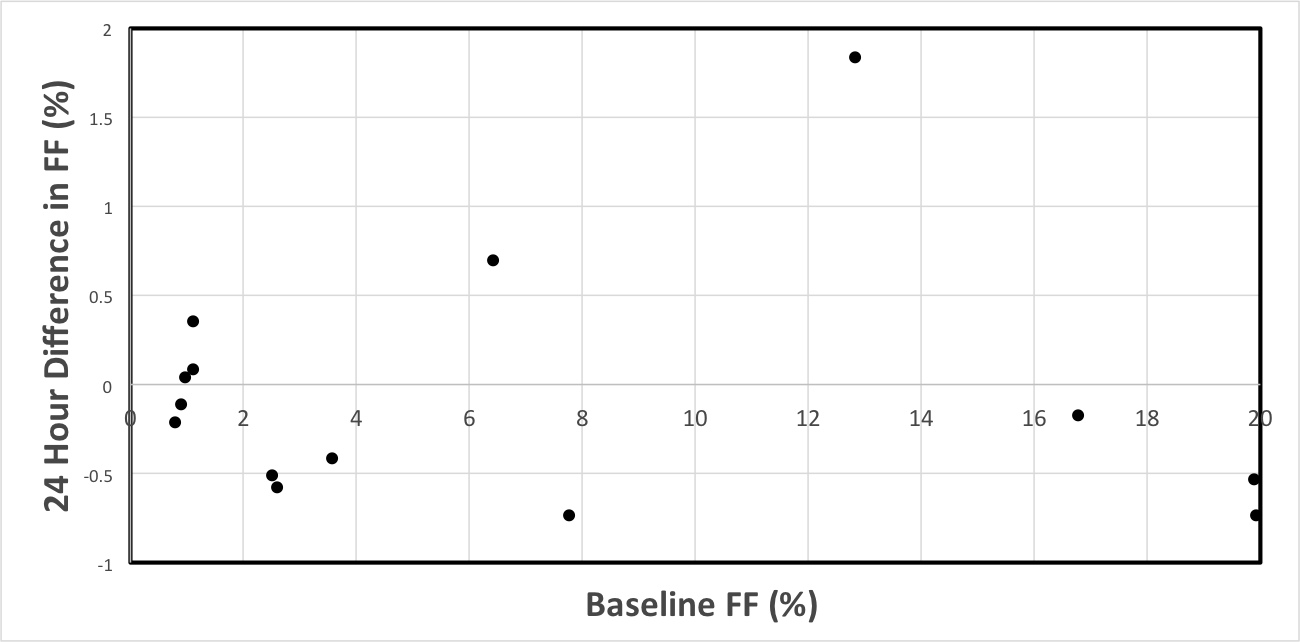
The difference in liver fat fraction measured before breakfast between Day 1 and 2 is shown in Figure 5.
Discussion & Conclusions
In this study we assessed the diurnal variation of liver fat concentration in asymptomatic adult subjects using CSE-MRI. Variability of intra-exam CSE-MRI fat fraction measurements was small (0.3%) and so were the variations of liver fat throughout the day in all subjects (0.4%), with no significant statistical difference between them. These results demonstrate that the repeatability of liver PDFF estimation using CSE-MRI is not significantly affected by normal diurnal changes due to meals or changes in hydration status.Acknowledgements
The Departments of Radiology and Medical Physics at the University of Wisconsin supported this project. The authors also wish to acknowledge support from the NIH (R01 DK100651, K24 DK102595, R01 DK083380, R01 DK083380), GE Healthcare, and the National Cancer Institute of the National Institutes of Health under Award Number T32CA009206. Samir Sharma contributed to this work while employed by UW-Madison but is now an employee of Toshiba Medical Research Institute, USA.
This project was supported by the Clinical and Translational Science Award (CTSA) program, through the NIH National Center for Advancing Translational Sciences (NCATS), grant UL1TR000427. The content is solely the responsibility of the authors and does not necessarily represent the official views of the NIH.
References
1. Byrne CD. Dorothy Hodgkin Lecture 2012* Non‐alcoholic fatty liver disease, insulin resistance and ectopic fat: a new problem in diabetes management. Diabetic Medicine. 2012;29(9):1098-1107.
2. Matteoni CA, Younossi ZM, Gramlich T, Boparai N, Liu YC, McCullough AJ. Nonalcoholic fatty liver disease: a spectrum of clinical and pathological severity. Gastroenterology. 1999;116(6):1413-1419.
3. Gramlich T, Kleiner DE, McCullough AJ, Matteoni CA, Boparai N, Younossi ZM. Pathologic features associated with fibrosis in nonalcoholic fatty liver disease. Human pathology. 2004;35(2):196-199.
4. Tang A, Desai A, Hamilton G, Wolfson T, Gamst A, Lam J, Clark L, Hooker J, Chavez T, Ang BD, Middleton MS, Peterson M, Loomba R, Sirlin CB. Accuracy of MR imaging-estimated proton density fat fraction for classification of dichotomized histologic steatosis grades in nonalcoholic fatty liver disease. Radiology 2015;274:416-25.
5. Di Martino M, Pacifico L, Bezzi M, Di Miscio R, Sacconi B, Chiesa C, Catalano C. Comparison of magnetic resonance spectroscopy, proton density fat fraction and histological analysis in the quantification of liver steatosis in children and adolescents. World J Gastroenterol 2016;22:8812-8819.
6. Mashhood A, Railkar R, Yokoo T, Levin Y, Clark L, Fox-Bosetti S, Middleton MS, Riek J, Kauh E, Dardzinski BJ, Williams D, Sirlin C, Shire NJ. Reproducibility of hepatic fat fraction measurement by magnetic resonance imaging. JMRI 2013;37:1359-70.
7. Campo CA, Hernando D, Schubert T, Bookwalter CA, Van Pay AJ, Reeder SB. Standardized Approach for ROI-Based Measurements of Proton Density Fat Fraction and R2* in the Liver. Am J Roentgenol 2017;209:592-603.
Figures