2582
Relationship between Proton Density Fat Fraction and Liver Triglyceride Composition estimated by 1H MR SpectroscopyGavin Hamilton1, Alexandra N Schlein1, Adrija Mamidipalli1, Yesenia Covarrubias1, Jonathan C Hooker1, Walter C Henderson1, Ethan Z Sy 1, Jennifer Y Cui1, Rohit Loomba2, and Claude B Sirlin1
1Liver Imaging Group, Department of Radiology, University of California, San Diego, La Jolla, CA, United States, 2NAFLD Research Center, Division of Gastroenterology, Department of Medicine, University of California, San Diego, La Jolla, CA, United States
Synopsis
Liver triglyceride composition was estimated using 1H MRS and compared to MRS estimated Proton Density Fat fraction (PDFF) to see if liver fat composition changes with PDFF. STEAM liver spectra were acquired in 263 adult subjects at 3 Tesla using breath-held, long-TR, multi-TE MRS to estimate PDFF and respiratory gated water-sated single TE MRS to estimate triglyceride composition. There is a significant change in the triglyceride composition of liver with changing PDFF, with the liver fat becoming more saturated as PDFF increases.
Introduction
In vivo liver 1H MR spectroscopy can characterize the triglyceride composition (TC) by accurately estimating the area of the 4 fat peaks in 0-3 ppm range1 with TC given by the number of −CH=CH− double bonds per molecule (ndb) and number of double bonds separated by a single CH2 (nmidb - number of methylene-interrupted double bonds). A study examining bias in liver proton density fat fraction (PDFF) estimated by confounder-corrected chemical-shift-encoded MRI hypothesized that ndb decreased as PDFF increased2. In this study, we compare estimates of liver TC with MRS estimated PDFF to see if liver fat changes with PDFF.Methods
The study was IRB approved and HIPAA compliant, with subjects giving written informed consent. STEAM spectra were acquired on 263 adult subjects with known or suspected NAFLD (mean age 40 yrs, range 21-75 yrs, 118 male, 145 female) at 3 Tesla (GE Signa EXCITE HD, GE Healthcare, Waukesha, WI) using an 8-channel torso array coil. Two different STEAM acquisitions were acquired in a 20x20x20 mm voxel within the liver selected to avoid liver edges as well as large biliary or vascular structures. Breath-held, long-TR, multi-TE spectroscopy (TR 3500 ms; TE 10, 15, 20, 25 and 30 ms) was used to determine PDFF1. To estimate liver TC, respiratory gated water-sated spectra (TE 10 ms) were acquired with 16 signal averages. No spatial sat bands were applied. Signals from different array elements were combined using an SVD technique3 and a single experienced observer analyzed the spectra using the AMARES algorithm4 included in the MRUI software package5. PDFF was estimated as the ratio of T2-corrected fat signal to the sum of T2-corrected water and fat signals, adjusted for fat included in the 'water' peak from a previously established standard liver spectrum1. For TC, after the fat peak areas were corrected with previously estimated T2s, the relative areas of measurable fat peaks (peaks 3-6) were used in a theoretical model (Table 1) to generate ndb, and nmidb values, assuming a fixed chain length CL of 17.56. Subjects were excluded from the analysis if the individual fat spectral peaks could not be differentiated from each other in TC MRS. Triglyceride type was modeled as a constant plus linear term in PDFF: ndb = ndb0 + ndb1·PDFF and nmidb = nmidb0 + nmidb1·PDFF.Results
TC could be estimated in 157 subjects. The ability to estimate TC was dependent on PDFF. None of the 51 subjects with PDFF < 4% could have TC estimated, and TC was estimated in only 7 of 31 subjects with PDFF between 4% and 7%. For PDFF between 7% and 10%, 27 of 43 subjects had TC estimated, while for PDFF > 10% 123 of 139 subjects had TC estimated. The relationship between TC and PDFF is shown in Figure 1. There was a significant decrease in ndb as PDFF increased (ndb = 2.78 - 0.0144.PDFF, R = -0.386, p < 0.0001), while nmidb also decreased, but with weaker correlation (nmidb = 0.65 - 0.0048.PDFF, R = -0.195, p = 0.015).Conclusion
There is a significant change in the triglyceride composition of liver with changing PDFF, with the liver fat becoming more saturated as PDFF increases. This result matches the behavior observed in Bydder et al2 with their ndb0 = 2.74 closely matching the ndb0 = 2.78 found here, and although that study was not able to exactly estimate the magnitude of change in ndb with PDFF, the value found here (ndb1 = -0.0144) is of similar magnitude to that hypothesized in that study (ndb1 = -0.01).Acknowledgements
No acknowledgement found.References
- Hamilton G, Yokoo T, Bydder M, et al. In vivo characterization of the liver fat 1H MR spectrum. NMR Biomed 2011;24:784-790
- Bydder M, Hamilton G, de Rochefort L, et al. Sources of systematic error in proton density fat fraction (PDFF) quantification in the liver evaluated from magnitude images with different numbers of echoes. NMR Biomed. 2017;e3843 (https://doi.org/10.1002/nbm.3843)
- Bydder M, Hamilton G, Yokoo T, Sirlin CB. Optimal phased-array combination for spectroscopy. Magn Reson Imaging 2008;26:847-850
- Vanhamme L, van den Boogaart A, Van Huffel S. Improved method for accurate and efficient quantification of MRS data with use of prior knowledge. Journal of magnetic resonance 1997;129:35-43
- Naressi A, Couturier C, Devos J, et al. Java-based graphical user interface for the MRUI quantitation package. Magnetic Resonance Materials in Physics, Biology and Medicine 2001;12:141-152
- Hamilton G, Schlein AN, Middleton MS, et al. In vivo triglyceride composition of abdominal adipose tissue measured by 1H MRS at 3T. J Magn Reson Imaging 2017;45:1455-1463
Figures
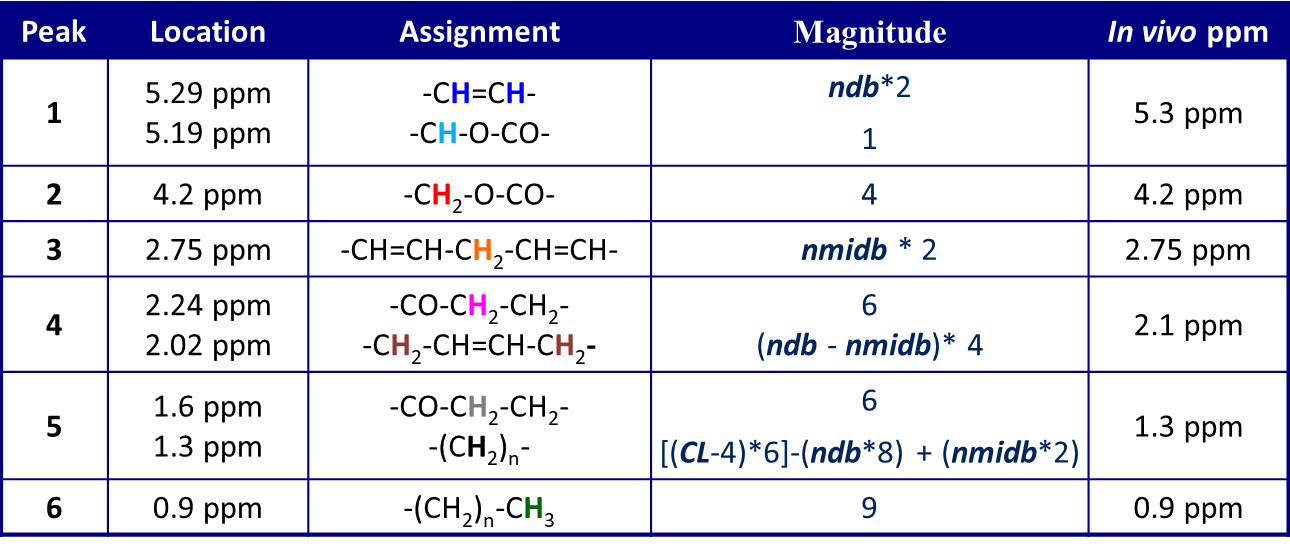
Table 1 Peak assignments of triglyceride MR resonances
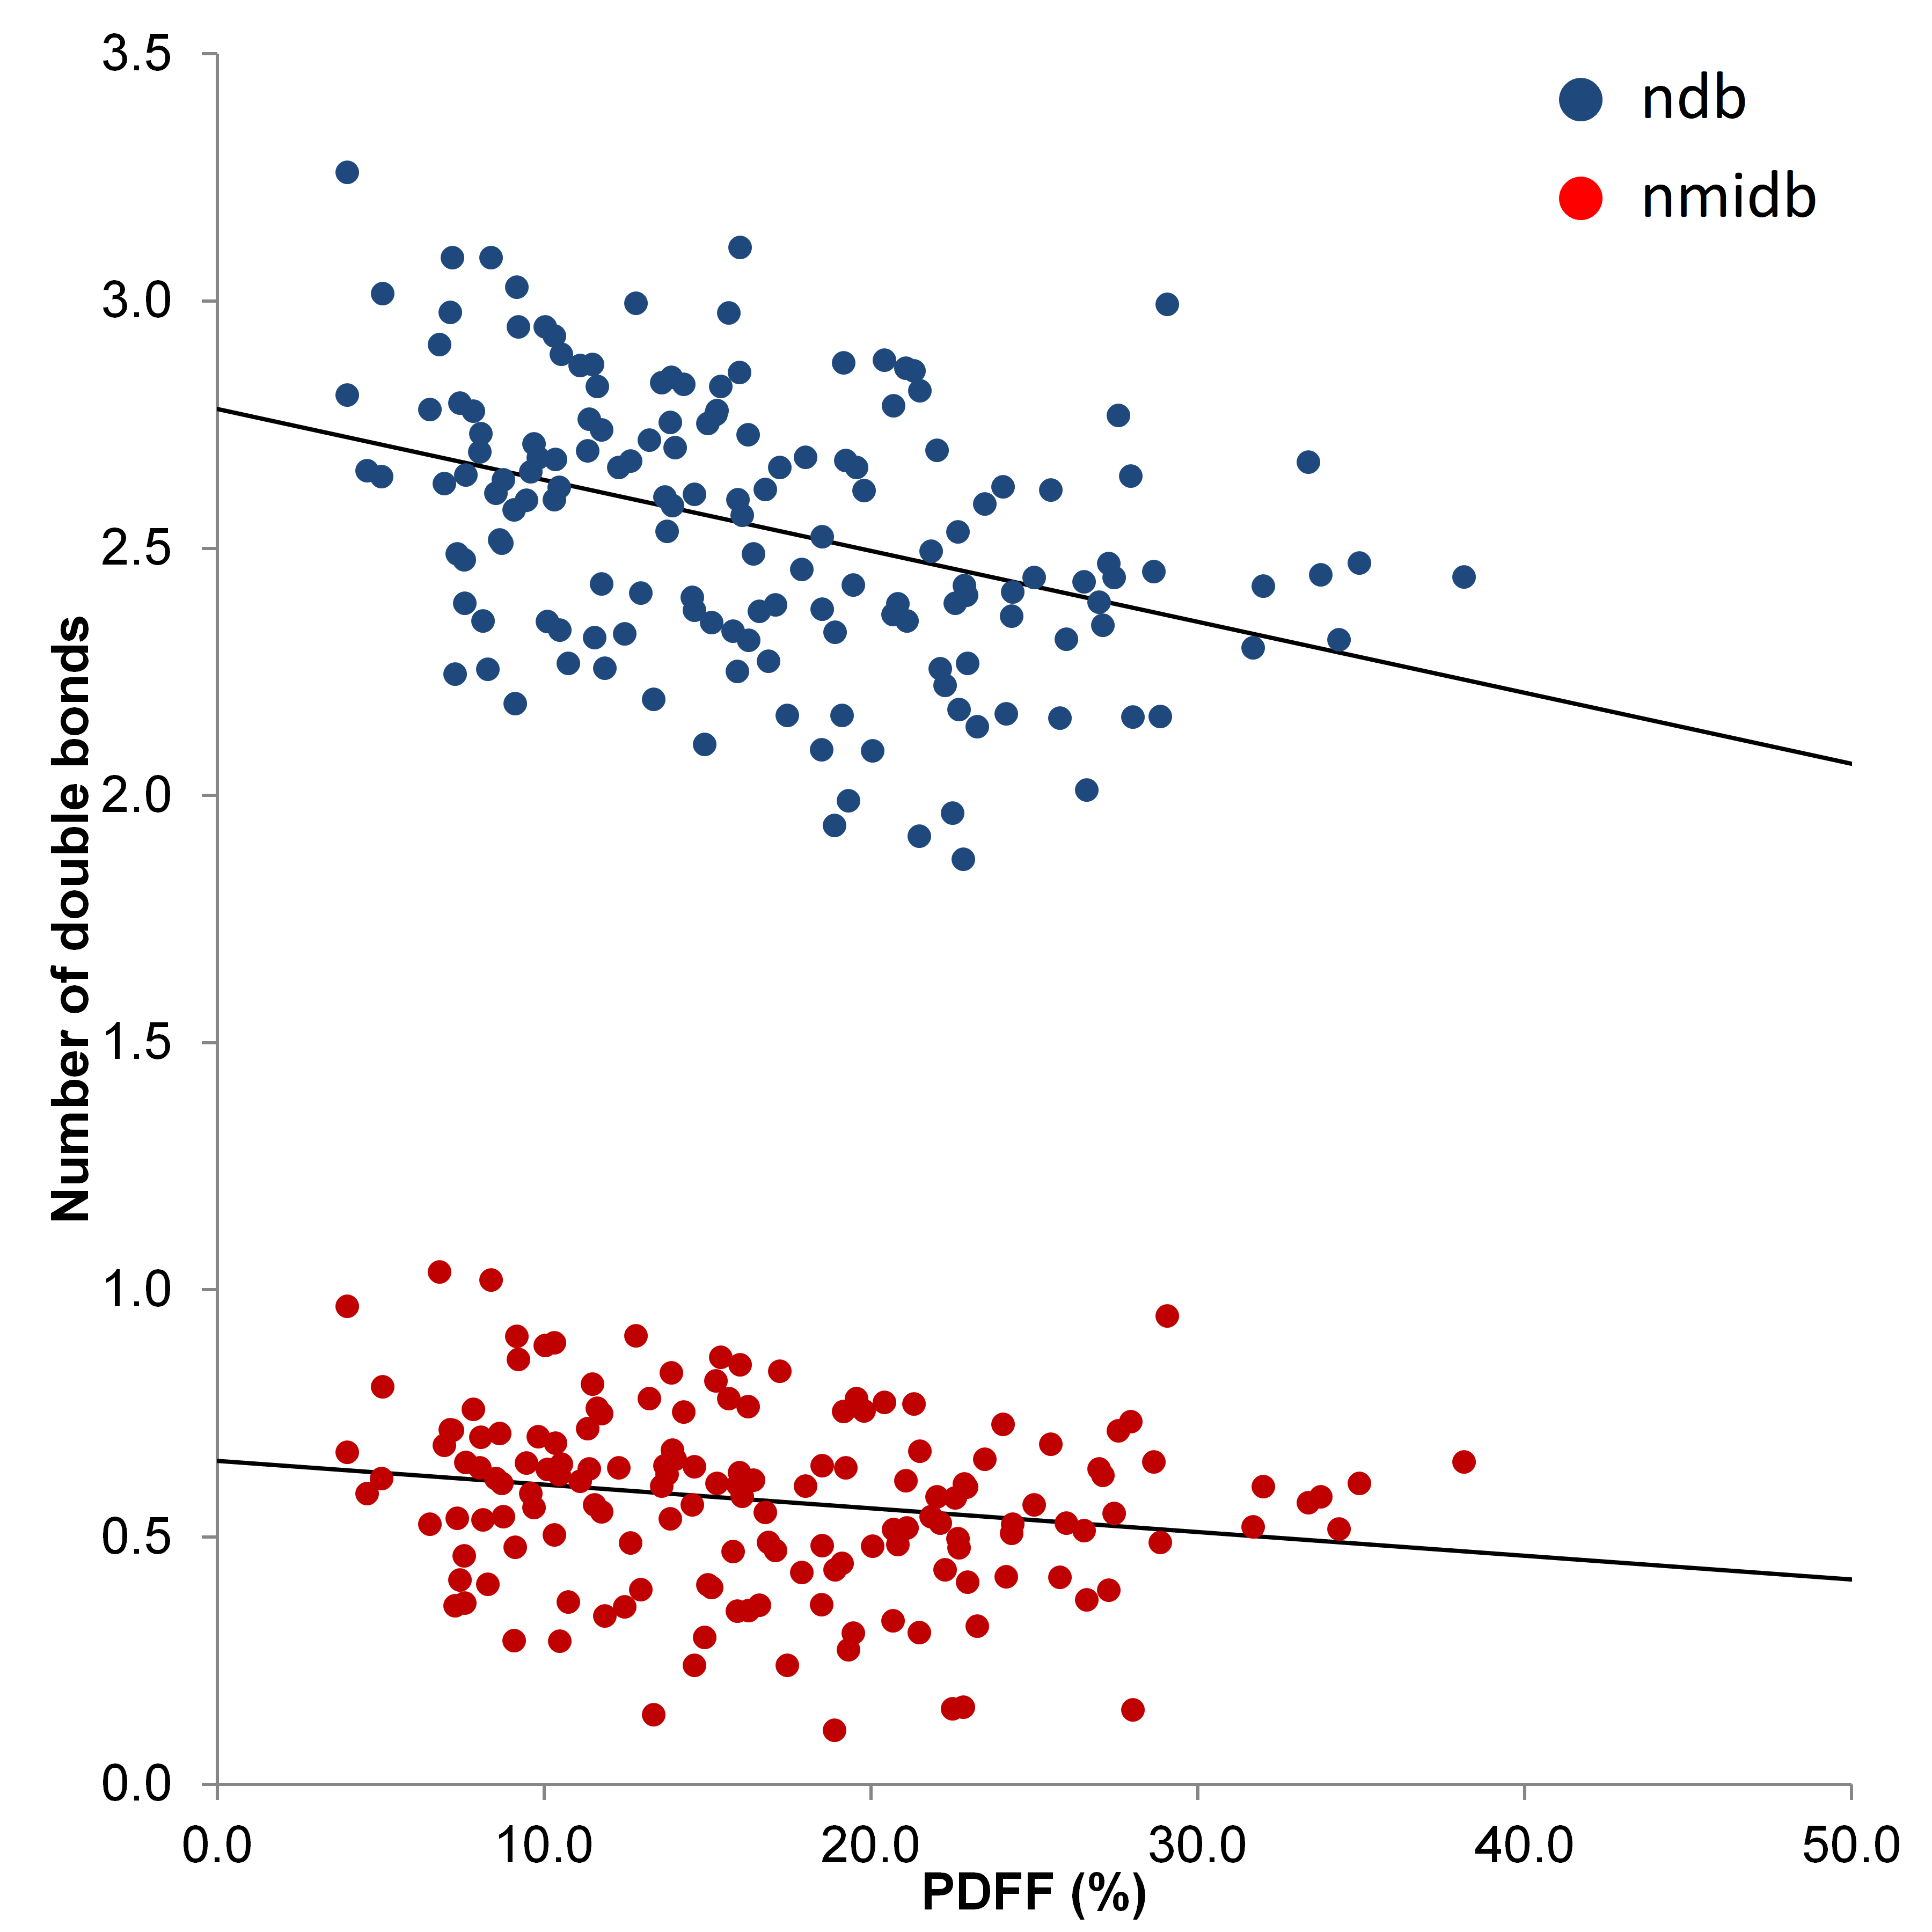
Figure 1 Comparison of liver ndb and nmidb with PDFF