2581
Validation of goose liver fat measurement by CSE-MRI with biochemical extraction as reference1Department of Radiology, Beijing Jishuitan Hospital, Beijing, China, 2Philips Healthcare, Beijing, China, 3Biomedical Engineering Department, King’s College London, London, United Kingdom, 4Department of Pathology, Capital Medical University Affiliated Beijing Ditan Hospital, Beijing, China, 5China national food & safety supervision and inspection center, Beijing, China, 6Department of Statistics, Beijing Jishuitan Hospital, Beijing, China
Synopsis
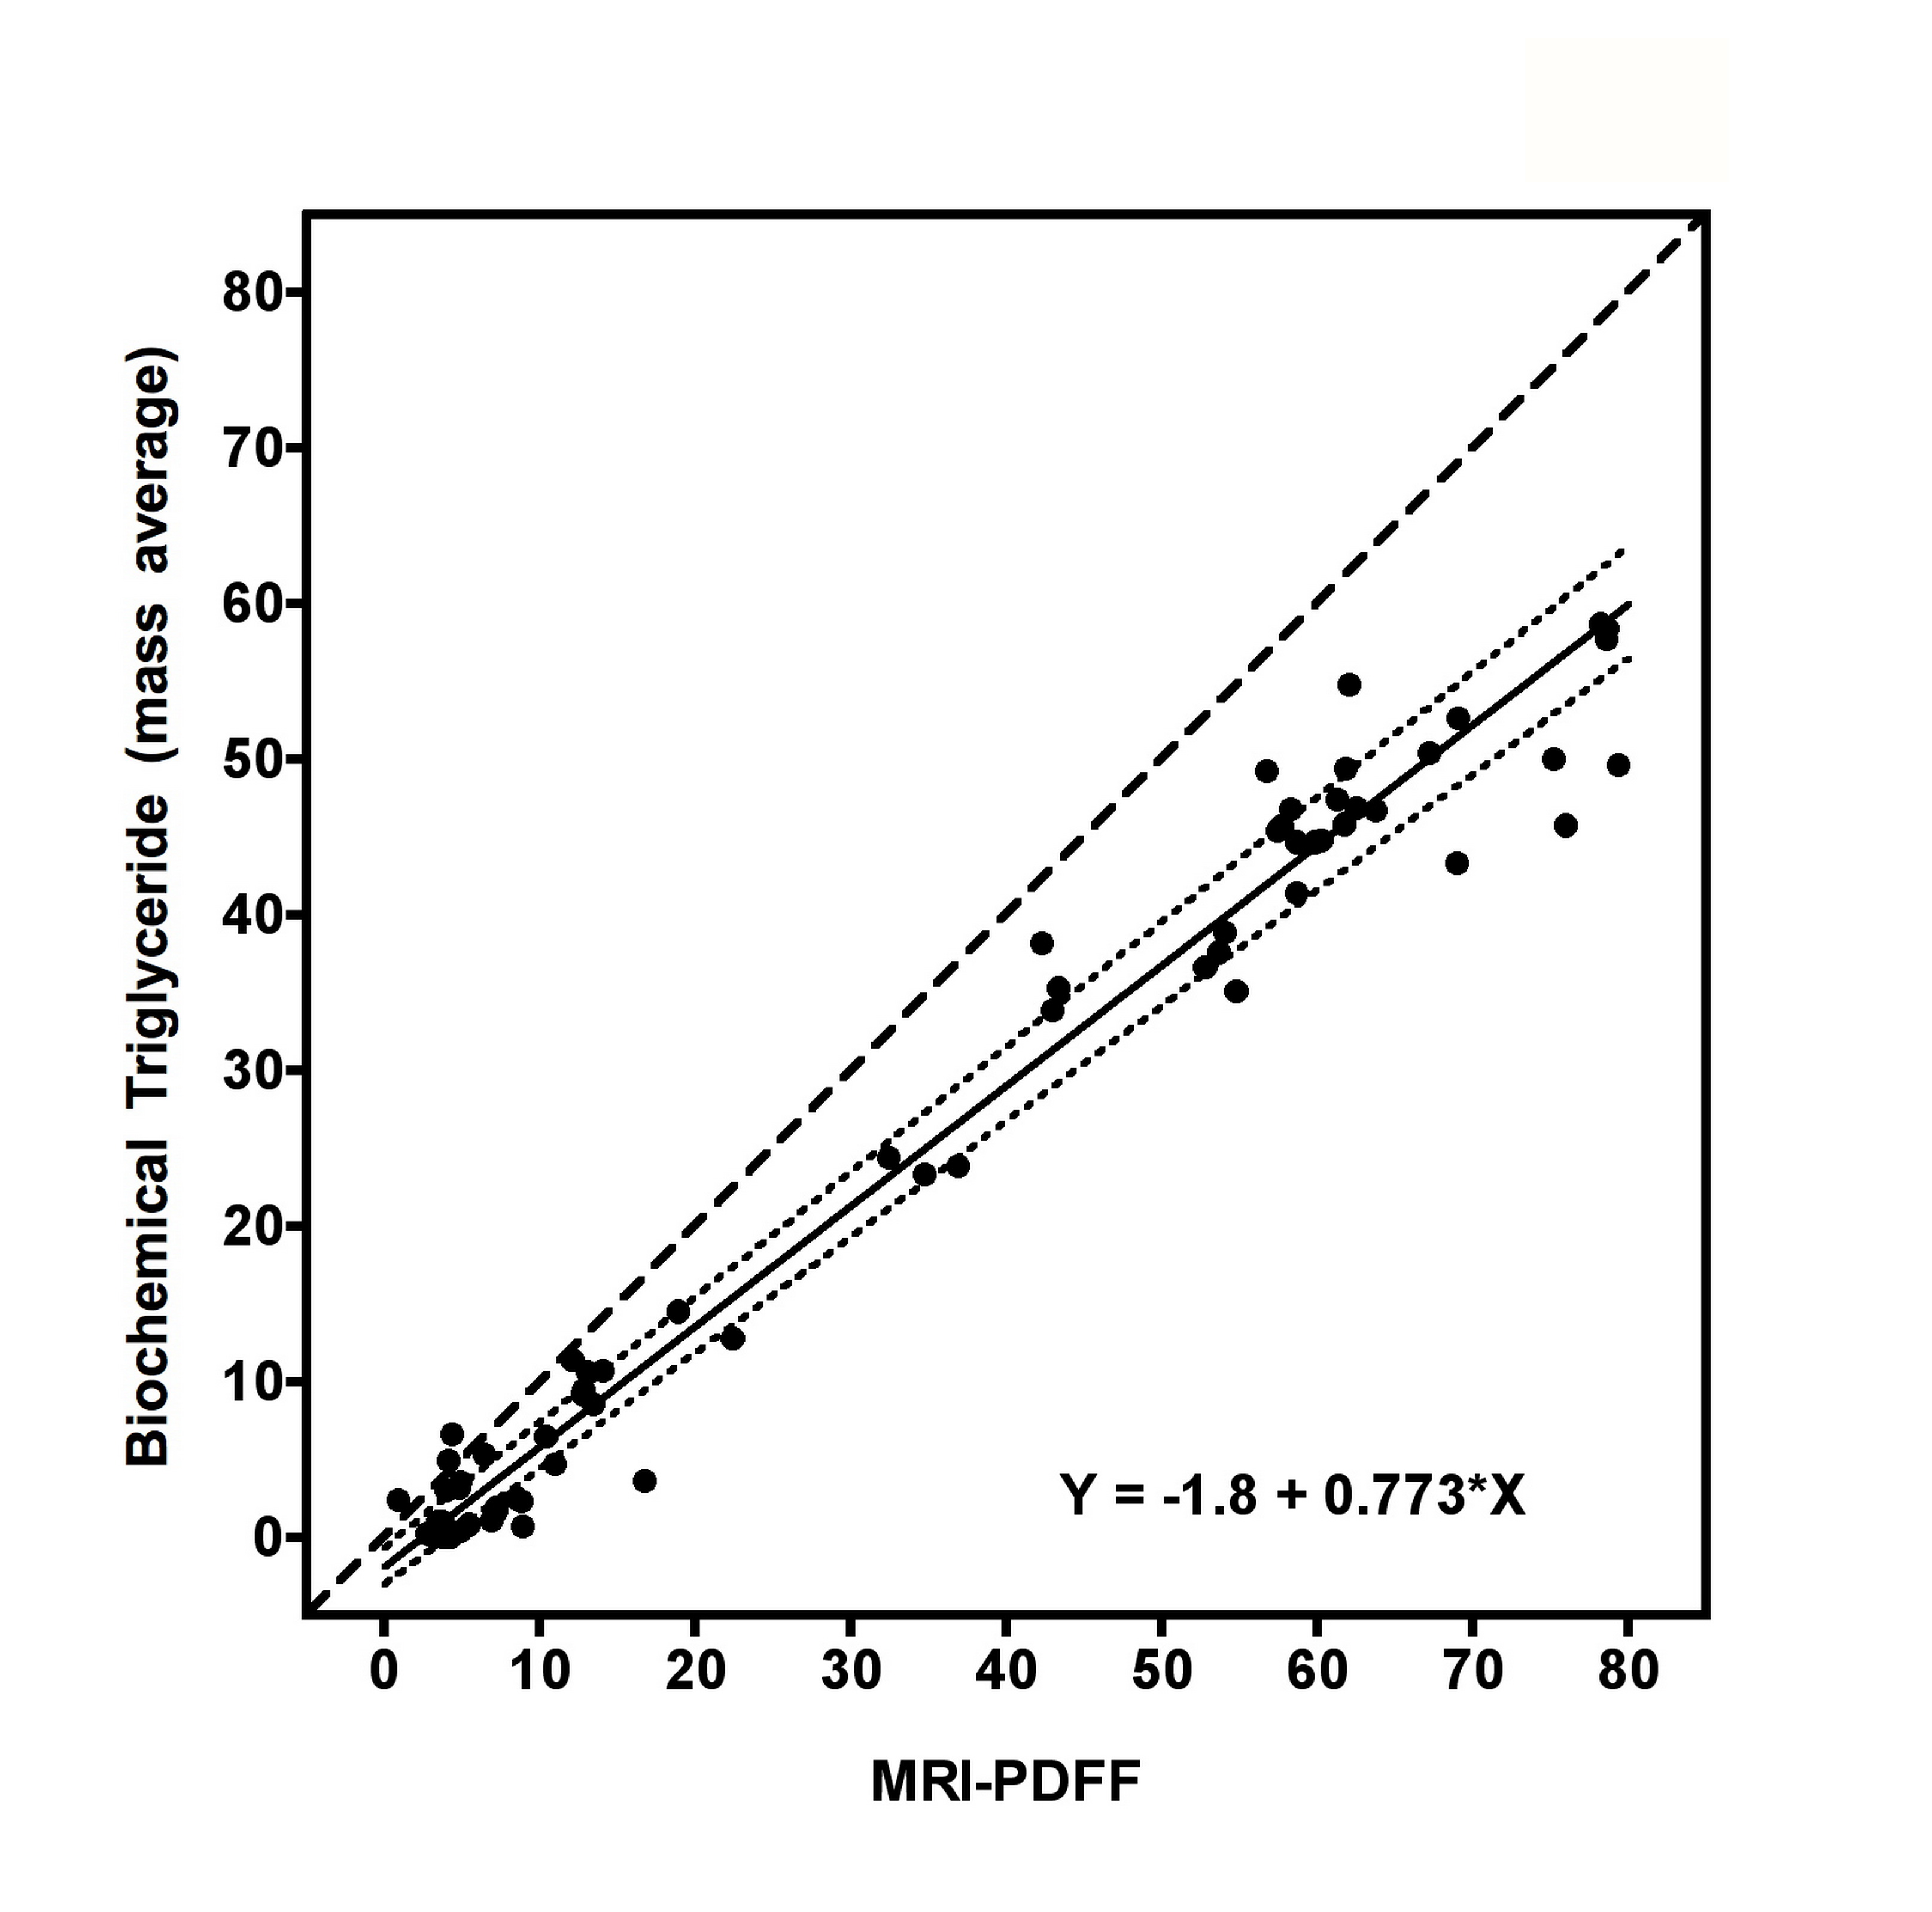
This study aimed to validate chemical shift encoded magnetic resonance imaging (CSE-MRI) to assess hepatic steatosis. Twenty-two geese with a wide range of hepatic steatosis were collected, and proton density fat fraction by MRI (MRI-PDFF), biochemical triglyceride content, and histology were performed within the left lobe, upper and lower half of the right lobe of the geese livers. MRI correlated highly with chemical extraction (r = 0.949 (p < 0.001)). Chemically extracted triglyceride was accurately predicted by MRI-PDFF (Y = -1.8 + 0.773﹡X). In conclusion, CSE-MRI measurement of goose liver fat was accurate and reliable compared with biochemical measurement.
INTRODUCTION
Non-alcoholic fatty liver disease (NAFLD) represents a spectrum of disorders characterized by the accumulation of fat in liver, and NAFLD is the most common etiology of chronic liver disease (1-4). Chemical shift encoded MRI (CSE-MRI) can discriminate between fat and water spins based on their different resonance frequencies, and multi-echo CSE-MRI techniques has been validated with excellent correlation with proton magnetic resonance spectroscopy (1H-MRS) and histological methods (5-10). The purpose of the present study was to validate the quantification of liver fat content by CSE-MRI on a group of geese, using biochemical extracted Triglyceride as the reference.METHODS
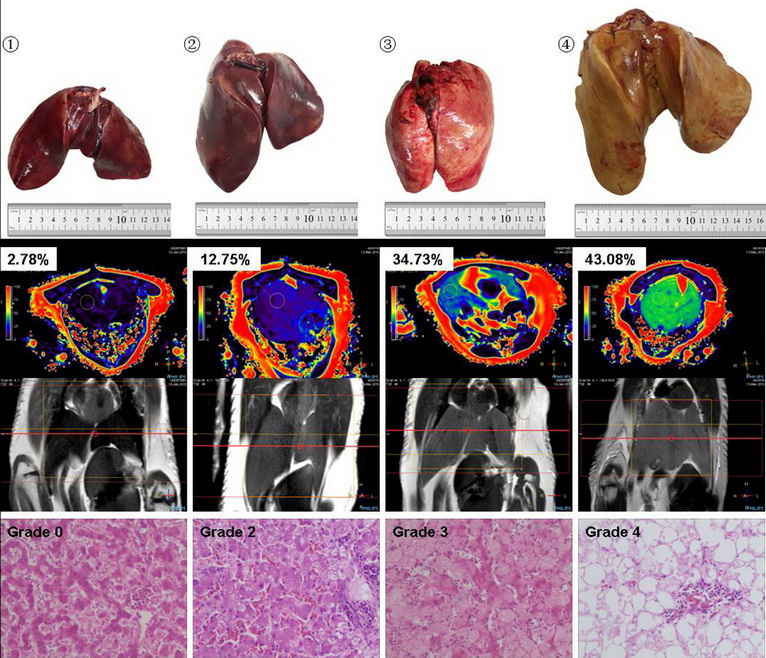
Twenty-two geese with a wide range of hepatic steatosis were collected. CSE-MRI examinations (mDixon quant) were performed on a 3T MRI unit (Ingenia 3.0T TX, Philips, Best, the Netherlands) for all geese, and then liver of each goose was removed and samples were taken from the left lobe, upper and lower half of the right lobe for biochemical measurement and histology (Figure. 1). Triglyceride content (g) of the dry samples were determined by Soxhlet extraction (11), and the triglyceride mass percent of the goose liver were then obtained using the triglyceride content (g) and the wet weight (g) of the sample. According to the percentage of cells affected by fat vacuoles, the histological results were interpreted as: grade 0 for less than 5%, grade 1 for 5–30%, grade 2 for 31–50%, grade 3 for 51–75%, and grade 4 for more than 75% (12). Fat percentages by proton density fat fraction by MRI (MRI-PDFF) were measured within the sample regions of biochemical measurement. The intra-observer agreement of MRI-PDFF measurements was assessed using two ROI measurements by the same radiologist with an interval of one month. The accuracy of MRI-PDFF measurement was assessed through Spearman correlation coefficient (r) and Passing and Bablok regression equation using biochemical measurement as the gold standard. To detect the variability of fat distribution, we compare the values of the three ROIs derived from the same goose liver, using mixed model repeated measurements analysis.RESULTS
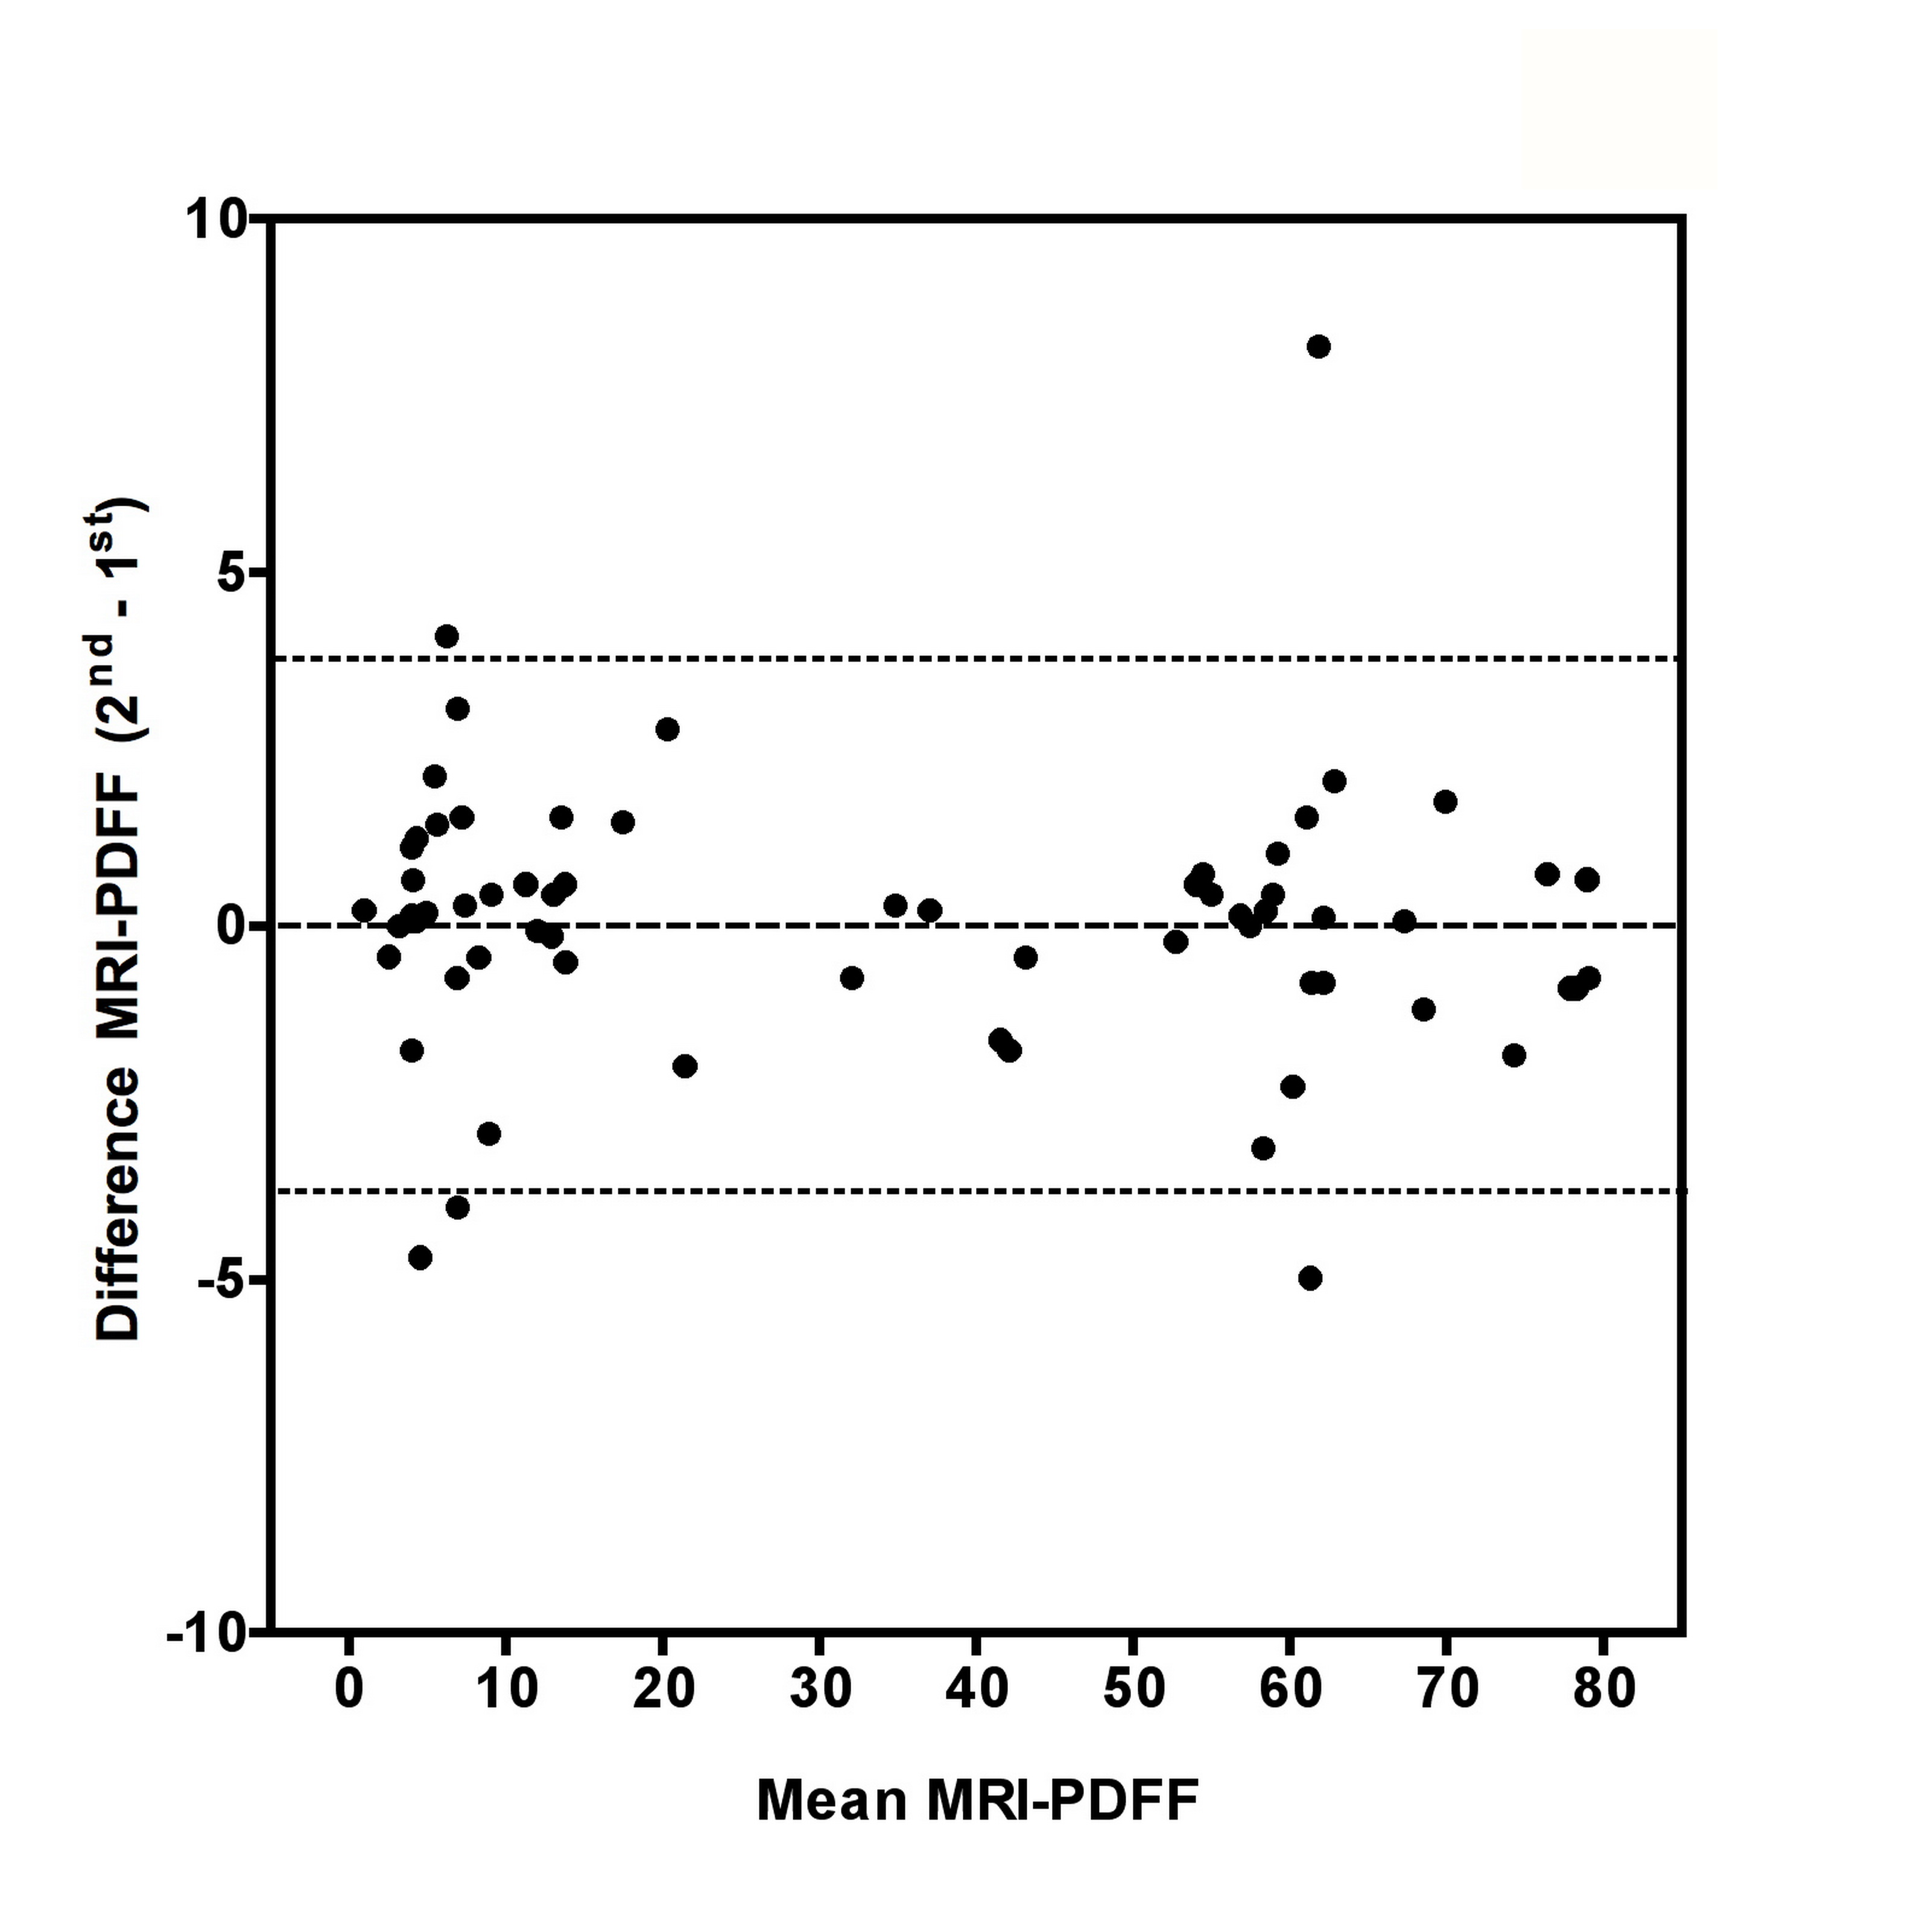
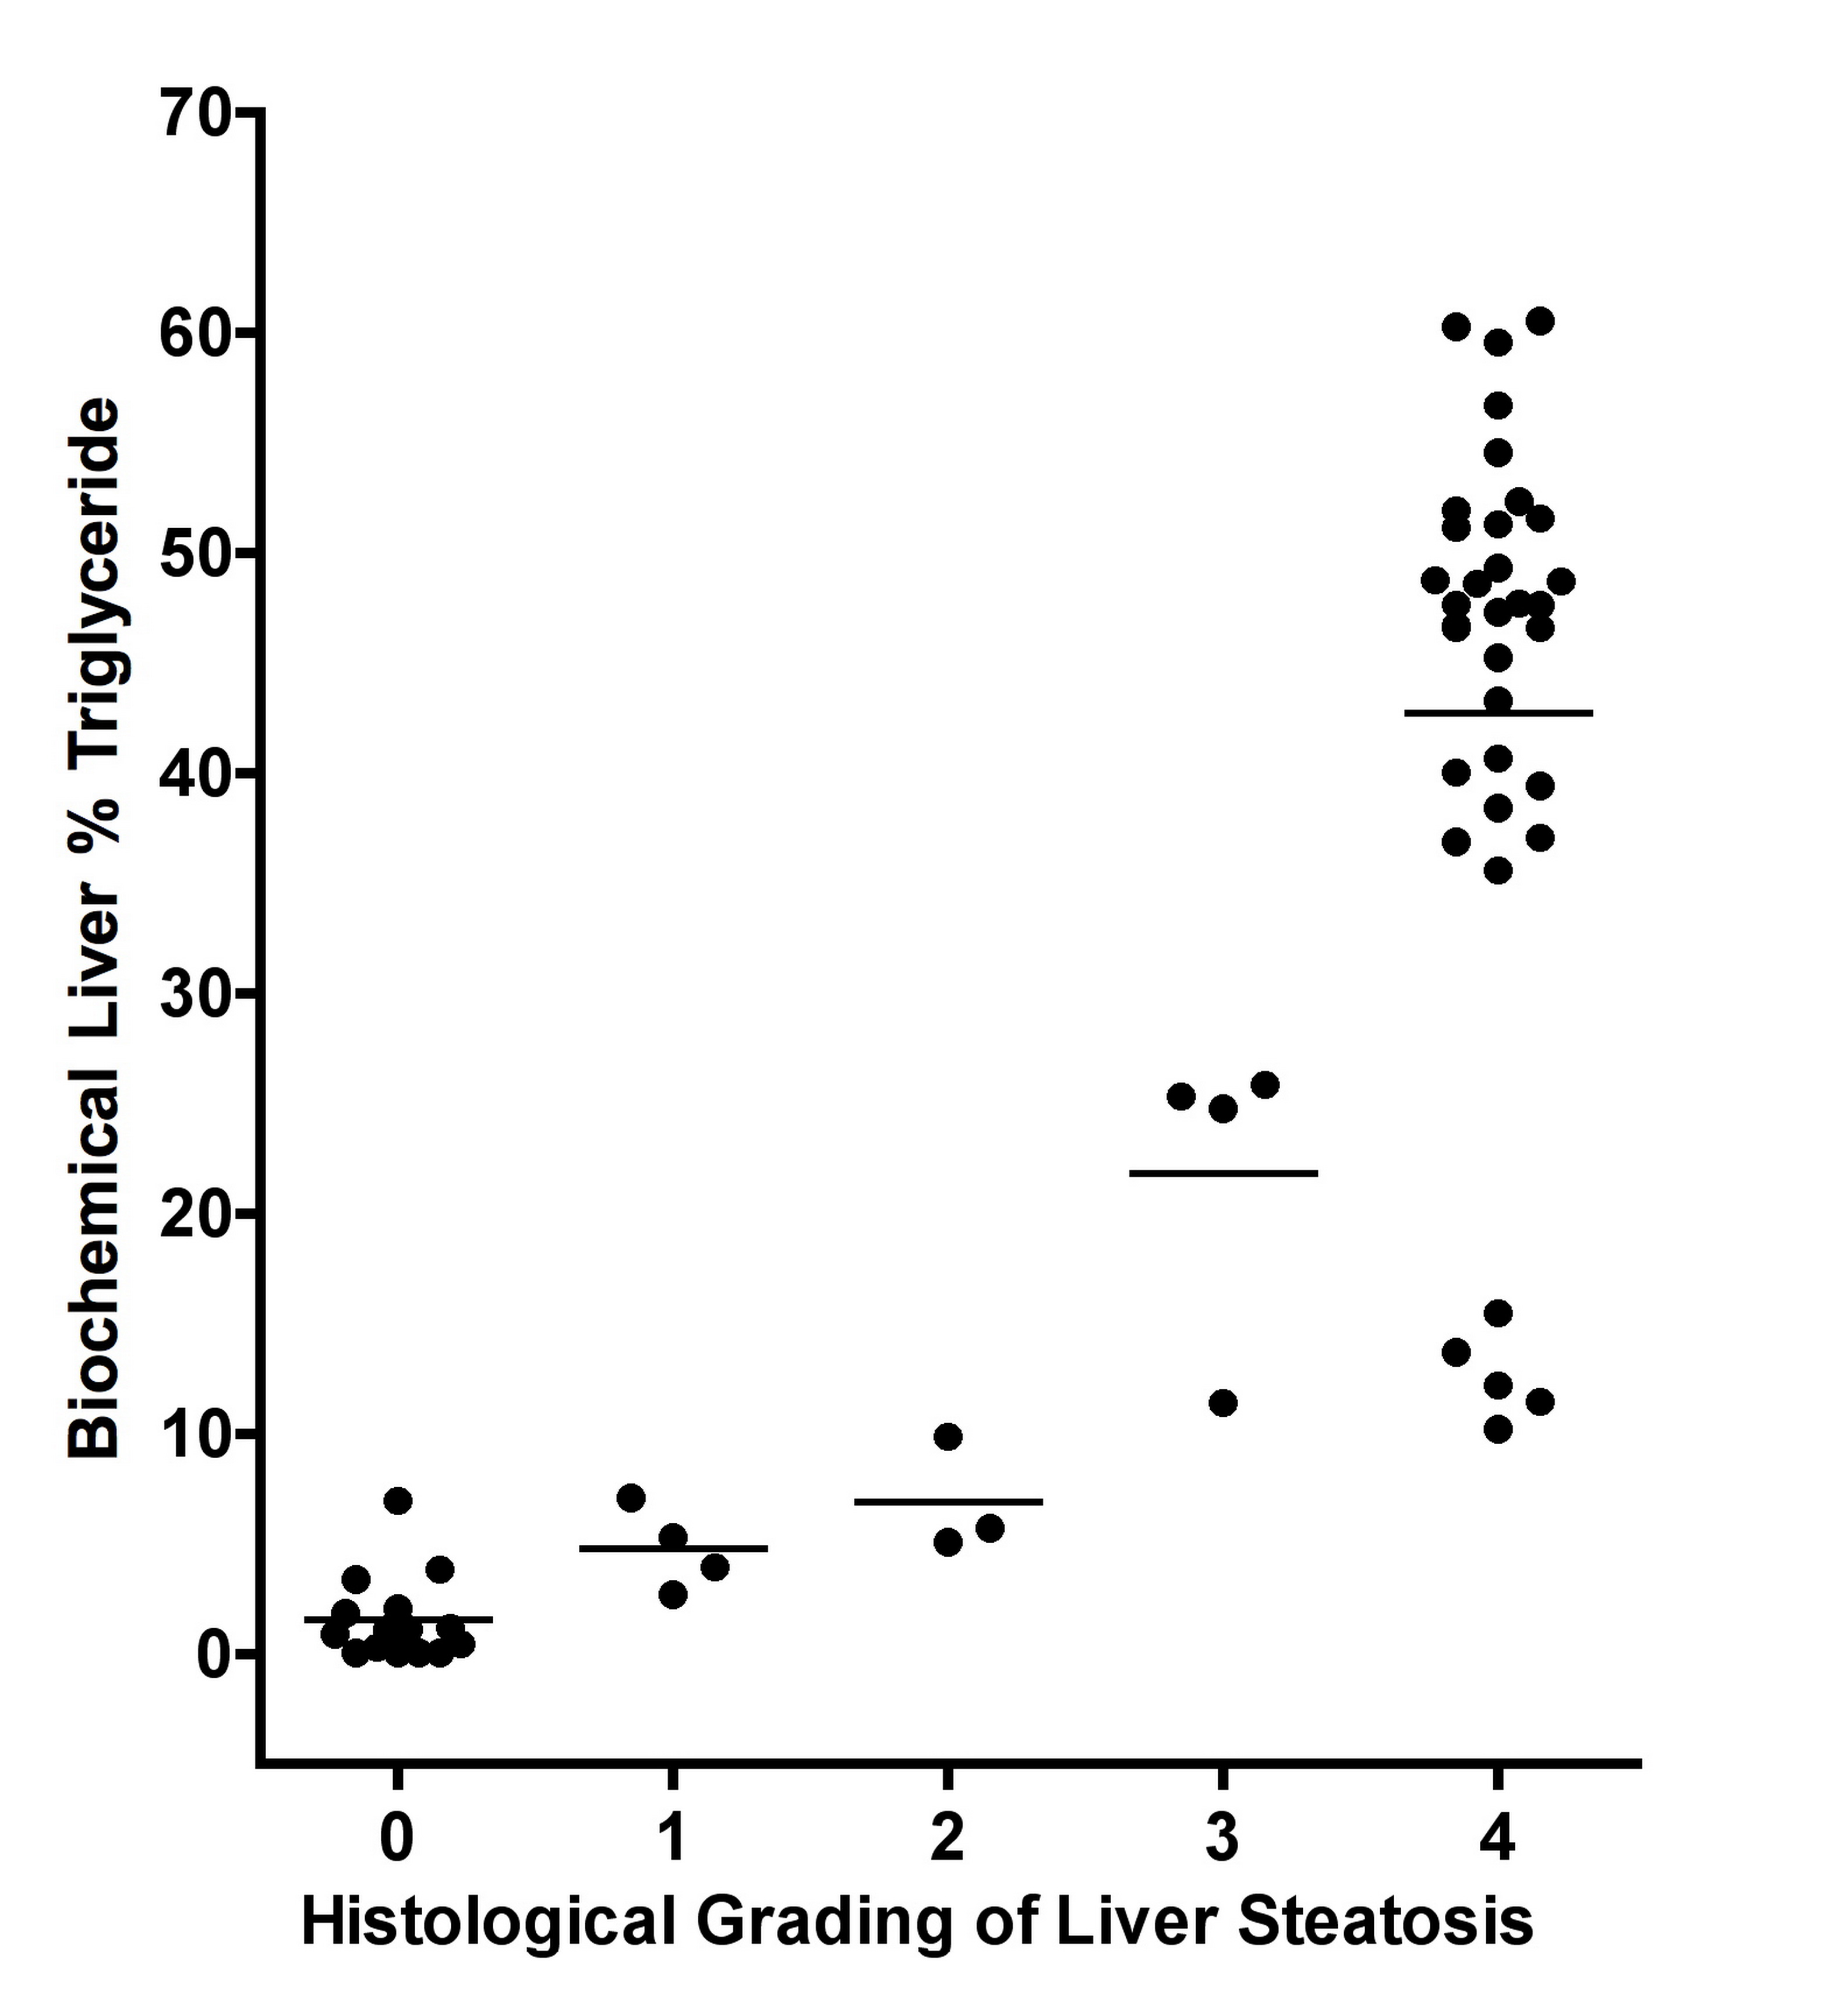
Gross visual evaluation demonstrated the wide range of hepatic steatosis of the geese livers, and these differences of hepatic steatosis were clearly observed by MRI-PDFF and histology (Figure. 2). The mean value (± standard deviation (SD), range) of biochemical triglyceride mass percentage and MRI-PDFF was 24.13% (± 21.1%, 0.04–58.7%) and 33.81% (± 27.53%, 0.88–79.41%), respectively. Bland-Altman analysis demonstrated a very high intra-observer agreement for MRI-PDFF ROI measurement, the intra-class correlation coefficient of was 0.998 (p < 0.001) (Figure. 3). High correlation was detected between MRI-PDFF and triglyceride mass percentage (r = 0.949, p < 0.001). Passing and Bablok regression indicated that triglyceride mass percentage can be predicted by MRI-PDFF (Figure. 4). The mean value of difference between MRI-PDFF and triglyceride mass percentage was 9.68% (95%CI: -5.28–24.63%, p < 0.001). Figure 5 showed the distribution of triglyceride percentage at each division of histological grading. The biochemical result of each group defined by histology was 0.04-6.95% for grade 0, 2.69-7.09% for grade 1, 5.08-9.86% for grade 2, 11.39-25.85% for grade 3, and 10.2-60.54% for grade 4, respectively. No statistically significant differences of fat percentage among the three sampled regions were detected by MRI-PDFF (p = 0.995), biochemical extraction (p = 0.998), or histological grading (p = 0.416).DISCUSSION
In previous studies, the correlation coefficient between MRI measured liver fat content and chemically estimated liver fat varied from 0.74 to 0.96 (13-17). Our study demonstrated comparable results regarding to the correlation coefficient between MRI and biochemical extraction (0.949 vs. 0.74–0.96). The MR mDixon-quant technique is complicated and the results can be influenced by many factors. First, MRI-PDFF measures the ratio of number of hydrogen protons in fat comparing to the number in both fat and water, while biochemical extraction measures the triglyceride content in the liver. Another issue is that mDixon MRI (using relatively longer TE than in solid state physics spectroscopy methods) cannot measure the signal from hydrogen protons that are closely connected to large proteins, or in a solid or semi-solid state. The “dry” mass of tissue could account for 3~15% of total mass. These factors generate a systematic shift in the final output, and may explain the slight bigger MRI-PDFF output than biochemical extraction observed in this study.CONCLUSION
CSE-MRI methods can measure liver fat content accurately and reliably in comparison with chemical methods, and these results justify the use of CSE-MRI in the clinical setting to assess and monitor liver steatosis.Acknowledgements
We thank our study participants for contributing their time and efforts. We wish to thankPhilips Healthcare for its technical supports.References
1. Bedogni G, Miglioli L, Masutti F, Tiribelli C, Marchesini G, Bellentani S. Prevalence of and risk factors for nonalcoholic fatty liver disease: The Dionysos nutrition and liver study. Hepatology 2005;42:44–52. 2. Vernon G, Baranova A, Younossi ZM. Systematic review: The epidemiology and natural history of non-alcoholic fatty liver disease and non-alcoholic steatohepatitis in adults. Aliment Pharmacol Ther 2011;34:274–285. 3. Ong JP, Younossi ZM. Epidemiology and natural history of NAFLD and NASH. Clin Liver Dis 2007;11:1–16. 4. Sass DA, Chang P, Chopra KB. Nonalcoholic fatty liver disease: A clinical review. Dig Dis Sci 2005;50:171–180. 5. Eggers H, Brendel B, Duijndam A, Herigault G. Dual-echo Dixon imaging with flexible choice of echo times. Magn Reson Med 2011;65:96–107. 6. Idilman IS, Aniktar H, Idilman R, Kabacam G, Savas B, Elhan A, Celik A, et al. Hepatic steatosis: quantification by proton density fat fraction with MR imaging versus liver biopsy. Radiology 2013;267:767–775. 7. Reeder SB. Emerging quantitative magnetic resonance imaging biomarkers of hepatic steatosis. Hepatology 2013;58:1877–1880. 8. Yu H, Shimakawa A,McKenzie CA, Brodsky E, Brittain JH, Reeder SB. Multiecho water-fat separation and simultaneous R2* estimation with multifrequency fat spectrum modeling. Magn Reson Med 2008;60:1122–1134. 9. Kukuk GM, Hittatiya K, Sprinkart AM, Eggers H, Gieseke J, Block W, Moeller P, et al. Comparison between modified Dixon MRI techniques, MR spectroscopic relaxometry, and different histologic quantification methods in the assessment of hepatic steatosis. Eur Radiol. 2015;25:2869-2879. 10. Livingstone RS, Begovatz P, Kahl S, Nowotny B, Strassburger K, Giani G, Bunke J, et al. Initial clinical application of modified Dixon with flexible echo times: hepatic and pancreatic fat assessments in comparison with (1)H MRS. Magn Reso Mater Phy 2014;27:397-405. 11. Wu CS. He JH. Guo XD, Luo HY, Ye JR, Huang JF, Wu YL, et al. Meat and meat products-Determination of total fat content (GB/T 9695.7-2008). Beijing: General Administration of Quality Supervision, Inspection and Quarantine of the People’s Republic of China, 2008:1-3. 12. Schwimmer JB, Behling C, Newbury R, Deutsch R, Nievergelt C, Schork NJ, Lavine JE. Histopathology of pediatric nonalcoholic fatty liver disease. Hepatology 2005;42:641-649. 13. Artz NS, Hines CD.G, Brunner ST, Agni RM, Kuhn JP, Roldan-Alzate A, Chen GH, et al. Quantification of hepatic steatosis with dual-energy computed tomography: Comparison with tissue reference standards and quantitative magnetic resonance imaing in the ob/ob mouse. Invest Radiol 2012;47:603-610. 14. Runge JH, Bakker PJ, Gaemers IC, Verheij J, Hakvoort TB, Ottenhoff R, Nederveen AJ, et al. Measuring liver triglyceride content in mice:non-invasive magnetic resonance methods as an alternative to histopathology. MAGMA 2014;27:317-327. 15. Hijona E, Sanchez-Gonzalez J, Alustiza JM, Hijona L, Arenas J, Garcia E, Rojas N, et al. Accurate fat fraction quantification by multiecho gradient-recalled-echo magnetic resonance at 1.5 T in rats with nonalcoholic fatty liver disease. Eur J Radiol 2012;81:1122-1127. 16. Hines CD.G, Yu HZ, Shimakawa A, McKenzie CA, Warner TF, Brittain JH, Reeder SB. Quantification of hepatic steatosis with 3T MR imaging: Validation in ob/ob mice. Radiology 2010;254:119-128. 17. Bannas P, Kramer H, Hernando D, Agni R, Cunningham AM, Mandal R, Motosugi U, et al. Quantitative MR Imaging of Hepatic Steatosis: Validation in Ex Vivo Human Livers. Hepatology 2015,62:1444-1455.Figures
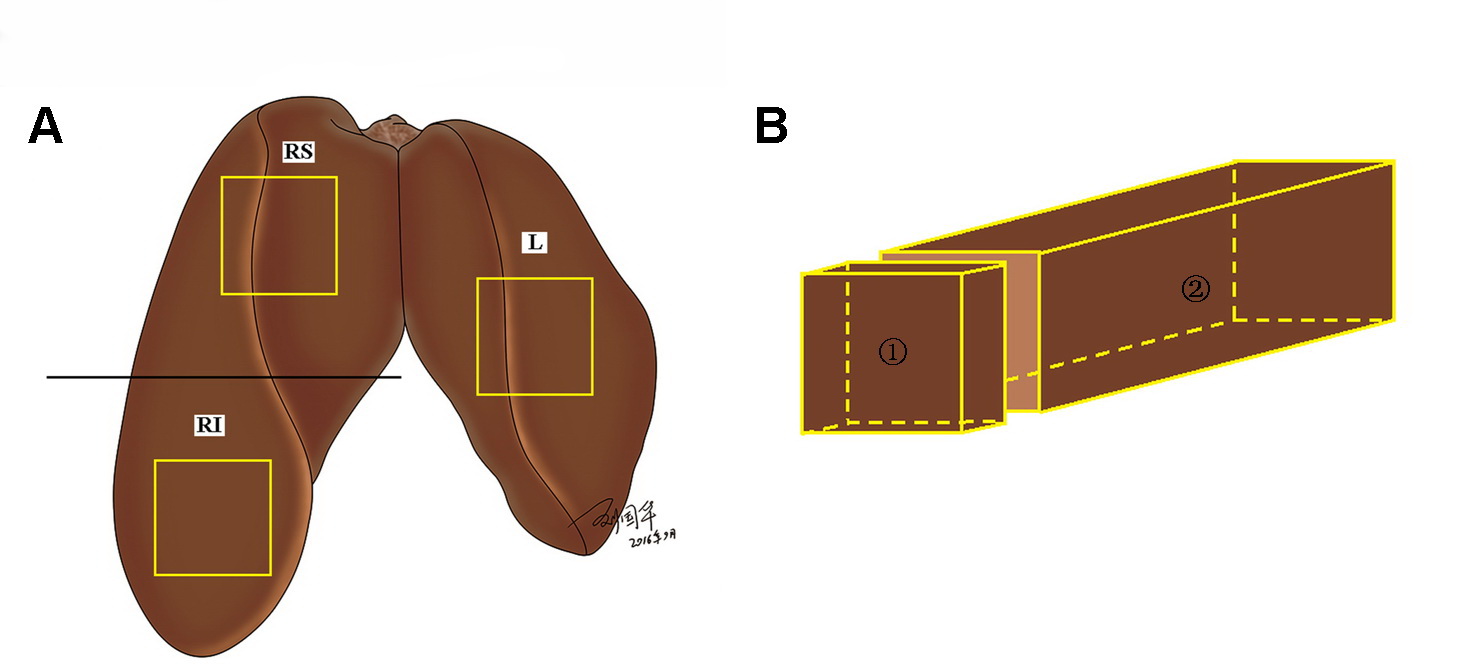
Fig. 1: Sampling regions of goose liver for biochemical
measurement and pathology grading. (A) The
liver is divided into left (L) and right lobes, and the right lobe is cut into
upper (RS) and lower (RI) halves. Samples (yellow box) of approximately 60×30×30 mm in size were taken in the middle of
each lobe. (B) A small piece of
tissue (①) was taken from each sample
for pathology grading, and the remaining tissue (②)
was used for biochemical measurement.