2580
Validation of magnetic resonance imaging-proton density fat fraction for hepatic fat content in healthy Asian population1Radiology, Medanta Hospital, Gurgaon, India
Synopsis
The primary purpose of this work was to determine the precision of clinical MR imaging-
Introduction
PDFF is now clinically established technique for estimating hepatic fat. However, MR imaging-PDFF for hepatic fat estimation needs to be validated in different ethnic and geographic populations. The rigorous validation of a biomarker also requires an understanding of the precision (repeatability), spatial heterogeneity, normal range of a method to establish normative data range, and assess clinically significant change for drug effects to be calculated. The primary purpose of this work was to determine the precision of clinical MR imaging-PDFF hepatic fat quantification in normal Indian adult population, to establish the least significant change (LSC) and gather normative data in Indian population.Material and Methods
A total of 219 subjects with histologically proven grade 0 steatosis and no fibrosis were included. The time interval between liver biopsy and MR imaging ranged 1 to 16 days (mean 6 days). All patients had normal laboratory results for exclusion of liver diseases. Imaging was performed on 1.5 T clinical scanner (Aera, Siemens, Germany) using an eight-channel body phased array coil. 32 subjects had PDFF measurements in the same sitting, 20 had repeated measurements after 24 hours, 15 had after 1 week and 24 had repeated measurements after one month. For each patient, two repeated measurements of quantitative PDFF were made to assess repeatability (precision) of both techniques. For volumetric MRI fat-fraction imaging, multiecho three-dimensional volume interpolated breath-hold examination (VIBE) sequence was used. Using fly-back readouts, a total of six echoes were acquired per TR. Imaging parameters for the MRI sequence were: first TE =1.3 ms, echo spacing = 2.0 ms, TR = 13.7 ms, BW = ± 125 kHz, FOV = 35 × 35 cm, slice =10 mm, 256 × 128 matrix, flip = 5°. Inline reconstructed fat fraction map images were displayed and edited in DICOM format. ROI analysis was performed on the Syngo Via Workstation Statistical Analysis Two independent readers in consensus recorded fat-fraction from the reconstructed fat fraction maps, respectively, measured in nine regions of interest (ROIs- at least 1cm2) corresponding to each of the nine Couinaud segments.
Precision of MRI fat-fraction measurements was assessed through Bland-Altman analysis between time points for both readers using average fat-fraction across the liver. ANOVA was used to look at the difference in values in the various liver segments, and right versus left lobe. Bland- Altman analysis was performed in the right and left lobe. 95% CI of normal PDFF values for Indian population were calculated by averaging segmental and repeatability measurements. LSC was calculated using coefficient of variation and standard error of mean.
Results
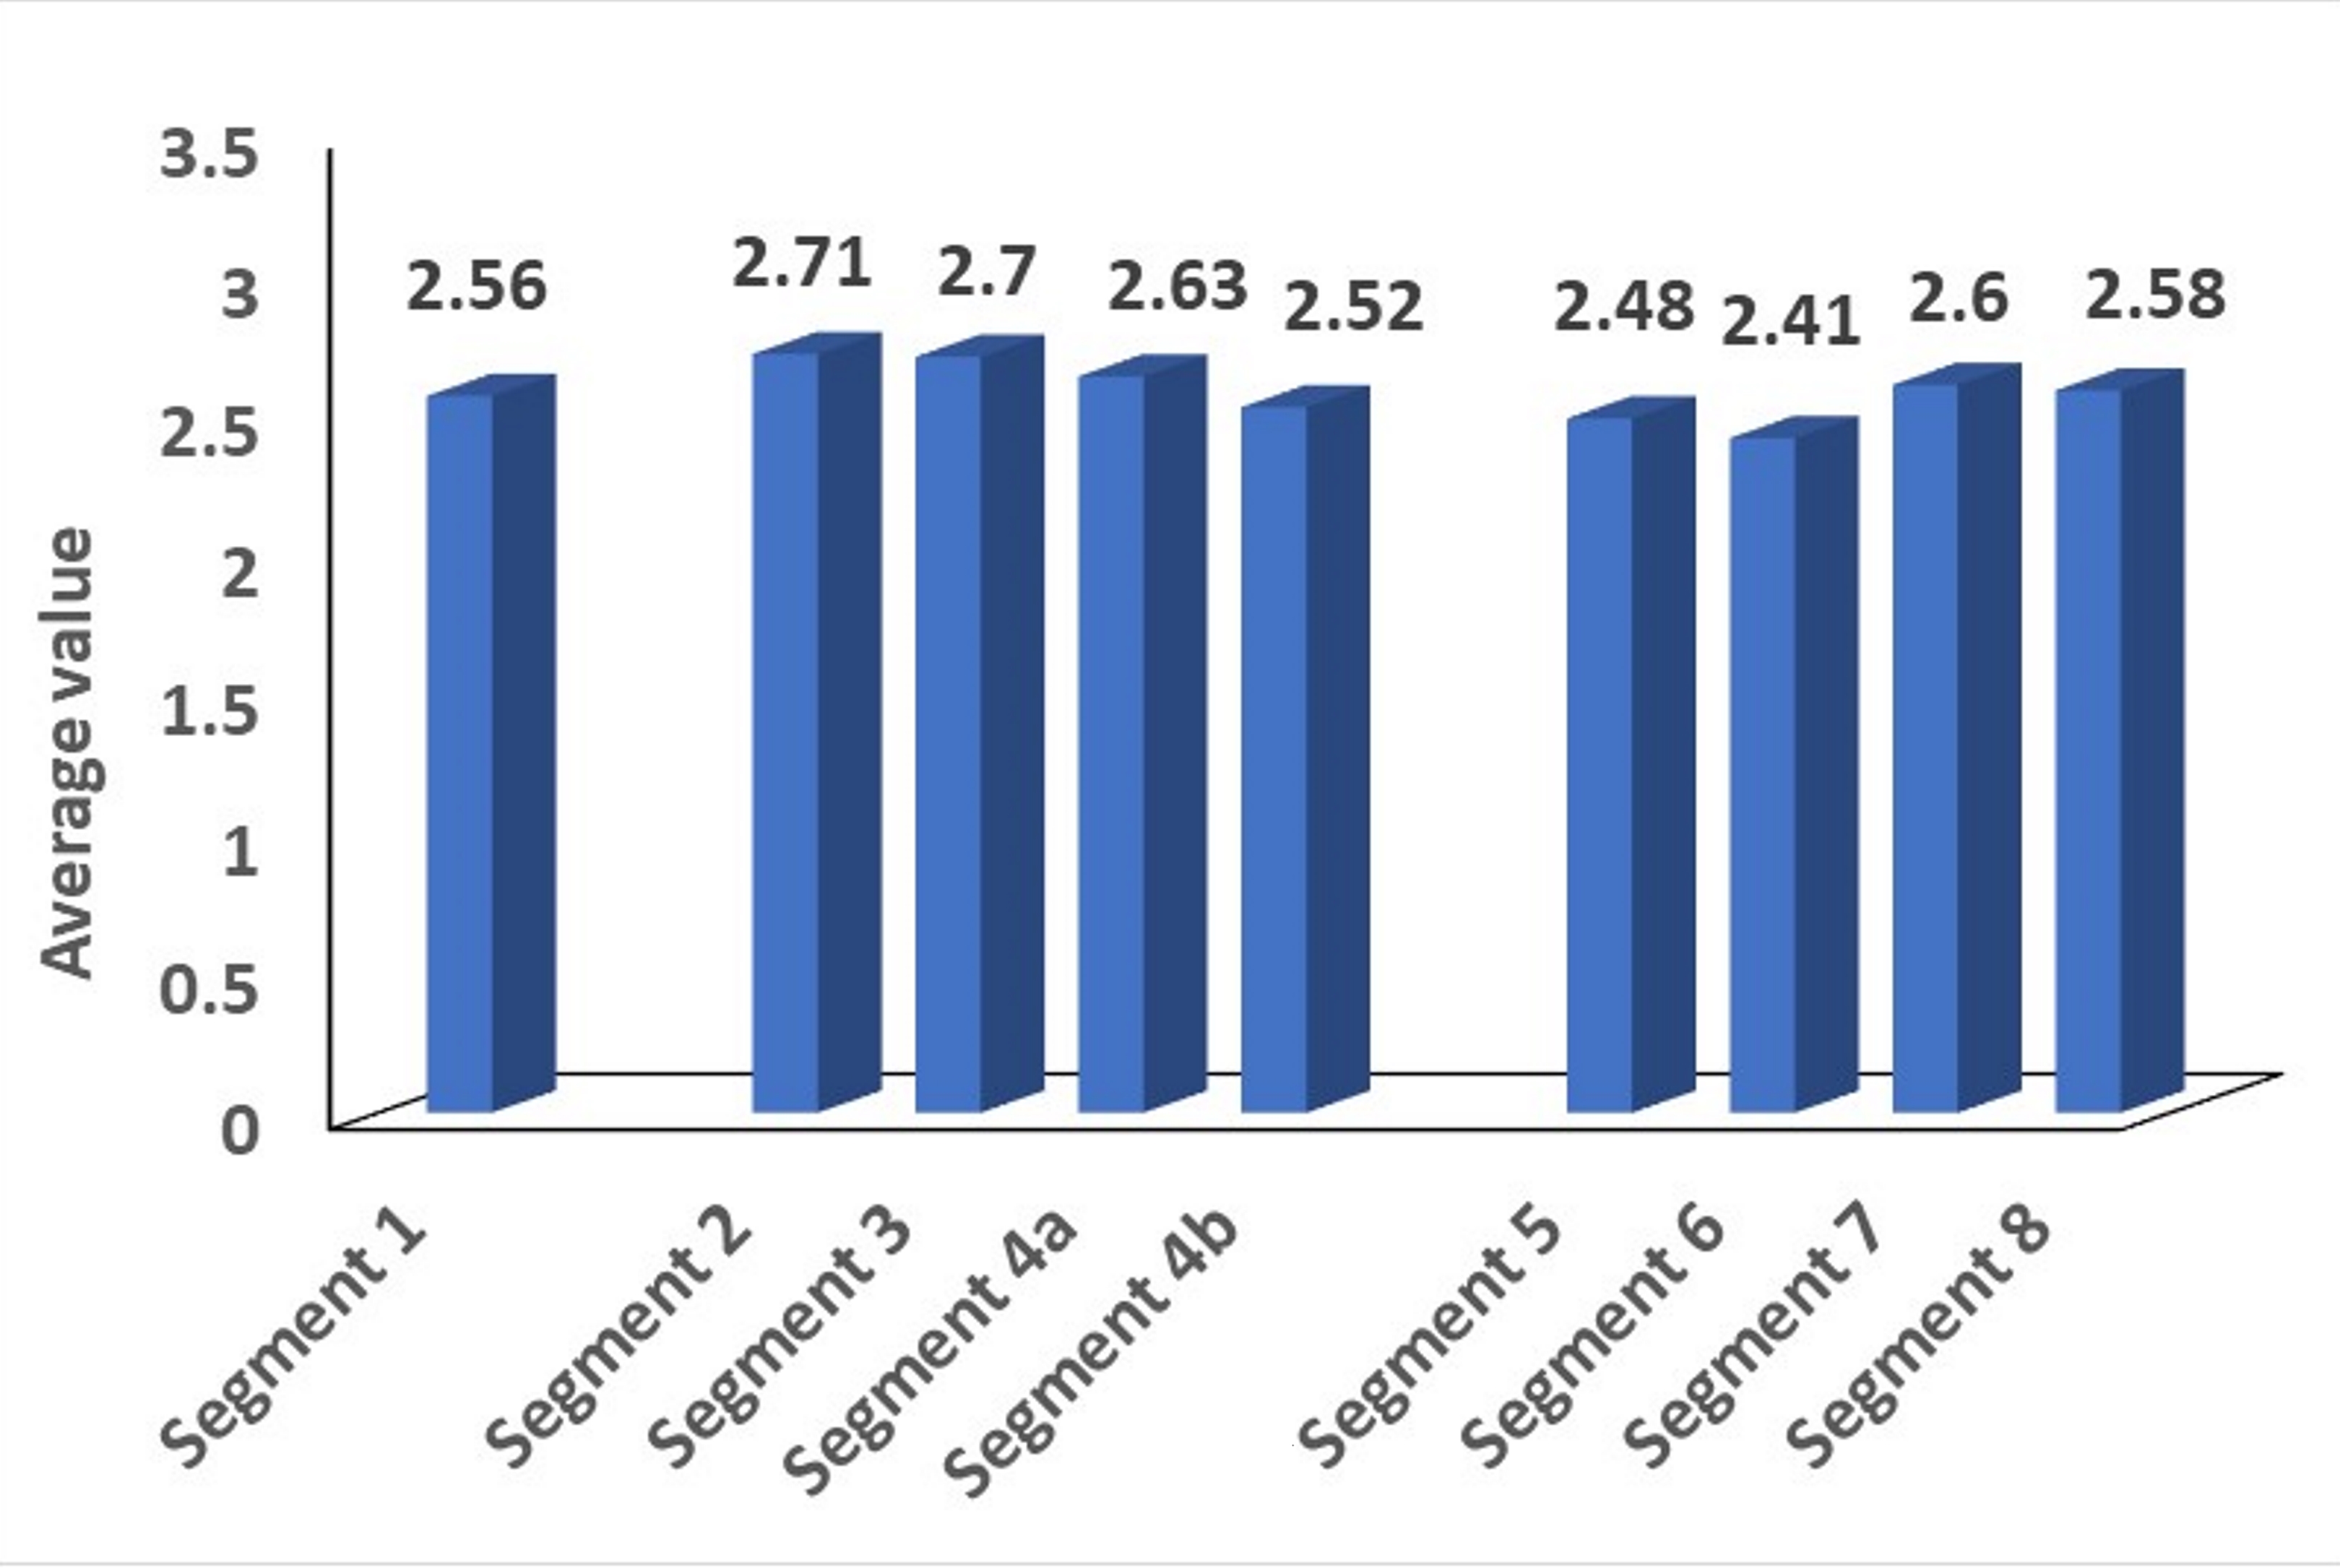
The mean hepatic fat content calculated by MR imaging-PDFF was 2.89% in normal Indian population. On averaging the repeatability and segmental ROI 95% CI of PDFF derived fat fraction values for normal Indian population was 1 to 6.8%. Mean liver fat content by MR imaging-PDFF in segments I, II, III, IV, V, VI, VII and VIII were 2.5%, 2.7%, 2.5%, 2.6%, 2.6%, 2.6%, 2.4% and 2.8% respectively (Figure 1). There was no statistically significant difference among calculated PDFFs with respect to different liver Couinaud segments (p = 0.3) or right versus left lobe (p=0.3). In the repeatability studies the 95% Bland Altman limits of agreement in the same sitting was -2% to +1.5%; within one day, -1.9% to +1.6%; within one week, -1.7% to 1.8%; and within one month, -1.4% to 1.5%. . LSC was calculated at 2.1%Discussion
The current study is the first study determining normative data of hepatic fat content in histologically proven grade 0 steatosis population from India. It is known that there is spatial heterogeneity in patients with fatty infiltration of the liver 1, however in the patients with less than 5% hepatic steatosis histologically, our study has shown that there is no systematic or significant difference in the right versus left lobe, or any of the liver segments (Figure 1). This fact has significance in healthy liver donors where based on our study we can surmise, the fat would be uniformly distributed. The MR-imaging PDFF method is easy to perform and has good precision 2also shown by our study. In our study, short term and long-term reproducibility was good- this is a quick technique allowing for reproducible method for monitoring serial change in liver fat estimation.Conclusion
In populations with grade 0 steatosis, liver fat is uniformly distributed among the different Couinaud segments and between the two lobes.Mean hepatic fat content in normal Indian population calculated by MR PDFF is 2.89% (95%CI, 1% - 6.8%). The least significant change of liver fat that can be measured reliably using MR imaging-PDFF is 2.1%.Acknowledgements
No acknowledgement found.References
1. Hamer OW, Aguirre DA, Casola G, Lavine JE, Woenckhaus M, Sirlin CB. Fatty liver: imaging patterns and pitfalls. Radiographics. 2006;26(6):1637-53.
2. Idilman IS, Keskin O, Celik A, Savas B, Halil Elhan A, Idilman R, Karcaaltincaba M. A comparison of liver fat content as determined by magnetic resonance imaging-proton density fat fraction and MRS versus liver histology in non-alcoholic fatty liver disease. Acta Radiol. 2016;57(3):271-8.
Figures