2579
Non-alcoholic Fatty Liver Disease Assessment in Obese and Non-obese Pregnant Women with Water-Fat MRI1Medical Biophysics, Western University, London, ON, Canada, 2Division of Maternal, Fetal and Newborn Health, Children's Health Research Institute, London, ON, Canada, 3Obstetrics and Gynecology, Kagoshima City Hospital, Kagoshima, Japan, 4Obstetrics and Gynaecology, Western University, London, ON, Canada
Synopsis
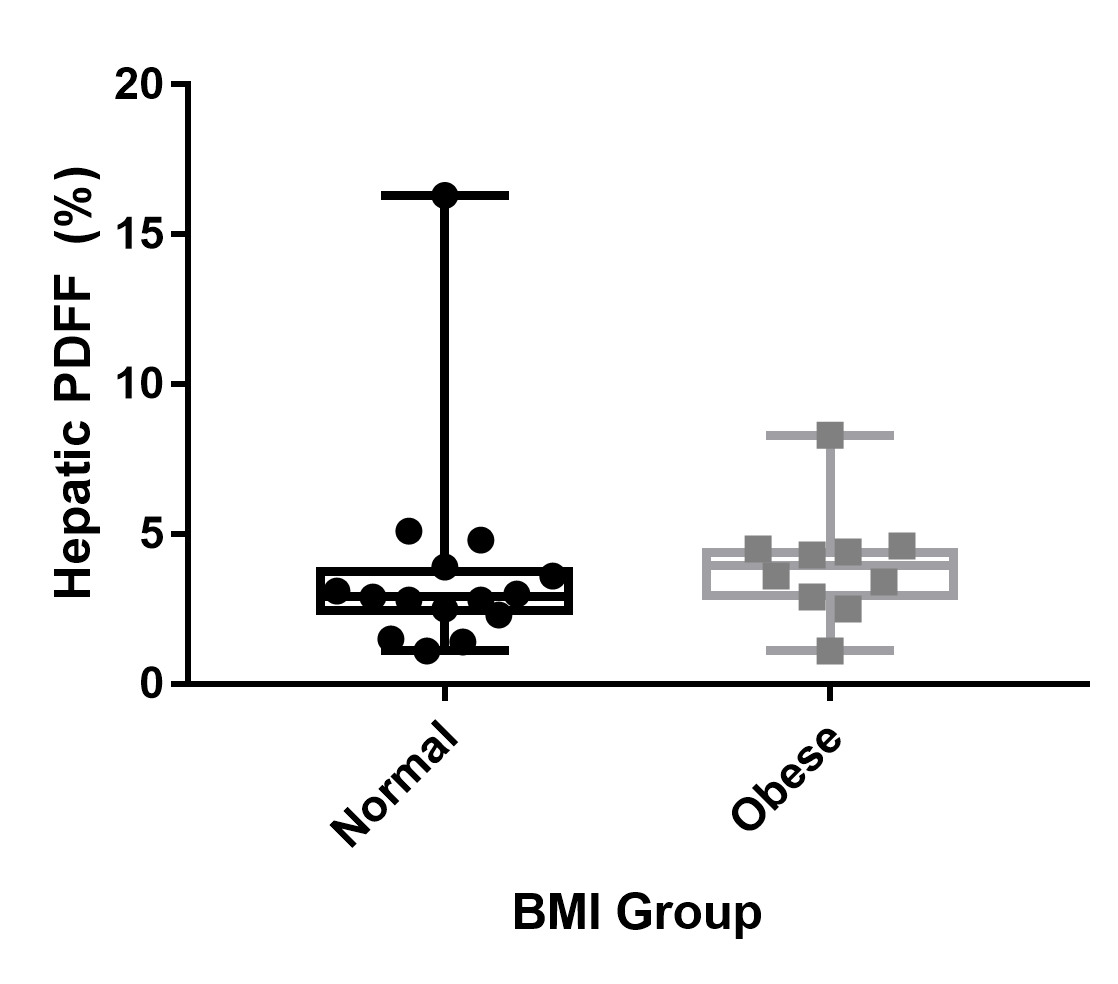
Proton density fat fraction (PDFF) was used to assess fatty liver of pregnant women with normal and obese body mass indexes (BMI). No significant difference was found in the mean hepatic PDFF between the two groups (p=0.28). One normal BMI woman and one obese woman had elevated hepatic PDFF measurements.
Introduction
Assessment of metabolic health during pregnancy is indicative of the future health of both the mother and fetus. Early manifestations of metabolic syndrome, the collective group of diseases caused by abnormal metabolism and inflammation (diabetes, obesity, cardiovascular disease), are observed in pregnancy through complications such as gestational diabetes and preeclampsia and are associated with a future risk of metabolic syndrome. Non-invasive techniques to investigate maternal health and early signs of abnormal metabolism during pregnancy can help clinicians improve management of pregnancies at risk for these adverse outcomes.
Non-alcoholic fatty liver disease (NAFLD) is the most common liver disease in the world, and is considered part of the metabolic syndrome. In non-pregnant Caucasian women, the age-adjusted prevalence of NAFLD ranges from 6.5% with normal body mass index (BMI) to 25.3-47.5% in women with obesity1. Approximately 29% of women of reproductive age are obese2, suggesting that a large portion of the pregnant population may be affected by NAFLD. A pre-pregnancy diagnosis of NAFLD is associated with an increased risk of gestational diabetes, pre-eclampsia, Caesarean section, low birth weight and preterm birth3.
Proton density fat fraction (PDFF) is an imaging biomarker of the tissue lipid concentration4, and has been found to have high precision and accuracy for quantification of hepatic steatosis5. It is often referred to as the imaging gold standard for assessment of fatty liver. The objective of this study was to compare the mean hepatic PDFF in a group of pregnant women with normal pre-pregnancy BMI to a group of women with pre-pregnancy BMI in the obese range. We hypothesized that due to a greater expected prevalence in the obese group, the mean hepatic PDFF of the obese group would be greater than that of the normal BMI group.
Methods
Volunteers with singleton pregnancies and gestational ages between 29 and 38 weeks were imaged in a wide-bore (70 cm) 1.5T MRI (GE MR450w). 3D water-fat MRI (specific implementation: Quantitative IDEAL, TR 9.7-12.7 ms, flip angle 6-7°, Field of View 50 cm, 160×160 or 128×128 pixels, slice thickness 4-6.5 mm, 42-78 slices, ARC acceleration 2x phase 2.5x slice and 32x32 calibration lines, acquisition time 12-24 s) was used to image maternal liver during breath hold. Volunteers were divided into a normal weight group (18 kg/m2 < pre-pregnancy BMI ≤ 25 kg/m2) and an obese group (pre-pregnancy BMI ≥ 30 kg/m2). A 10 mm region of interest was placed in a vessel-free region of the lower right lobe of the liver using 3D Slicer (v4.7.0-2016-12-06)6. The mean PDFF was measured and compared between normal weight and obese groups using a Mann-Whitney test in GraphPad Prism (v7.03).Results
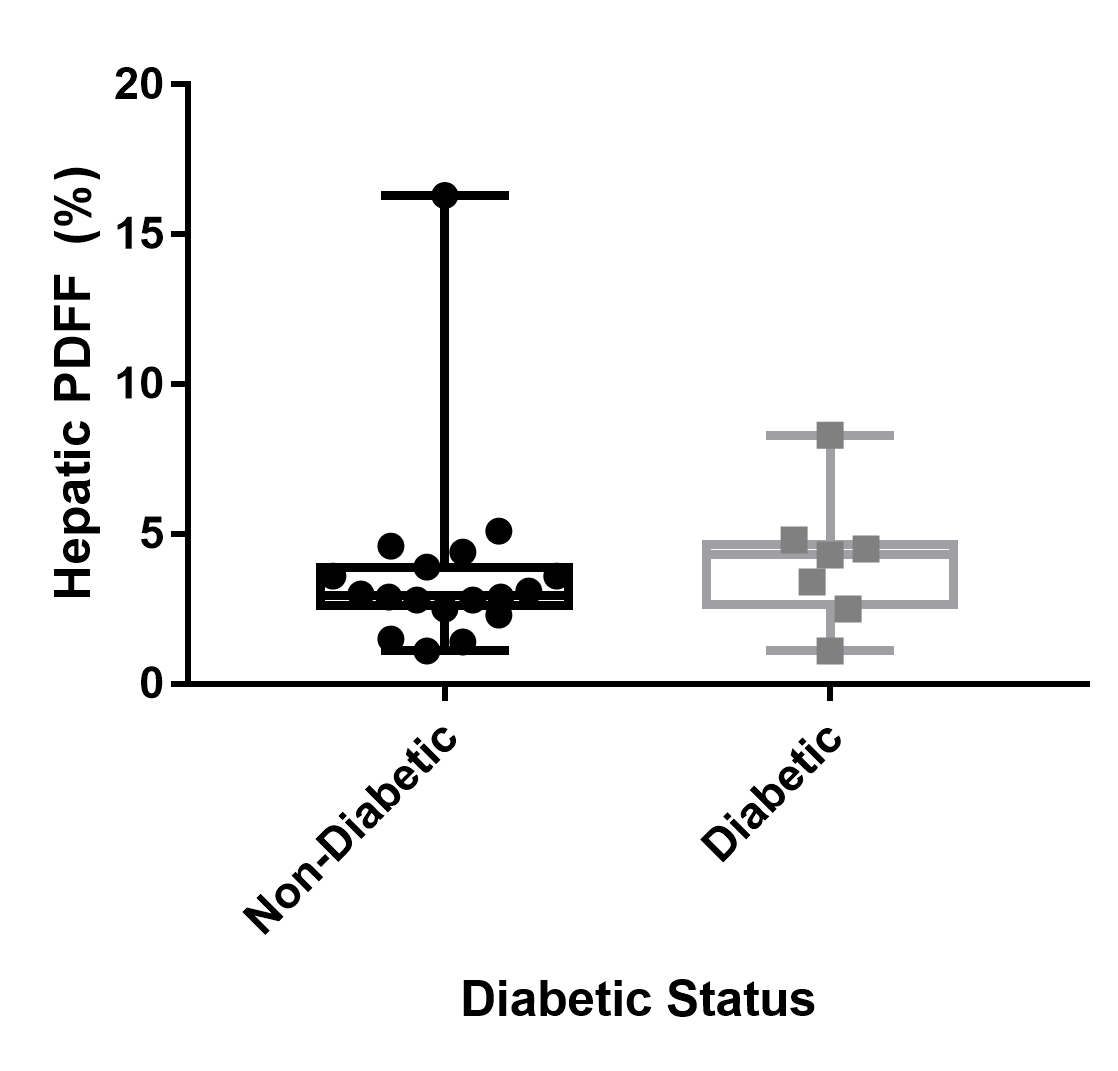
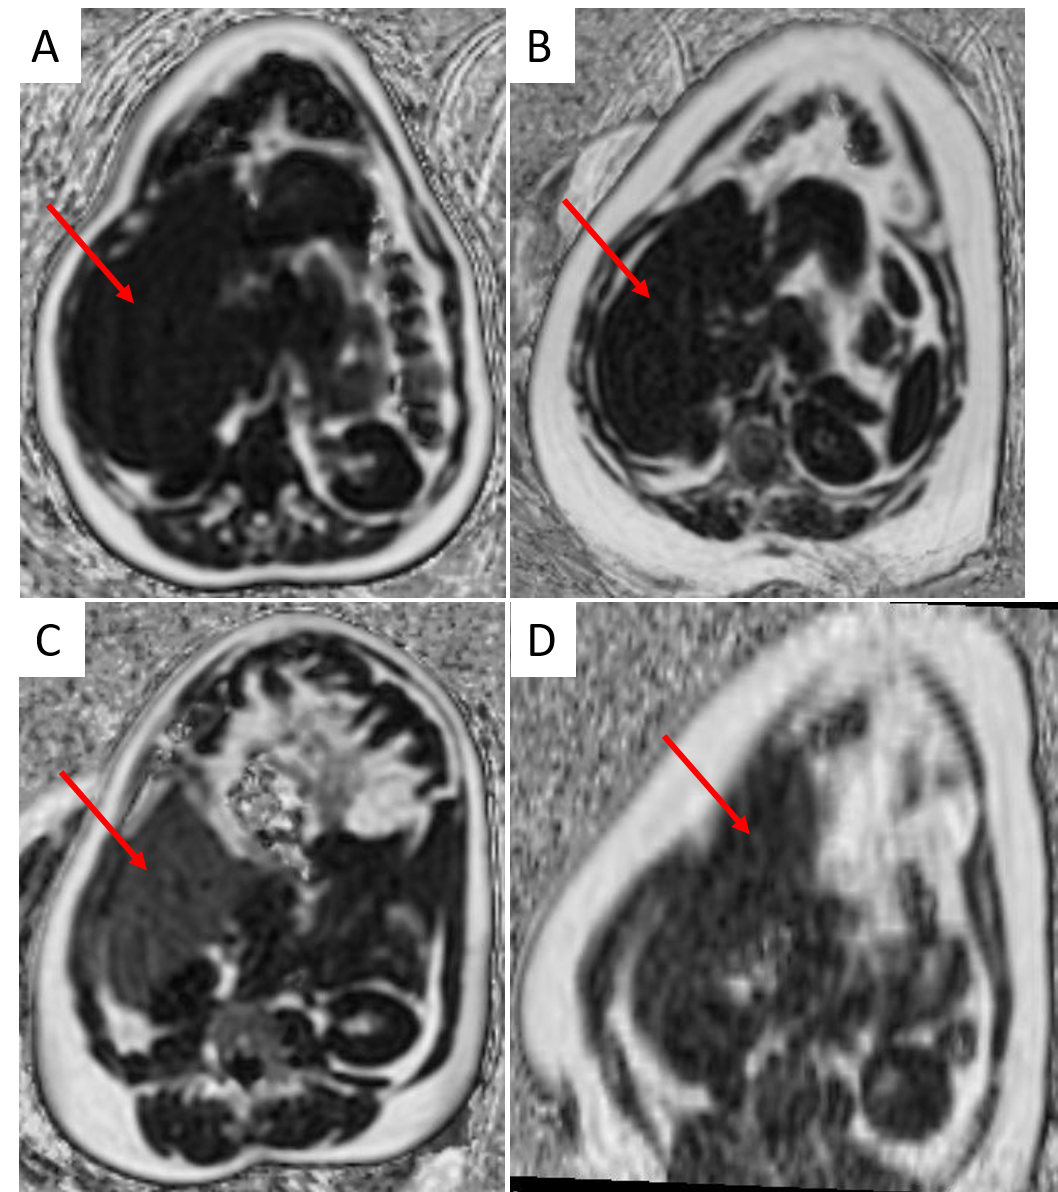
25 women participated in the study and had pre-pregnancy BMI ranging from 18.8 – 42.9 kg/m2 and had their MRI between 29 and 37 weeks GA. Fifteen women had a normal BMI, and 10 women were obese. One normal BMI and five obese women had gestational diabetes, and one obese woman had type 2 diabetes. The Mann-Whitney test did not show a significant difference of mean hepatic PDFF between the normal BMI and obese groups (p=0.28) (Figure 1), nor were there differences between diabetic and non-diabetic pregnancies (p=0.38) (Figure 2). One woman in the normal BMI group (BMI=23.7 kg/m2) had a mean hepatic PDFF of 16% (Figure 3C), consistent with patients that have moderate NAFLD7. One woman in the obese group (BMI=37.3 kg/m2) had a mean hepatic PDFF of 8% (Figure 3D), consistent with patients that have mild NAFLD7.Discussion
We did not see a difference in the mean hepatic PDFF between the normal BMI and obese groups, or between non-diabetic and diabetic groups. We did see one woman within each group that had PDFF values consistent with mild-moderate fatty liver7. We expect a prevalence of 25.3-47.5% in the obese non-pregnant population, and therefore it is surprising that we saw a prevalence of 1 in 10 in our obese pregnant group. The prevalence of NAFLD may be lower than previously described using ultrasound techniques due to ameliorating effects of nutrition partitioning in pregnancy, lifestyle changes in obese pregnant patients or a selection bias towards metabolically healthy women who are more likely to conceive.Conclusion
In conclusion, the mean hepatic PDFF was not elevated in a sample of obese pregnant women compared to those with a normal BMI.Acknowledgements
Grant support from the Children’s Health Research Institute, Natural Sciences and Engineering Research Council of Canada, Canadian Institutes of Health Research and General Electric.References
(1) Lazo, M., et al. Am J Epidemiol 2013;178(1):38-45. (2) Hedley, A.A., et al. JAMA 2004;291(23):2847-2850. (3) Hagstrom, H., et al. Liver Int 2016; 36(2):268-274. (4) Reeder, S.B., et al. J Magn Reson Imaging 2012;36(5):1011-1014. (5) Hines, C.D., et al. J Magn Reson Imaging 2011;33(4):873-881. (6) Federov, A., et al. Magn Reson Imaging 2013;30(9):1323-1341. (7) Kuhn, J.P., et al. Radiology 2017;284(3):706-716.Figures