2578
In Vivo MRI Monitoring of the Induction and Reversal of Non-Alcoholic Steatohepatitis in a Rat Model1Perspectum Diagnostics Ltd, Oxford, United Kingdom, 2Neuroimaging, King's College London, London, United Kingdom
Synopsis
Steatosis and steatohepatitis (NASH) may be attenuated by calorie restriction and/or exercise if intervention is early enough. However, steatosis/NASH is generally asymptomatic, and when clinical signs are observed, simple lifestyle interventions are no longer effective. Thus, there is a real clinical need to detect steatosis/NASH early but also to monitor putative therapies. A methionine-choline-deficient diet leads to NASH in rats, that is readily reversible when rats are placed back on a methionine-choline replete diet. This model will be used to assess the ability of MRI to detect the induction of, and reversal of steatosis, in vivo.
Introduction
Non-alcoholic fatty liver disease (NAFLD) encompasses steatosis and steatohepatitis (NASH) which may progress to cirrhosis and liver failure. Exact mechanisms of steatosis and NASH remains elusive but are regarded as a hepatic manifestation of the metabolic syndrome1 and attenuated by calorie restriction and/or exercise. Usually asymptomatic, when clinical signs are observed though, such simple lifestyle interventions are no longer effective. Thus, there is a real clinical need to detect steatosis/NASH early and MRI may play a vital role2, especially as NAFLD is the most common chronic liver disease3. Further, non-invasive methods of detecting steatosis/NASH are vital to develop and translate novel treatment strategies. A methionine-choline deficient diet (MCD) leads to NASH in rodents, with NASH being readily reversible when rodents go back onto a methionine-choline replete diet4. We will determine the ability of MRI to monitor the induction of, and recovery from NAFLD in vivo, in a rat model.Methods and Materials
Animals and Treatments: Female Wistar rats (n = 20, 170 - 195g, Harlan UK) were obtained and acclimatized prior to allocation to two groups of 10: MCD-NC, MCD for 30 days + normal chow (NC) for 30 days; and MCD-MCD, MCD for 60 days. Animals underwent MRI prior to the MCD diet (timepoint 0, t0), at 30 days (t1, prior to diet reversal in the MCD-NC group), and at the end of the study (t2).
MRI: Acquisition - Isoflurane-oxygen anaesthesia was induced in rats and maintained during MRI on a 7.0 T MRI scanner (Agilent Technologies, CA, USA) with a 72 mm ID coil. At each time point, two gradient-echo (GRE) scans were ran (TR 75 ms, 4 averages, flip angle 20o); for one scan, with 4 in-phase echoes (1.01, 2.02, 3.03, 4.04 ms) and the other, 4 out-of-phase echoes, (1.52, 2.53, 3.54, 4.55 ms). All scans were respiratory-gated with a FOV 60 mm × 60 mm, 2 mm thick axial single slice (positioned to include primarily liver) and 128 x 128 matrix. Analysis - Proton density fat fraction (PDFF) maps were calculated using the extended 3-point Dixon approach5. PDFF maps were calculated from fat (F) and water (W) maps: PDFF = F /(F + W). Regions of interest (ROI) were placed in the PDFF maps to give fat percentages in the ROIs.
In vitro Liver Assessments: Histopathology - Oil-red-O (ORO) and haematoxylin-eosin staining were performed for steatosis and inflammation, and NASH scores estimated. Liver biochemistry - Triglycerides and non-esterified fatty acids were extracted from liver samples and measured.
Statistical Testing: Student’s T-test was used to test for differences in liver histopathology and biochemistry. Two-way ANOVA was used to test for differences between the dietary groups at the different time-points.
Results
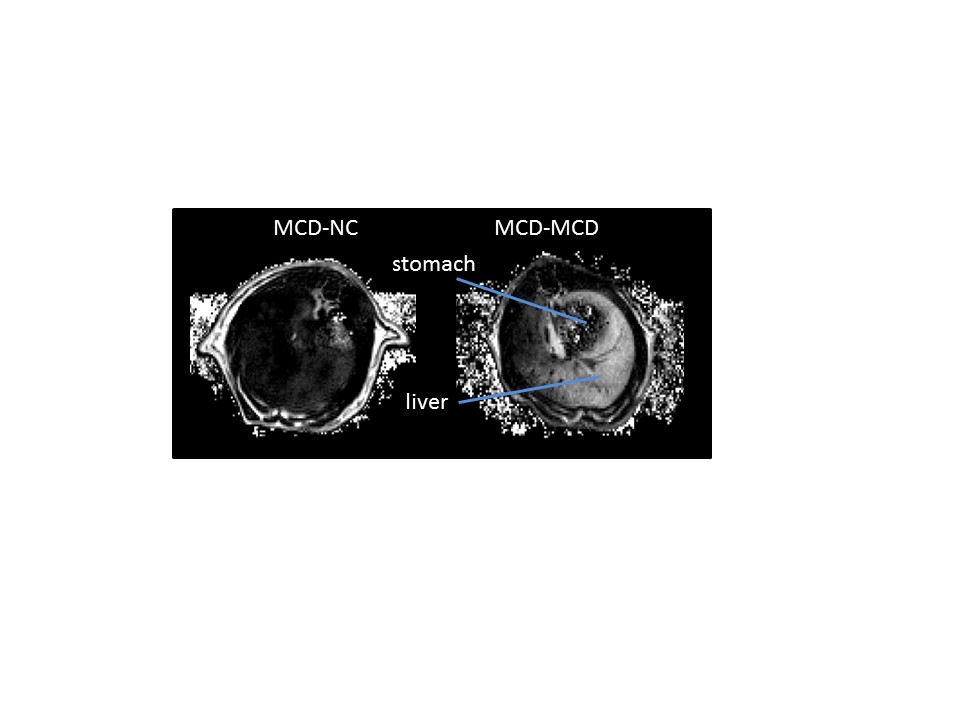
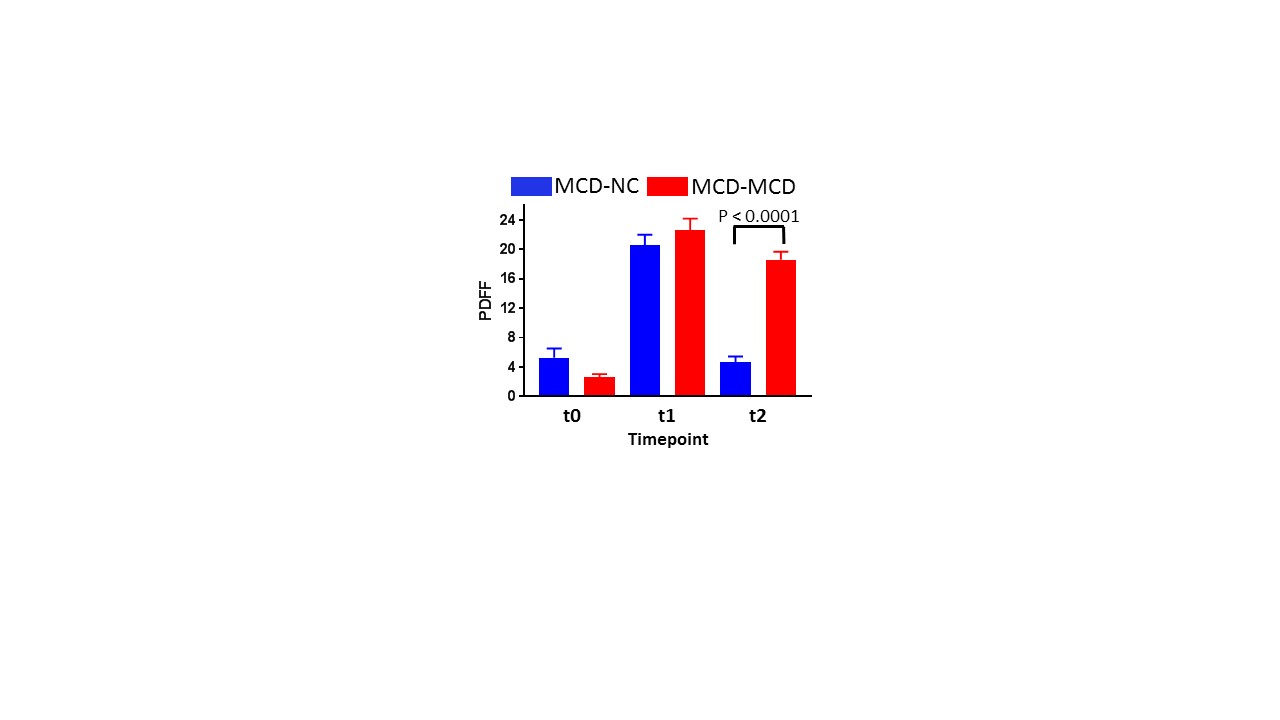
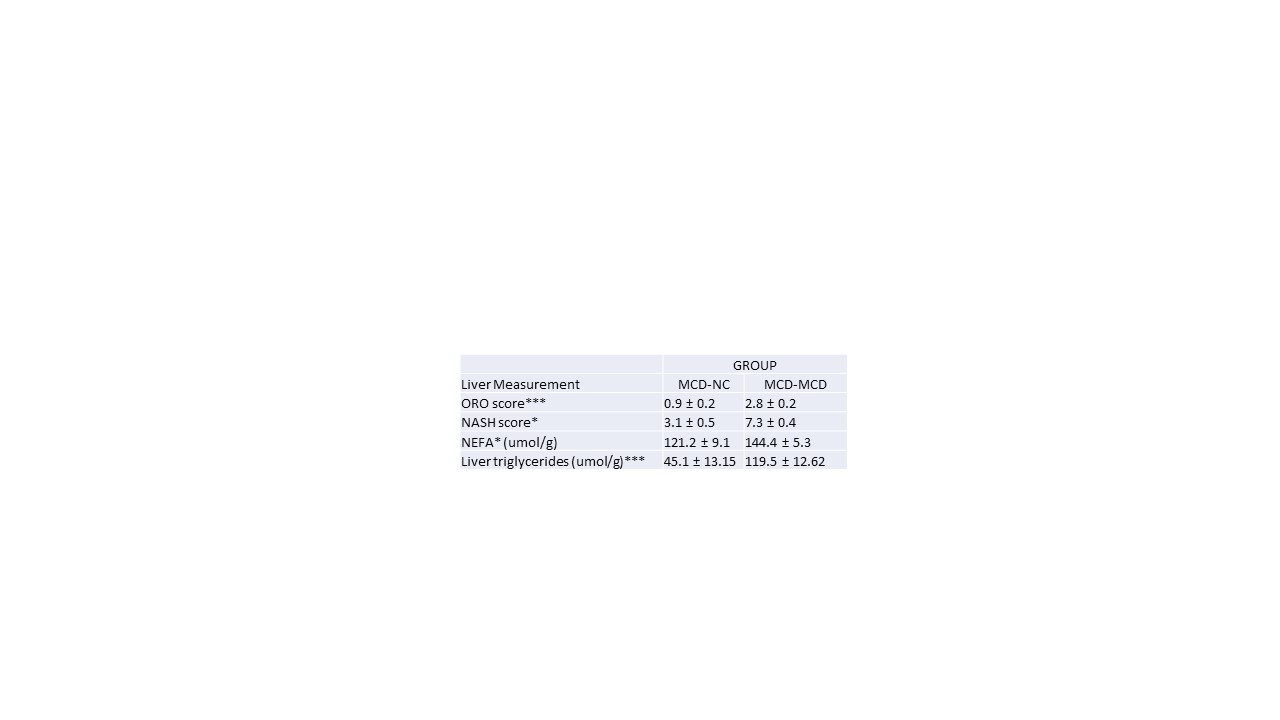
Steatosis was evident in the MCD-MCD group but not in the MCD-NC group at the end of the study, and clearly steatosis is not homogenous in the liver (Fig. 1). PDFF were similar in MCD-MCD and MCD-NC at t0 and t1 (Fig. 2). On reversion to a NC diet, the MCD-NC group had a lower PDFF than the MCD-MCD group at t2 (Fig. 2). Steatosis/NASH at t2 was confirmed in the MCD-MCD group by liver histopathology and biochemistry (Table 1), consistent with the MRI data.Discussions
We have shown that MRI is able to detect induction and recovery from steatosis in a rat model of NAFLD, demonstrating the feasibility of in vivo MRI to monitor hepatocellular infiltration in vivo. Also, MRI shows that steatosis is clearly not homogenous throughout the liver in NAFLD. Thus, whilst analysis of liver biopsies is still considered the “gold standard” to assess NAFLD, biopsy results are inevitably biased by sampling location.Conclusion
MRI is likely to play an important role in screening steatosis in man but also for monitoring the effects of putative disease-attenuating treatments in models of NAFLD.Acknowledgements
The authors would like to thank the British Heart Foundation for funding the preclinical MRI scanner used in this study.References
1Marchesini G et al. Hepatology 2003; 37: 917-923.
2Reeder
SB and Sirlin C (2010). Magn Reson Imag Clin. N Am, 18(3): 337-357.
3Neuschwander-Tetri
BA. Curr Opin Gastroenterol 2007; 23: 193-198.
4Mu YP et al (2010).
Lab Invest., 90: 245-56.
5Glover GH and
Schneider E. Magn. Reson. Med 1991; 18: 371-383.
Figures