2577
Multiparametric MRI methods development for clinical prostate imaging at 7T1University of Minnesota, Minneapolis, MN, United States, 2Radiology, University of Minnesota, Minneapolis, MN, United States
Synopsis
The advantages of increased SNR drive the spread of applications to 7T. While methods and hardware continue to improve, the potential to perform a full multiparametric exam exploiting the advantages of ultrahigh magnetic fields becomes possible but has yet to be investigated. We explore a full MRI exam including anatomic, diffusion and dynamic contrast enhanced MRI (DCEMRI) methods at 7T and compare them against 3T acquisitions in a patient population with various coil configurations: surface coils and surface combined endorectal coils.
Introduction
While some exploration of anatomic imaging has been demonstrated to benefit from the increased SNR at 7T, a complete multiparametric investigation of prostate imaging has not yet been performed). In this work, we present a complete protocol for prostate investigations at 7T including anatomic, diffusion weighted imaging (DWI) and dynamic contrast enhanced (DCE-MRI) studies. The acquisition protocols have evolved to address the many challenges of increased local SAR and susceptibility issues while taking advantage of advances in RF coil technology and sequence developments.Methods
Imaging studies were performed on 8 patients with biopsy proven prostate cancer at both 3T and 7T after providing written signed consent to participate in an IRB approved protocol. Surface arrays alone and surface arrays combined with ERCs were investigated at both field strengths. At 3T, an optimized prostate protocol and commercial coils were used. At 7T MRI experiments were conducted on a Magnetom 7.0T scanner (Siemens Healthcare, Erlangen, Germany) equipped with sixteen 1kW power amplifiers. A 16 channel loop-dipole transceiver array was used for all studies at 7T(1) using local B1+ shimming(2) for B1+ optimization. For ERC studies a balloon-type channel balloon-type coil was used at 3T and a solid two-channel coil was used at 7T(3,4). The sequences for the anatomic and function studies evolved over the course of this study, culminating in the parameters provided in Table 1. These sequences in Table 1 are configured for use with an ERC. When not using an ERC, the field of view and slice thicknesses are increased. These are reported where relevant in the results. Anatomic imaging was performed with standard fast spin echo imaging while the limits of spatial resolution were explored given available SNR. At 3T, SAR mitigation required reducing the refocusing flip angle and at 7T hyper-echoes were used(5). DWI at 3T used a 2D RF excitation to reduce imaging distortion in place of parallel imaging, reducing both echo times and artifacts from aliasing due to respiration and poorly suppressed fat. At 7T these methods are not yet available however, the use of anterior and posterior regional saturation pulses (i.e. referred to as Reg. Sat. in Table 1) functioned similarly. DCEMRI required additional considerations including the dramatic field strength dependent increase in R2* in the blood and even tissue during bolus passage of paramagnetic contrast agents(6) which have been shown to cause underestimation of pharmacokinetic parameters(7). At 3T, relatively standard gradient echo acquisitions can be used. However, at 7T, a 3D radial acquisition (2D radial, 1D phase encoded) UTE acquisition was employed. The 3T acquisition used standard reconstruction methods employing both GRAPPA and CAIPRAINA. The 7T acquisition used a compressed sensing reconstruction with a total variation sparsifying transform. Initial studies were performed to show equivalence of 3T and 7T while later studies aimed at pushing the limits.Results
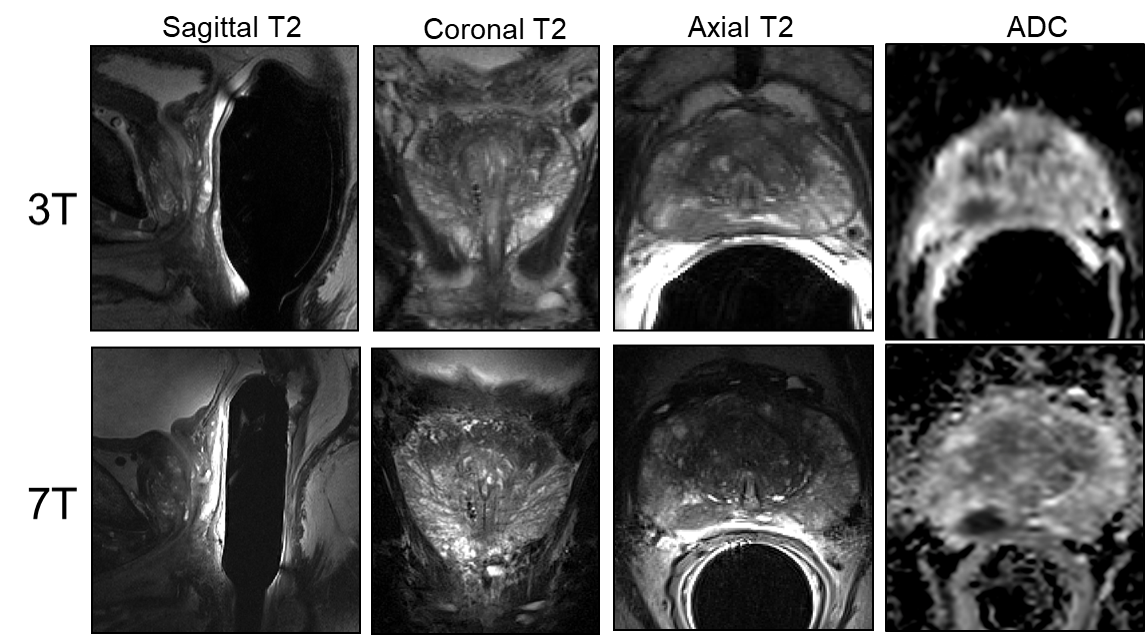
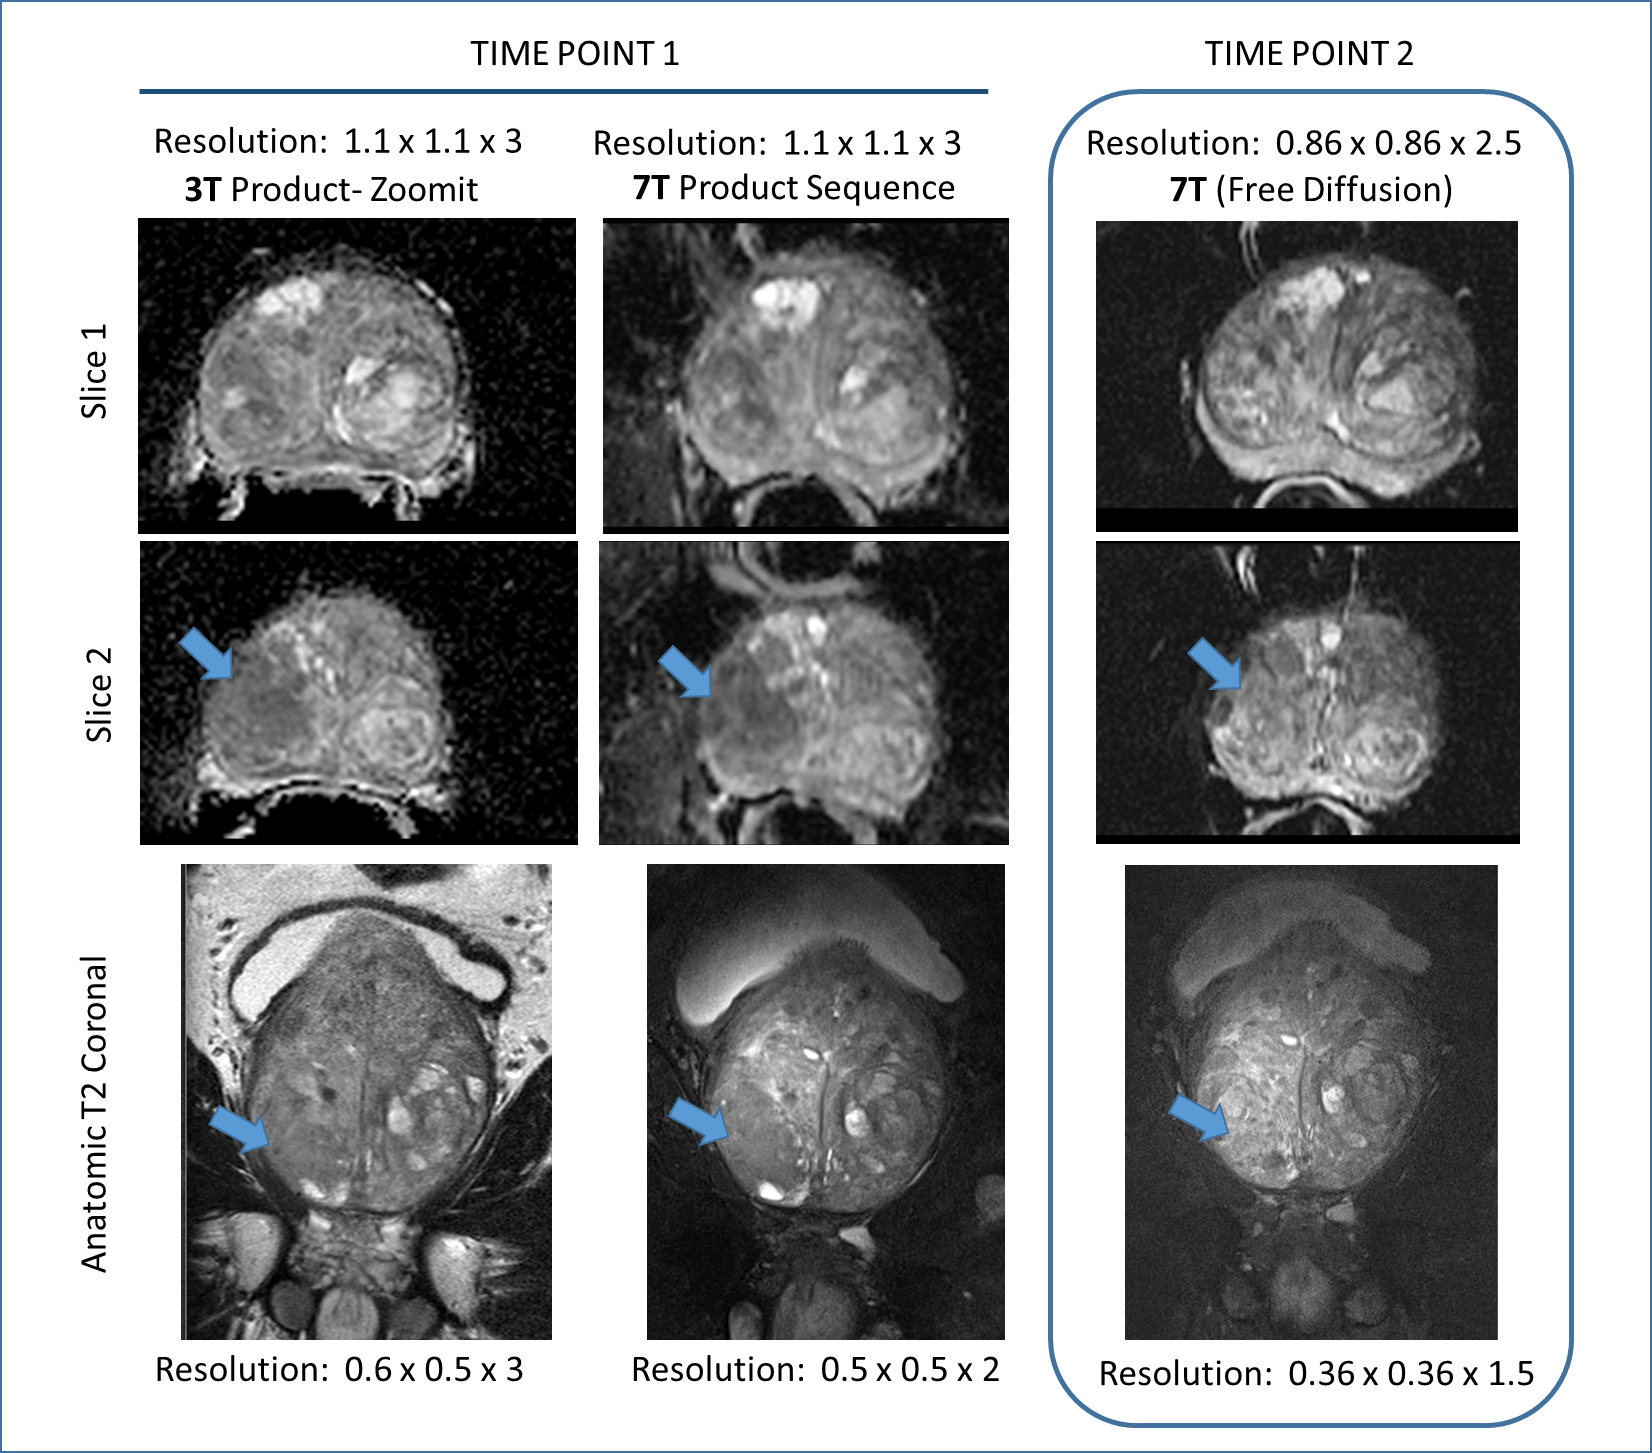
A comparison of the T2w FSE acquisitions in the same patient at 3T and 7T both acquired with a surface coil, Figure 1. A second patient is shown in Figure 2 where both 3T and 7T images were acquired with ERCs. The anatomic and diffusion data acquisitions were performed with suboptimal protocols while the DCEMRI was acquired with the acquisition detailed in Table 1. The higher in-plane and through-plane resolution are supported by increased SNR at 7T. A third patient is shown in Figure 3 where the highest resolution anatomic images were explored following the protocol in Table 1. The nominal voxel size in the 7T data is 5 times smaller than the 3T imaging series. The diffusion data, while diagnostic at 7T was performed using standard methods. Figure 4 shows a study where a patient on active surveillance was imaged at 3T and 7T prior to the optimization of protocols. A year later, they came back for a 7T study at which time the anatomic and DWI protocol in Table 1 were available. Equivalence was shown in time point 1 providing confidence in interpretation of the time point 2 images which showed resolution of a susupicious region on T2 and ADC.Discussion / Conclusion
Several patients have been acquired as in Figure 1, with matching scan parameters. This was an important step as diagnostic equivalence was being explored. As we continued to develop the methods (i.e. DCEMRI in figure 2, anatomic imaging in figure 3 and DWI in Figure 4) a final protocol has emerged which can allow us to identify in what ways 7T is able to provide superior imaging quality. The current task which is under investigation is to understand if this improved image quality has added clinical value.Acknowledgements
Supported by: NIBIB P41 EB015894, NCI R01 CA155268References
1. Erturk MA, Raaijmakers AJ, Adriany G, Ugurbil K, Metzger GJ. A 16-channel combined loop-dipole transceiver array for 7 Tesla body MRI. Magn Reson Med 2016.
2. Metzger G, Van de Moortele PF, Snyder C, Vaughan JT, Ugurbil K. Local B1 Shimming for Imaging the Prostate at 7 Tesla. Proc Intl Soc Magn Reson Med 2007;15:799.
3. Erturk MA, Tian J, Van de Moortele PF, Adriany G, Metzger GJ. Development and evaluation of a multichannel endorectal RF coil for prostate MRI at 7T in combination with an external surface array. J Magn Reson Imaging 2015.
4. Erturk A, Metzger GJ. Prostate MRI at 7.0 Tesla Using an Actively-Tuned Endorectal Coil. Proc Intl Soc Mag Reson Med 2016;24:3501.
5. Hennig J, Scheffler K. Hyperechoes. Magn Reson Med 2001;46(1):6-12.
6. Kalavagunta C, Michaeli S, Metzger GJ. In vitro Gd-DTPA relaxometry studies in oxygenated venous human blood and aqueous solution at 3 and 7 T. Contrast media & molecular imaging 2014;9(2):169-176.
7. Metzger GJ, Bolan P. Influence of contrast-dependent T2* effects on DCE-MRI of the prostate at 7T. Proc Intl Soc Mag Reson Med 2009;17:#5920.
Figures
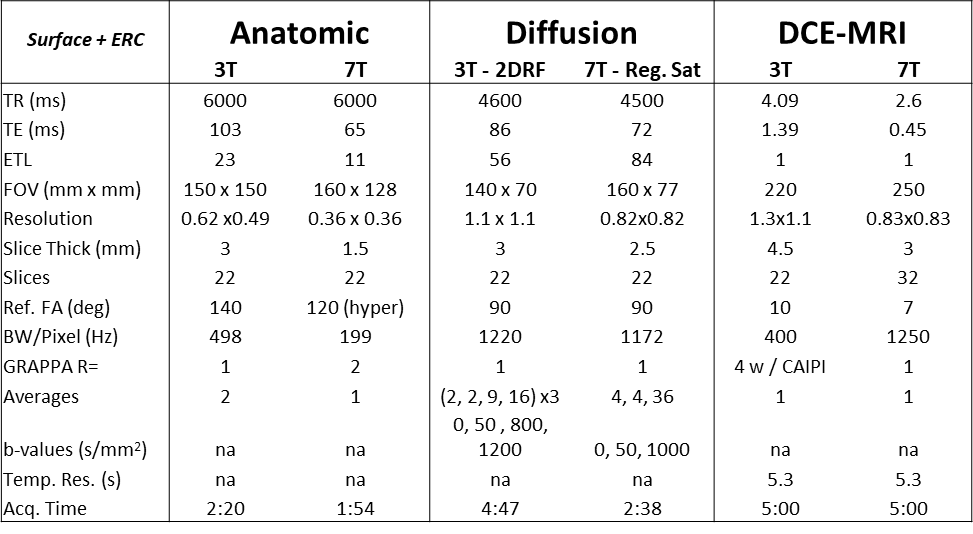
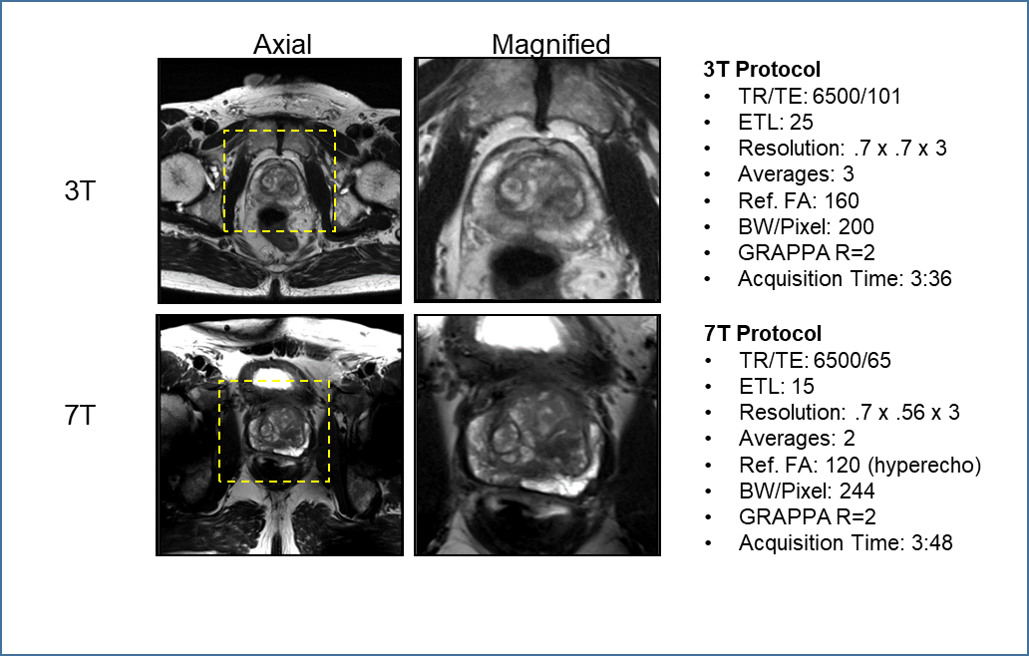
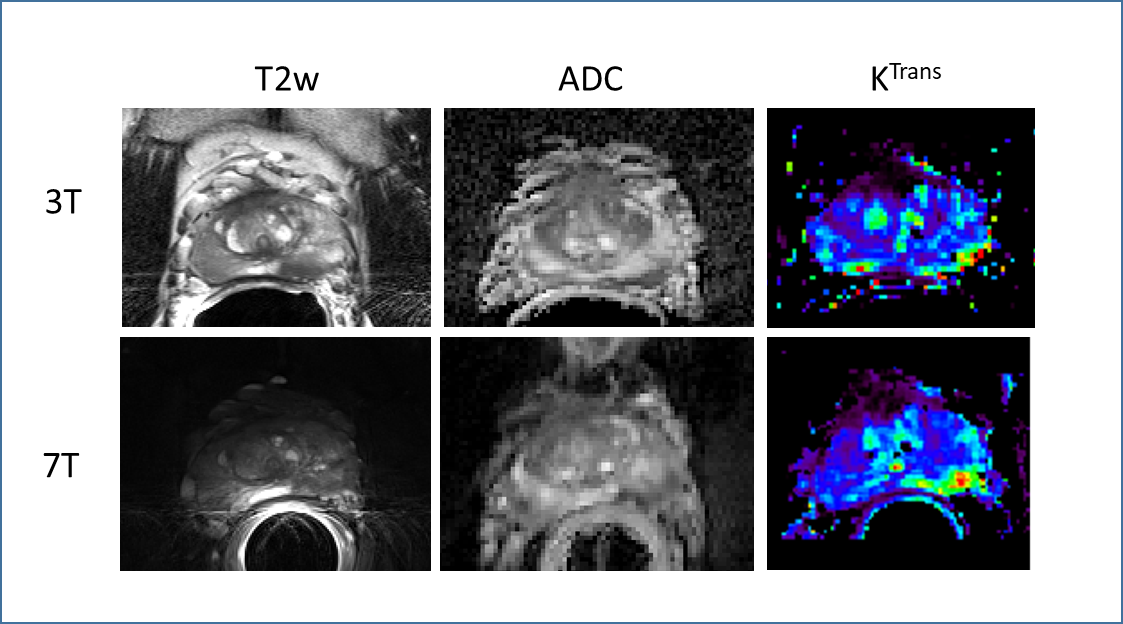
Figure 2: Multiparametric study comparison between ERC studies acquired at 3T and 7T on the same patient. The DCEMRI acquisition is following the protocol detailed in Table 1 and the increased resolution and SNR at 7T is evident in the improved delineation of the cancer in the left peripheral zone ofthe Ktrans map. While the anatomic and diffusion data show similar results at both field strengths the 7T protocols are sub optimal (i.e. not those detailed in Table 1).