2573
Correlation of Perfusion Parameters Between Intravoxel Incoherent Motion Diffusion-Weighted Imaging and Texture Analysis of Dynamic Contrast Enhancement Imaging for Diagnosis of Prostate Cancer in Central Zone and HyperplasiaDan Guo1, Ailian Liu1, Lihua Chen1, and Lizhi Xie2
1Radiology Department of The First Affiliated Hospital of Dalian Medical University, Dalian, China, 2GE Healthcare, MR Research China, Beijing, Beijing, China
Synopsis
This work assessed the diagnostic value of intravoxel incoherent motion diffusion-weighted (IVIM-DWI) and texture analysis of dynamic contrast enhancement (DCE) in prostate cancer in central zone(CZ) and hyperplasia and the correlation of perfusion parameters of them.
Synopsis
This work assessed the diagnostic value of intravoxel incoherent motion diffusion-weighted (IVIM-DWI) and texture analysis of dynamic contrast enhancement (DCE) in prostate cancer in central zone(CZ) and hyperplasia and the correlation of perfusion parameters of them.The result showed that DCE texture features and IVIM model parameters can differentiate prostate cancer in CZ from hyperplasia. D*-mono derived from IVIM model which reflects the perfusion characteristics had the weak positive correlation with the energy and quantile10 of Kep value.Purpose
To assess the diagnostic value of IVIM-DWI and texture analysis of DCE in prostate cancer in CZ and hyperplasia and the correlation of perfusion parameters of them.Introduction
Prostate cancer usually occurs in the peripheral zone, but there are still a part of them occuring in the central zone, which are difficult to be distinguished from benign prostatic hyperplasia.Texture analysis, as a new imaging analysis method, can describe the imaging features more subtly, and has been applied in many other diseases.DCE reflects the distribution of microvessel and blood perfusion condition of tissue[1].The IVIM-DWI model reflects the perfusion information of tissue when the b value is small and the diffusion of water molecules when the b value is large[2].Since they both reflect the perfusion information,it is worth studying the correlation of perfusion parameters between them.Material and Methods
55 patients with histologically confirmed prostate cancer in CZ (26) and hyperplasia (29) underwent IVIM-DWI and DCE-MRI.The IVIM-DWI was performed with 10 b values(b=20、50、100、150、200、400、800、1200、2000、3000s/mm2 ) to calculate the values of D-mono,D*-mono,F-mono,D-bi,D*-bi,F-bi. Measured and recorded the texture features of DCE-MRI by using the Omni-Kinetics software(GE Healthcare),including skewness,kurtosis,energy, entropy, quantile5,10,25,50,75,90,95 of Ktrans,Kep and Ve. All parameters between prostate cancer and hyperplasia were compared by two independent sample T-test.The correlation of perfusion parameters between the two methods was analyzed by Pearson correlation test.The diagnostic performance of different parameters was evaluated by receiver operating characteristic (ROC) curve analysis.Results
The D*-mono of prostate cancer was significantly higher than that of hyperplasia(P<0.05), the D-mono and F-mono of prostate cancer were lower than that of hyperplasia((P<0.05).The quantile 10,25,90,95 of Ktrans, the quantile 10,25,50,75,90,95 and energy of Kep, the skewness of Ve were significantly higher than that of hyperplasia(P<0.05). The kurtosis of Ktrans, the entropy of Kep and the kurtosis of Ve were lower than that of hyperplasia((P<0.05). D*-mono had correlation with the energy and quantile10,25,50 of Kep(r=0.345,0.309,0.299,0.273 respectively). The area under the ROC curve of the quantile 75 of Kep diagnosing prostate cancer is 0.745,with 61.5% diagnostic sensitivity and 86.2% specificity. The area under the ROC curve of F-mono diagnosing hyperplasia is 0.992,with 100.0% diagnostic sensitivity and 92.3% specificity.Discussion and Conclusion
Both IVIM-DWI model and DCE texture features can improve the differential diagnosis of prostate cancer in CZ and hyperplasia,especially the quantile 75 of Kep and F-mono. D*-mono had weak positive correlation with the energy and quantile10,25,50 of Kep ,which means the perfusion information of tissue may be acquired from two completely different MRI methods.Acknowledgements
No acknowledgement found.References
[1]Cornud F,Beuvon F,Thévenin F,et al.Quantitative dynamic MRI and localization of non-palpable prostate cancer.Prog Urol,2009,19:401-413.
[2]Vargas HA,Akin O,Franiel T,et al.Diffusion-weighted endorectal MR imaging at 3 T for prostate cancer:tumor detection and assessment of aggressiveness.Radiology, 2011,259:775-784.
Figures
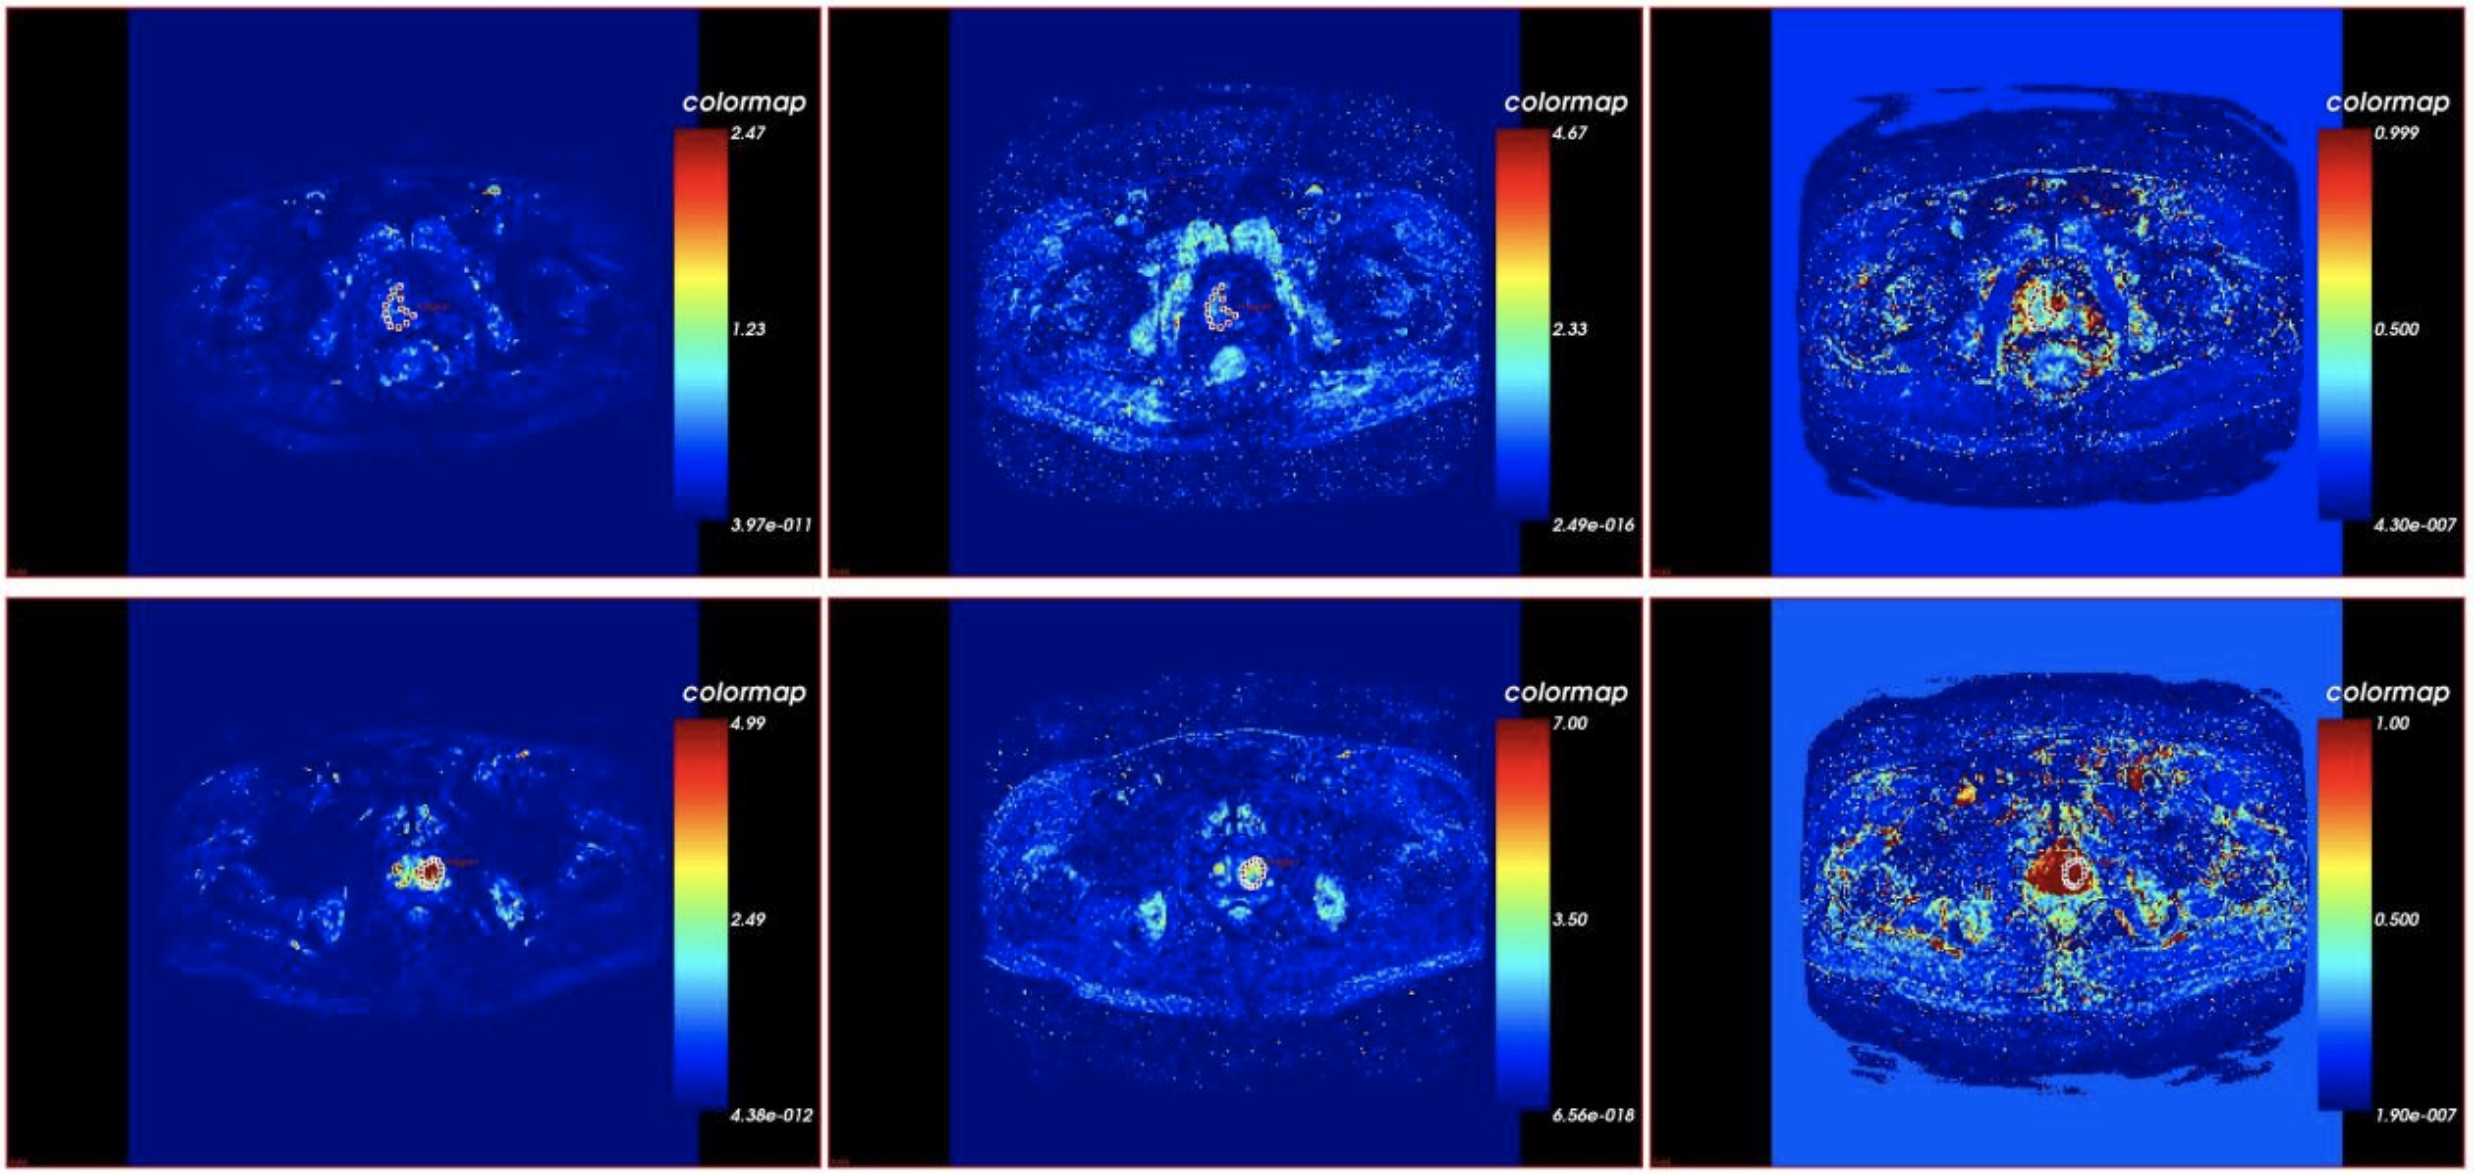
Figure 1. The three pictures from the left to the right in the first line are Ktrans,Kep,Ve pcolor of prostate cancer in CZ. The three pictures from the left to the right in the second line are Ktrans,Kep,Ve pcolor of hyperplasia.
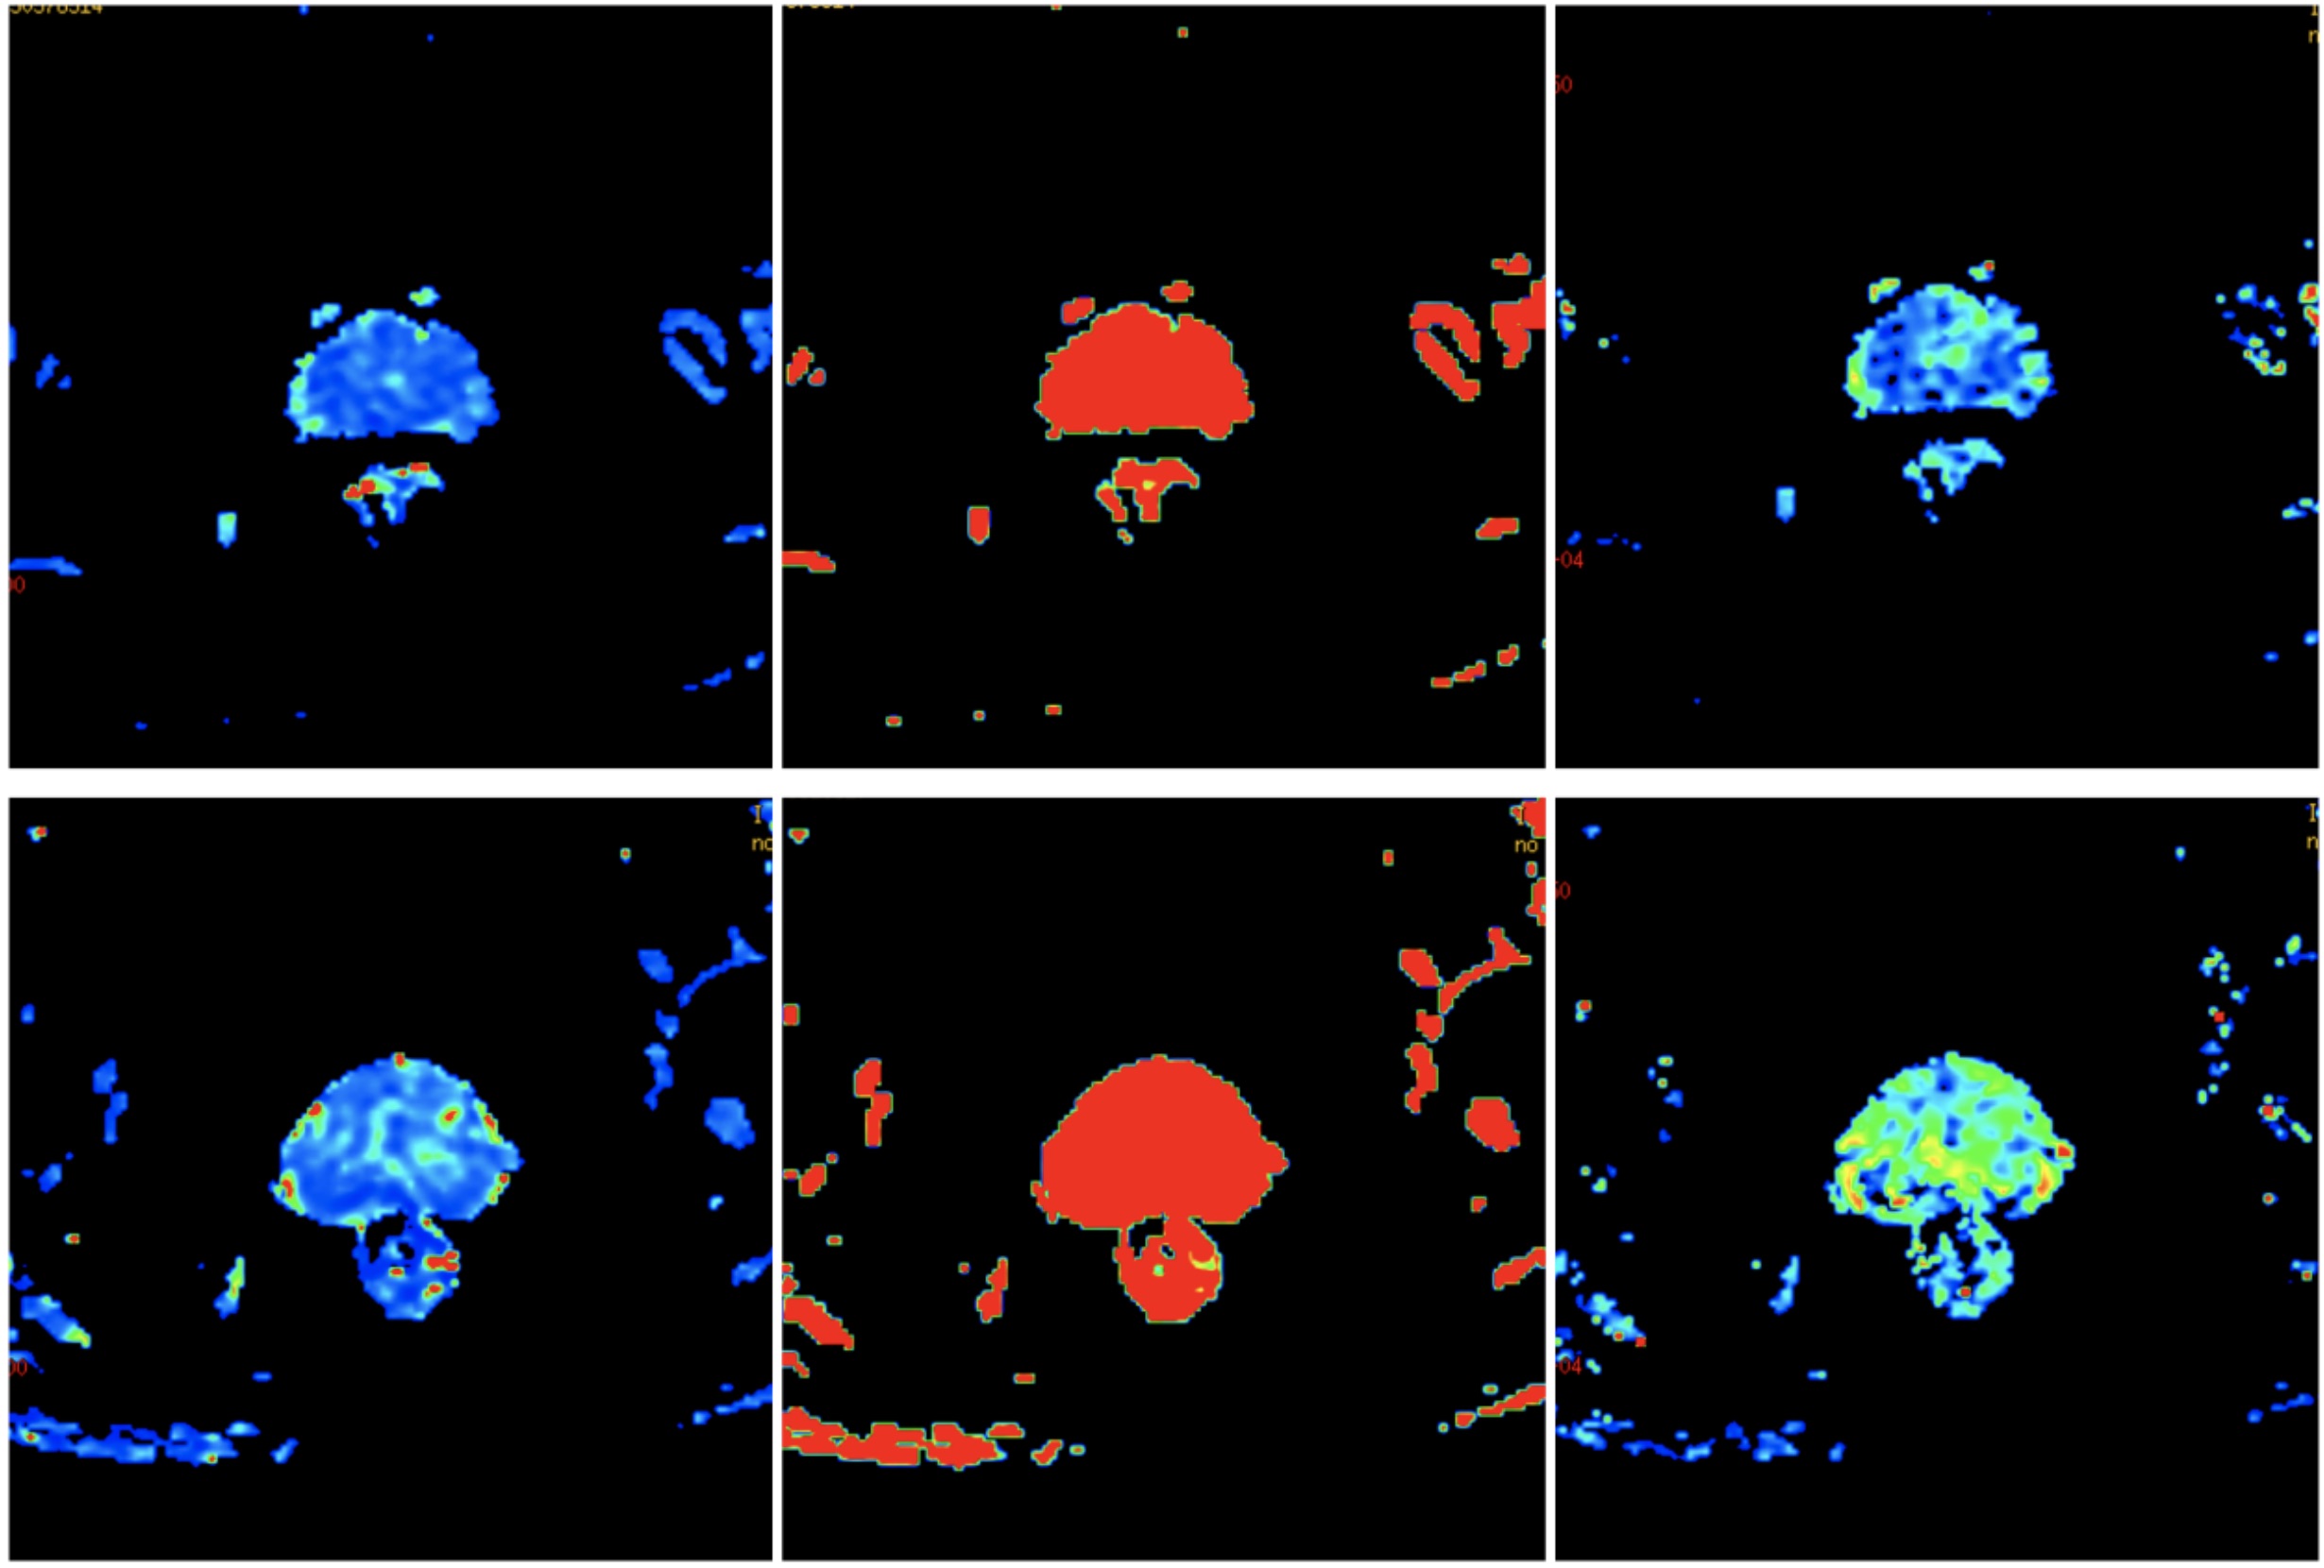
Figure 2. The three pictures from the left to the right in the first line are D*-mono,F-mono,D-bi pcolor of prostate cancer in CZ. The three pictures from the left to the right in the second line are D*-mono,F-mono,D-bi pcolor of hyperplasia.
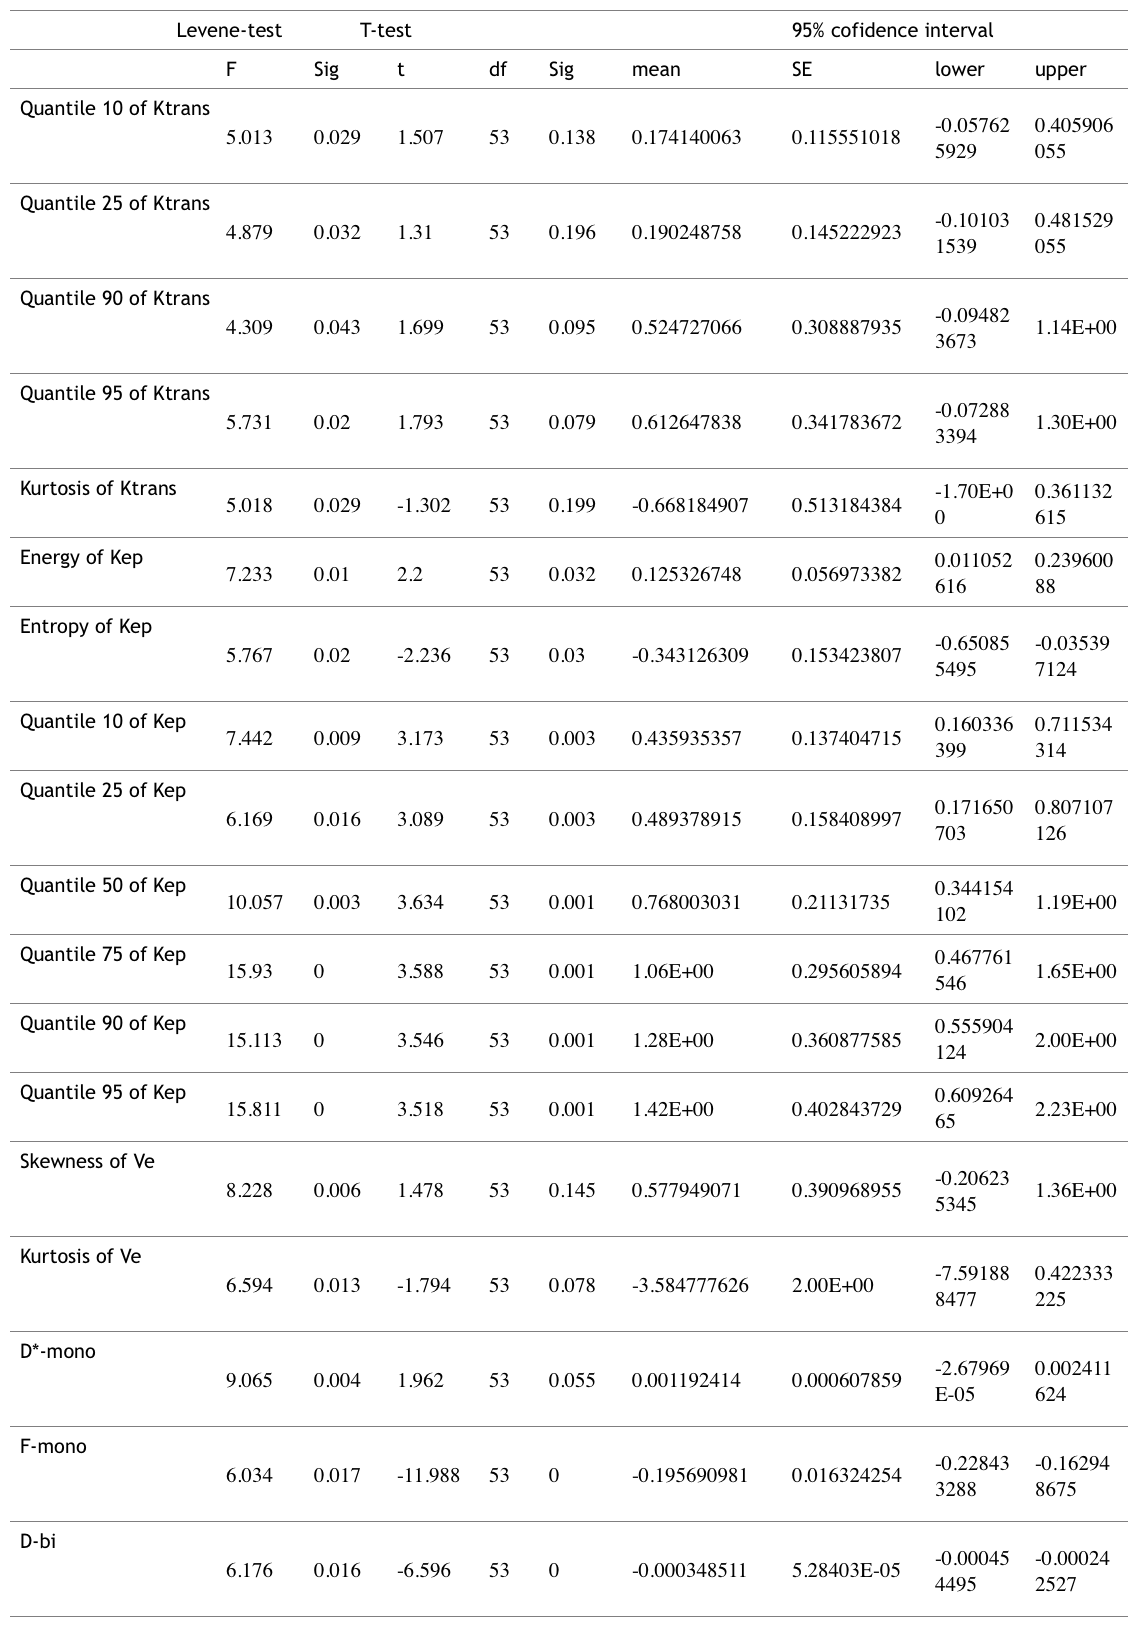
Table 1. The statistically significant parameters in two independent sample T-test (P<0.05)
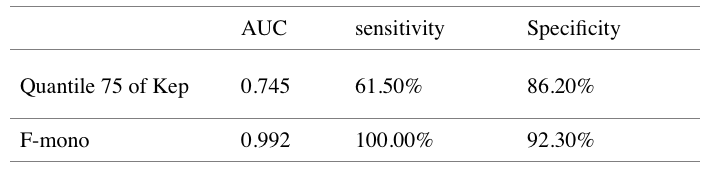
Table 2. The AUC, sensitivity, specificity of the quantile 75 diagnosis in prostate cancer in CZ and the AUC, sensitivity, specificity of the F-mono diagnosis in hyperplasia.