2570
mpMRI-based Machine-Learning Classifier Comparison for Gleason 4 Pattern Detection in Transition Zone and Peripheral Zone Prostate Lesions1Translational Imaging Group, CMIC, University College London, London, United Kingdom, 2Centre for Medical Imaging, University College London, London, United Kingdom, 3Dementia Research Centre, Department of Neurodegenerative Disease, UCL Institute of Neurology, London, United Kingdom
Synopsis
Multi-parametric MRI (mpMRI) can be used to non-invasively predict the presence of a Gleason 4 pattern in transition zone (TZ) and peripheral zone (PZ) prostate cancers. Here the performance of five machine-learning classifiers, which use mpMRI and clinical features, were compared. Analysis included a five-fold cross validation and a temporally separated validation to prove the generalisability of the classifiers. The results showed that PZ models can predict the presence of a Gleason 4 pattern better than TZ models. The statistically better PZ classifier is a linear regression model while for TZ the best classifier is Naïve Bayes model.
Introduction
Prostate cancer is the second most common cause of cancer death among American men. Multi-parametric magnetic resonance (mpMRI) has been shown to be very effective in detecting prostate cancer and in monitoring treatment response1, but interpreting prostate MRI images requires a high level of expertise and is time consuming. For this reason, there has been increasing interest in the development of computer-aided diagnosis systems (CAD) aimed at helping radiologists in their diagnosis2. One of the crucial steps of a CAD system is the prediction of the Gleason grade of a lesion. In this study we compare the performance of five different machine-learning techniques for classifying peripheral zone (PZ) and transition zone (TZ) lesions into those with/without a Gleason 4 pattern.Methods
Two temporally separated cohorts of mpMRI studies acquired at 3T were used for training and testing the classifiers. The training set consists of 99 patients (72 Gleason 4 and 27 Gleason 3+3) and 35 patients (21 Gleason 4 and 14 Gleason 3+3), for PZ and TZ respectively. The test set contains 30 patients, 20 for PZ (10 Gleason 4 and 10 Gleason 3+3) and 10 for TZ (5 Gleason 4 and 5 Gleason 3+3). The Gleason grade was confirmed by a systematic biopsy of the whole prostate. For each lesion the following features were extracted: mean signal intensity from axial T2-Weighted images (T2W) and Apparent Diffusion Coefficient maps (ADC); early enhancement (EE) and maximum enhancement (ME) extracted from the Dynamic Contrast Enhancement (DCE) images3. Two clinical features were also considered, namely serum prostate-specific antigen density (PSAd) and tumor volume (TV). First, the Correlation Feature Selection (CFS) algorithm4 is applied to select the subset of features (parTZ and parPZ ) that are highly correlated with the class and uncorrelated with each other so as to avoid a subset of redundant features. Then, five different algorithms were tested: a Logistic Regression (LR) classifier5, a Feed Forward Neural Network (FFNN)6, a Support Vector Machine (SVM)5 classifier, a Naïve Bayes (NB) classifier5, and a Random Forest (RF) classifier7. Due to the high unbalancing ratio of the training set used for PZ, a resampling technique called Synthetic Minority Over-sampling TEchnique (SMOTE)8 has been applied before training the classifiers. Two different strategies were used to validate the performance of the classifiers. First a five-fold cross validation is applied on the training set to compare the ROCs obtained by each classifier. Then the classifiers were further validated on the temporally separated test set to prove their generalisability.Results
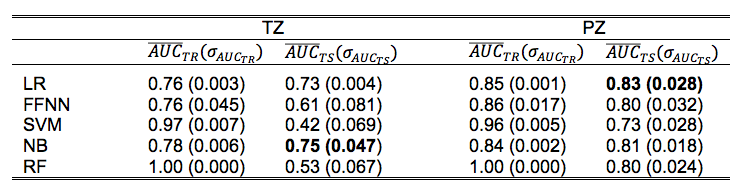
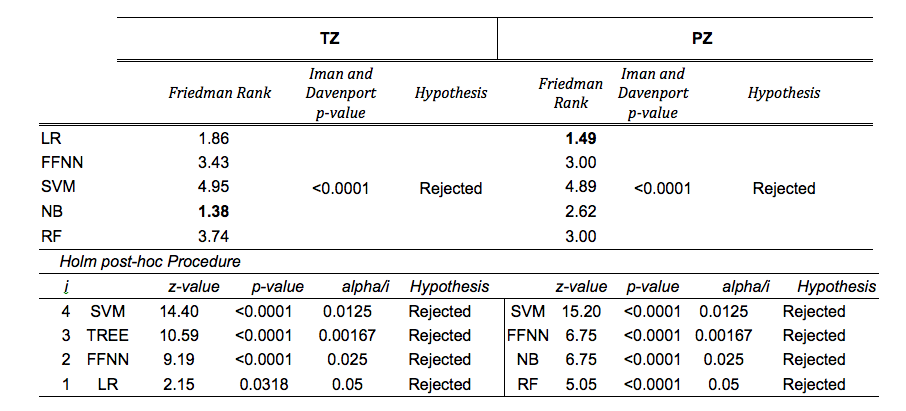
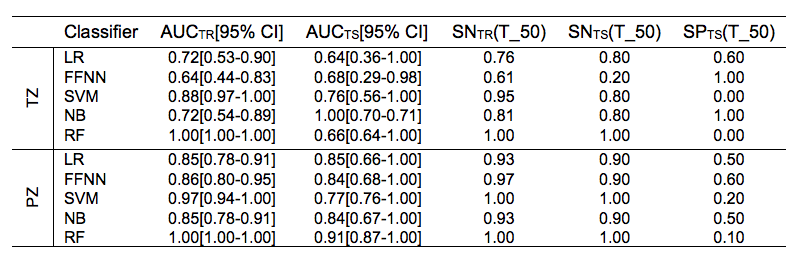
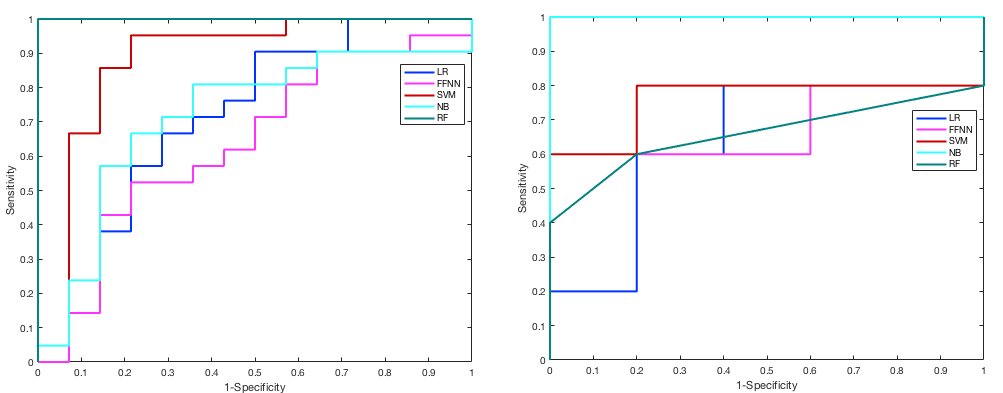
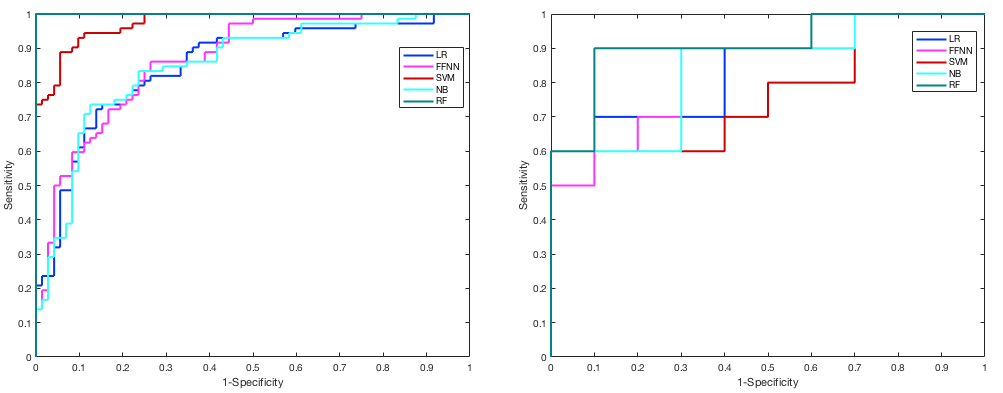
CFS selected parPZ = {ADC, ME}, and parPZ = {ADC, ME, PSAd} for TZ and PZ, respectively. For each fold a ROC curve is built, and the average value of the ROC-AUC over the five folds is calculated. The 5-fold cross validation is repeated 100 times, each time with a different partitioning of the data, so a classifier generates a distribution of 100 ROC-AUC values. Table 1 shows the mean ROC-AUC values obtained by each classifier. To verify if there is a statistical difference among the distributions of AUCs obtained by the different classifiers on the test sets, in Table 2 the results of the Friedman test9 and Iman and Davenport test10 followed by Holm post-hoc procedure11 are shown. For both the training and test set on PZ and TZ, figures 1-2 show the ROC curves and Table 3 shows the corresponding ROC-AUC values along with the values of sensitivity and specificity at the cut-off point T_50 corresponding to a specificity of 50%.Discussion and Conclusion
In this study we compared the performance of five machine-learning classifiers for predicting a Gleason 4 pattern in PZ and TZ prostate cancers. The classifiers demonstrated a different performance on each zone: PZ models achieved, in general, better results than TZ models and are able to maintain that performance at temporal validation (except for SVM). However, the only TZ classifier able to maintain good results at temporal validation is NB. The five-fold cross validation analysis together with the non-parametric statistical test highlighted LR as the classifier with statistically better ROC-AUC mean value on the PZ test set (0.83), while for TZ it is NB (0.75). Further investigation is needed on the TZ models to understand if the poor predictive capability at temporal validation depends on the small size of the training and test set or on the less predictive values of the mpMRI features used. These results are promising as they would be useful in the context of active surveillance, whereby decisions regarding whether to biopsy are necessitated.Acknowledgements
Funding for this work was received from the EPSRC, the National Institute for Health Research University College London Hospitals Biomedical Research Centre (BRC) and by the Comprehensive Cancer Imaging Centre (CCIC).References
1. Prostate cancer: diagnosis and treatment, NICE clinical guideline 175, 2014.
2. B. T. P. C. S. Wang, K. Burtt and R. M. Summers, Computer aided diagnosis of prostate cancer on multiparametric mri: A technical review of current research, BioMed Research International, 2014.
3. L.M Johnson, B. Turkbey, W.D. Figg, P.L Choyke Multiparametric MRI in prostate cancer management, Nat Rev Clin Oncol. 11(6) pp. 346-53, 2014.
4. M.A. Hall, L.A. Smith. Practical feature subset selection for machine learning C. McDonald (Ed.), Proceedings of the 21st Australasian Computer Science Conference ACSC'98, Perth, 4–6 February, Berlin: Springer, pp. 181-191, 1998.
5. Christopher Bishop. Pattern Recognition and Machine Learning, Springer-Verlag, 2006.
6. Christopher M. Bishop. Neural Networks for Pattern Recognition. Neural Networks for Pattern Recognition Oxford University Press, Inc. New York, NY, USA, 1995.
7. Andy Liaw, Matthew Wiener. Classification and Regression by randomForest. R News, Vol. 2, No. 3. pp. 18-22, 2002.
8. Chawla N V, Bowyer KW, Hall LO, Kegelmeyer WP. SMOTE: Synthetic Minority Over-sampling Technique. J Artif Intell Res. 16:321–357, 2002.
9. M. Friedman, The use of ranks to avoid the assumption of normality implicit in the analysis of variance, Journal of the American Statistical Association, vol. 32, pp. 675–701, 1937.
10. R. L. Iman, J. H. Davenport, Approximations of the critical region of the Friedman statistic, Comm. Statist. Part A Theory Methods, vol. 9, pp. 571–595, 1980. 11. S. Holm, A simple sequentially rejective multiple test procedure, Scand. J. Statist., vol. 6, pp. 65–70, 1979.
Figures