2566
A framework for intensity-based affine registration of multiparametric prostate MRI via mutual information and genetic algorithms1Center for Magnetic Resonance Research, University of Minnesota, Minneapolis, MN, United States, 2Minnesota Supercomputing Institute, University of Minnesota, Minneapolis, MN, United States, 3Department of Radiology, University of Minnesota, Minneapolis, MN, United States
Synopsis
An image registration framework was developed to perform 3D, affine, intensity-based co registration of multiparametric MRI series using mutual information as the similarity metric. The proposed methods include corrections to compensate for the effects of an endorectal coil, which is commonly used in prostate MRI. Experiments to characterize the registration method demonstrate that it is theoretically accurate to within 1.0 mm (when estimating the translation component). Qualitatively, significant improvements are seen in the co-localization of parametric maps with the anatomic images. The proposed framework may readily be integrated into a CAD system for prostate cancer detection.
Introduction
There is significant interest in developing computational models for detection of prostate cancer (PCa) using multiparametric MRI (mpMRI).1-3 The performance of such models depends on co-registration of imaging series so that parametric maps can be accurately calculated and co-localized. However, as evidenced by the dearth of published works,4-6 the registration problem is a challenging one. The absence of rigid well-defined structures in the prostate, differences in contrast between imaging series, and potential RF coil dependencies all present difficulties. Here, we demonstrate a semi-automatic framework for 3D affine, intensity-based registration of mpMRI data.Methods
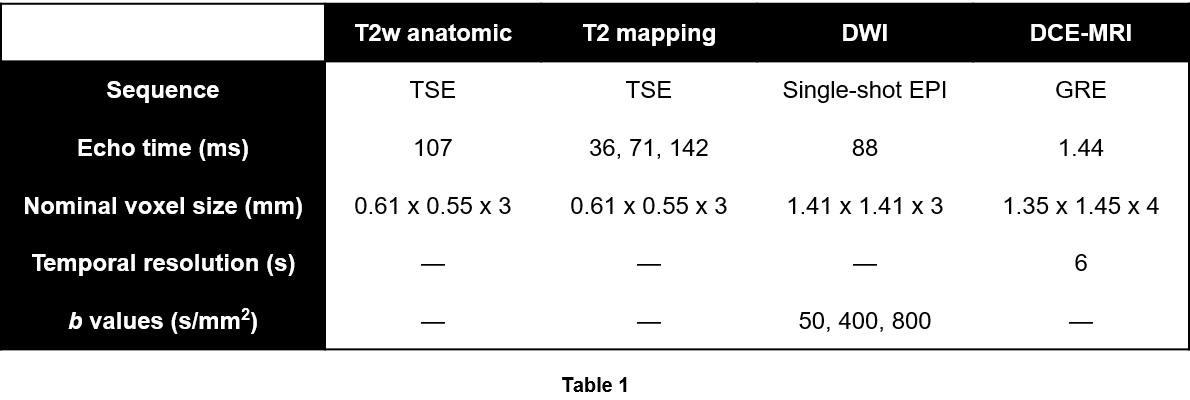
Multiparametric MRI data were acquired following previously described protocols.1 Briefly, 34 patients with known PCa received mpMRI scans at 3T. A combination of a surface array coil and an endorectal coil (ERC) was used for signal reception. Imaging sequence parameters are shown in Table 1.
The proposed registration framework seeks to independently register to the anatomic T2w images (target volumes) each of the other imaging series (source volumes), and involves three major steps.
Step 1: A rectangular VOI was defined for each patient that specifies the subvolume on which registration parameters will be optimized. VOI dimensions were chosen to match the prostate extent, which was determined via annotation of the prostate capsule by a experienced radiologist. The VOI was defined on target volumes, then propagated to source volumes.
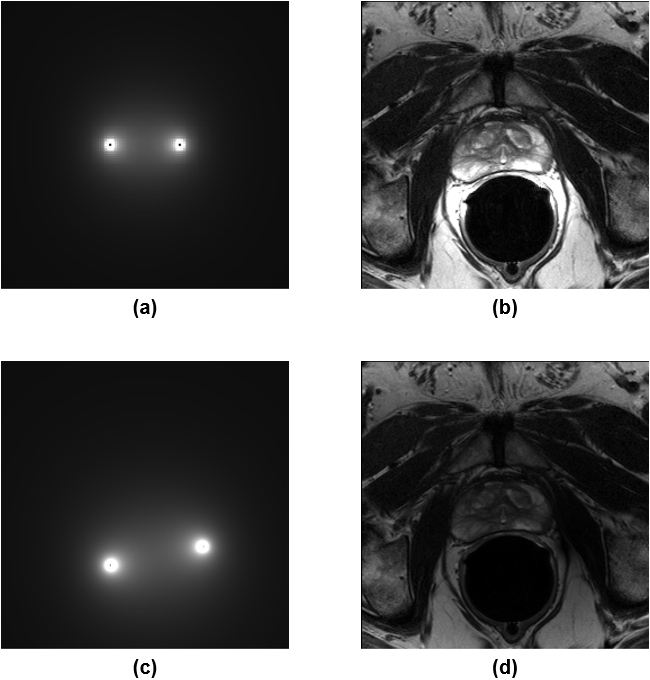
Step 2: The signal intensity inhomogeneity caused by the ERC sensitivity profile was corrected for. This step was necessary because intensity-based registration would otherwise be biased toward matching coil sensitivity profiles. To perform the correction, the ERC was modeled as two wires, and the Biot-Savart law was used to calculate the differential contribution of a wire segment to the magnetic field in the xy-plane:
$$d\vec{B}=\frac{I\,d\vec{l}\times\vec{R}}{4\pi\left|\vec{R}\right|^3}$$
where $$$I\,d\vec{l}$$$ is the differential element and $$$\vec{R}$$$ is the vector pointing from the element to the voxel of interest. All contributions were then summed to obtain the estimated sensitivity profile. After normalization, the sensitivity profile was registered to each of the imaging series using minimum variation as the similarity metric. Briefly, maximizing minimum variation decreased the dispersion of $$$\log\left(I_{c,i}/I_{s,i}\right)$$$ over the defined VOI, where $$$I_{c,i}$$$ and $$$I_{s,i}$$$ are intensity values of the sensitivity profile and the imaging series, respectively, at voxel $$$i$$$. Lastly, the imaging data were divided by the aligned sensitivity profile (Fig. 1).
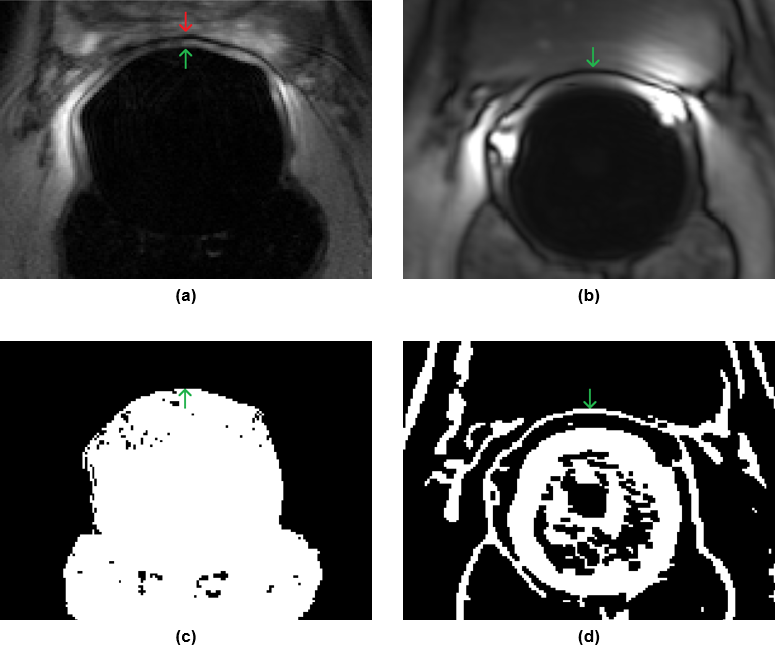
Step 3: After intensity correction, each of the source volumes was registered to the target using mutual information as the similarity metric. Multiple echo time TSE series were registered directly. For DWI data, registration was only performed for the b0 image; the transformation was assumed to be identical for the ADC map. For DCE data, registration was only performed for the 2nd time point, assuming (for now) the transformation is identical for other time points and pharmacokinetic maps. Additionally, due to a chemical shift artifact at the prostate-ERC boundary in the DCE data that would otherwise confound intensity-based registration, the translation component along the AP axis was found by calculating the difference between the AP positions of the ERC in the center slice of target and source volumes, which in turn was determined using locally-adaptive thresholding (Fig. 2).
To find the optimal affine transformation in the described registration tasks, a two-step approach was employed to address the non-convexity of the problem. First, a genetic algorithm, using fitness-proportionate selection with a small mutation operator, was used to find candidates for the best mapping. An iterative grid search was then used to sweep for potential local maxima near each candidate.
Results
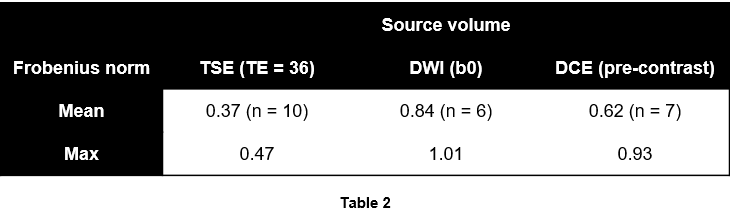
To validate the proposed methods, random affine transformations $$$T$$$ were applied to select source volumes that were deemed to be aligned (without registration) with the corresponding target volumes. The transformations $$$\hat{T}$$$ that would bring transformed source volumes back into alignment were estimated, and distances between $$$T^{-1}$$$ and $$$\hat{T}$$$ (ideally 0) were quantified using the Frobenius norm (Table 2).
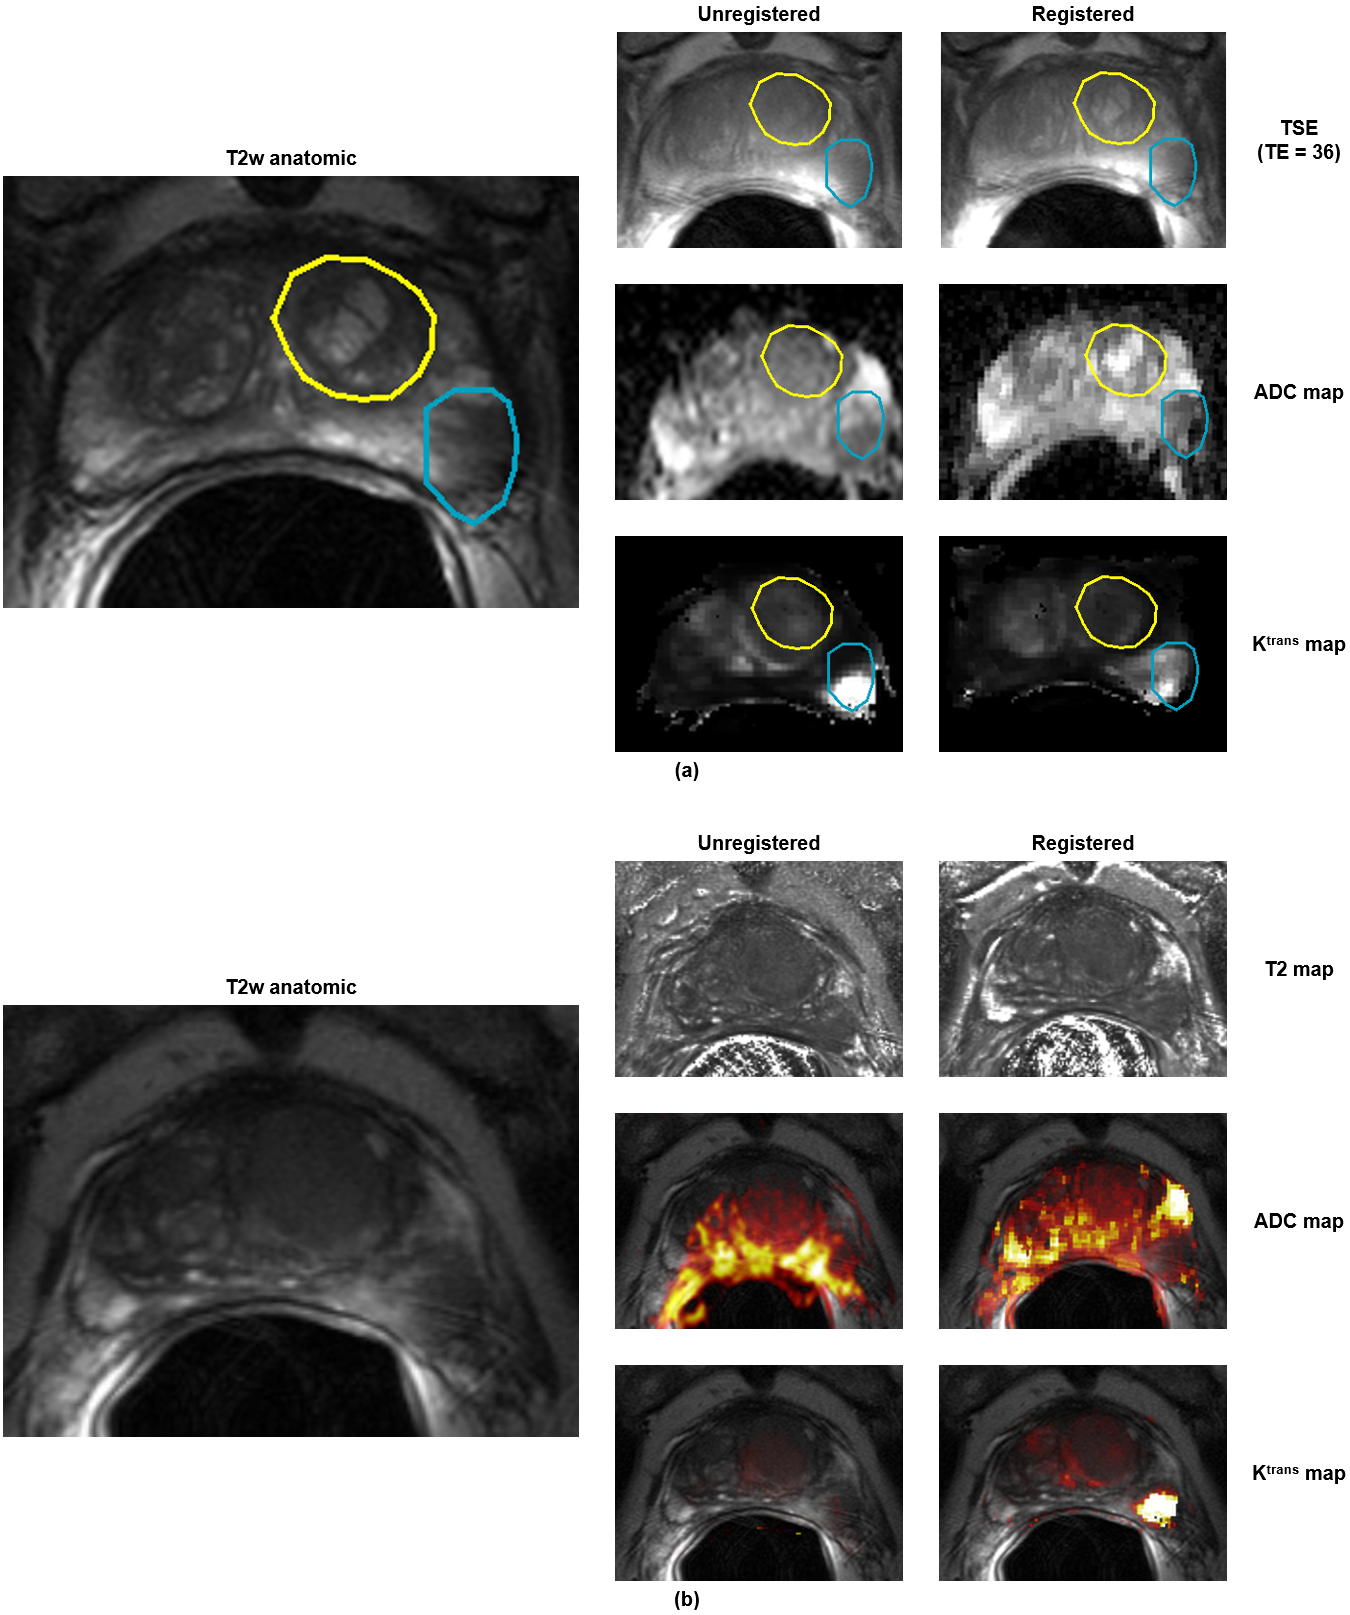
To visually assess registration quality, cases that had obvious misalignment were identified. For each case, ROIs were identified and manually outlined on the target volume, then propagated to the source volumes before and after registration. Figure 3 shows these results plus registered parametric maps for a representative case.
Discussion
The results demonstrate that the proposed methods can reliably compensate for affine distortions in source volumes, which can help produce higher-quality parametric maps. Although the methods assume the use of an ERC, we speculate that they can be adapted to non-ERC studies as well. We plan to extend the methods to a multi-resolution approach, which may improve the speed and accuracy of the optimization process.Acknowledgements
This work was supported in part by the National Institutes of Health (R01-CA155268, P41-EB015894, T32-GM008244), Department of Defense (W81XWH-15-1-0477), and the Minnesota Research Evaluation and Commercialization Hub (MN-REACH).References
1. Metzger GJ, Kalavagunta C, Spilseth B, Bolan PJ, Li X, Hutter D, Nam JW, Johnson AD, Henriksen JC, Moench L, Konety B, Warlick CA, Schmechel SC, Koopmeiners JS. Detection of Prostate Cancer: Quantitative Multiparametric MR Imaging Models Developed Using Registered Correlative Histopathology. Radiology. 2016;279(3):805-16.
2. Litjens G, Debats O, Barentsz J, Karssemeijer N, Huisman H. Computer-aided detection of prostate cancer in MRI. IEEE Trans Med Imaging. 2014;33(5):1083-92.
3. Lemaître G, Martí R, Freixenet J, Vilanova JC, Walker PM, Meriaudeau F. Computer-Aided Detection and diagnosis for prostate cancer based on mono and multi-parametric MRI: a review. Comput Biol Med. 2015 May;60:8-31.
4. Chappelow J, Bloch BN, Rofsky N, Genega E, Lenkinski R, DeWolf W, Madabhushi A. Elastic registration of multimodal prostate MRI and histology via multiattribute combined mutual information. Med Phys. 2011;38(4):2005-18.
5. De Luca M, Giannini V, Vignati A, Mazzetti S, Bracco C, Stasi M, Armando E, Russo F, Bollito E, Porpiglia F, Regge D. A fully automatic method to register the prostate gland on T2-weighted and EPI-DWI images. Conf Proc IEEE Eng Med Biol Soc. 2011;2011:8029-32.
6. Zhao X., Kaufman A. (2012) Anatomical Feature-Guided Mutual Information Registration of Multimodal Prostate MRI. In: Yoshida H., Sakas G., Linguraru M.G. (eds) Abdominal Imaging. Computational and Clinical Applications. ABD-MICCAI 2011. Lecture Notes in Computer Science, vol 7029. Springer, Berlin, Heidelberg.
Figures