2565
Multi parametric magnetic resonance imaging for the detection of prostate cancer: combination of T2-weighted, diffusion tensor imaging and magnetic resonance spectroscopic imaging1Health Science, The University of Newcastle, Newcastle, Australia, 2Radiation oncology, Calvary Mater Newcastle, Newcastle, Australia, 3Medical Physics, The University of Newcastle, Newcastle, Australia, 4Radiation oncology, calvary mater newcastle, Newcastle, Australia, 5Radiology, Calvary Mater Newcastle, Newcastle, Australia, 6Imaging Centre, Hunter Medical Research Institute (HMRI), Newcastle, Australia
Synopsis
The aim of this study was to determine the diagnostic performance of mp-MRI using T2WI, DWI, DTI and MRSI for prostate cancer patients with various Gleason scores. mp-MRI using T2WI, DWI, DTI and MRSI on 12 prostate cancer patients. The area under
Introduction
At present, the ability of non-invasive identification and accurate assessment of prostate cancer (PCa) for diagnosis and treatment remains challenging 1. Clinical application of magnetic resonance images (MRI) has been shown to improve the detection of prostate cancer 2. In addition, multi-parametric MRI (mp-MRI), which combines T2-weighted imaging (T2WI), with methods including diffusion-weighted imaging (DWI) and dynamic contrast enhancement (DCE) are utilized clinically for prostate cancer diagnostic and clinical management 3. Commonly, mp-MRI are qualitatively and subjectively assessed 4. Mp-MRI using T2WI and diffusion tensor imaging (DTI) and magnetic resonance imaging (MRSI) is not currently used for prostate cancer diagnosis. Difficulties in the processing and interpretation of MRSI/DTI has limited the potential role of these imaging techniques in the clinic 5,6. However, quantitative analysis of MRSI/DTI could improve the detection and characterization of PCa by providing additional information, such as diagnostic metabolite levels and tumour directional cellularity. New advances in these areas, such as higher magnetic field strengths and more accurate and fast image acquisition techniques could now facilitate their adoption into routine clinical practice 7,8. In this study, an optimal acquisition technique of DTI and MRSI was developed and the potential role of mp-MRI, including T2WI/DWI/DTI/MRSI investigated in the clinical assessment of prostate cancer patients.
The objective of this study was to determine the diagnostic performance of mp-MRI using T2WI+DWI+DTI+MRSI for prostate cancer patients.
Methods
12 PCa patients (71.16 ± 8.17 years) with high prostate specific antigen (PSA) (16.64 ± 12.86 ng/mL) levels were analysed and three patients were excluded from the study due to the low MRSI data quality. Ethics approval for the study protocol was obtained from the local area health ethics committee, and written informed consent was obtained from all patients. Participants were scanned six weeks after biopsy and before treatment using a 3 tesla MRI scanner (Skyra, Siemens Healthineers, Germany) equipped with an phase array coil. A two-dimensional turbo spin echo (TSE) T2WI of the prostate was performed with following parameters: repetition time (TR): 6600 ms; echo time (TE): 110 ms; thickness: 4 mm; no gap. DWI was obtained using single shot echo planar imaging (EPI) and the following parameters: TR: 4600 ms, TE: 65 ms; slice thickness: 4 mm; no gap and b-values of 0, 400 and 800 s/mm2. DTI was also obtained using a single shot EPI. Thirty non-collinear directions of the diffusion sanitizing gradient were used with a TE of 101 ms, FOV of 260 x260 mm, slice thickness of 4 mm with no gap and b-values of 0 and 1600 s/mm2. 3D 1H MRSI data were acquired using a GOIA-sLASER sequence with TE = 88 ms, TR = 930 ms, averages =4, dual MEGA RF pulses for water and lipid saturation, full phase encoding, matrix = 12×12×10 leading to a voxel size of 7×7×7 mm3 7. A total of 41 cancer and 27 healthy region of interests (ROI)s were manually outlined in the peripheral zone (PZ) on T2WI by a radiologist with more than twenty years experience. A two tailed t-test was used to compare the mean values of cancer and healthy regions using IBM SPSS statistic version 0.24.0 software. The area under receiver operating characteristic (ROC) curve of T2WI+DWI and T2WI+DWI+DTI+MRSI images were generated and used to evaluate the performance of mp-MRI for discriminating cancer and healthy regions.Results and Discussion
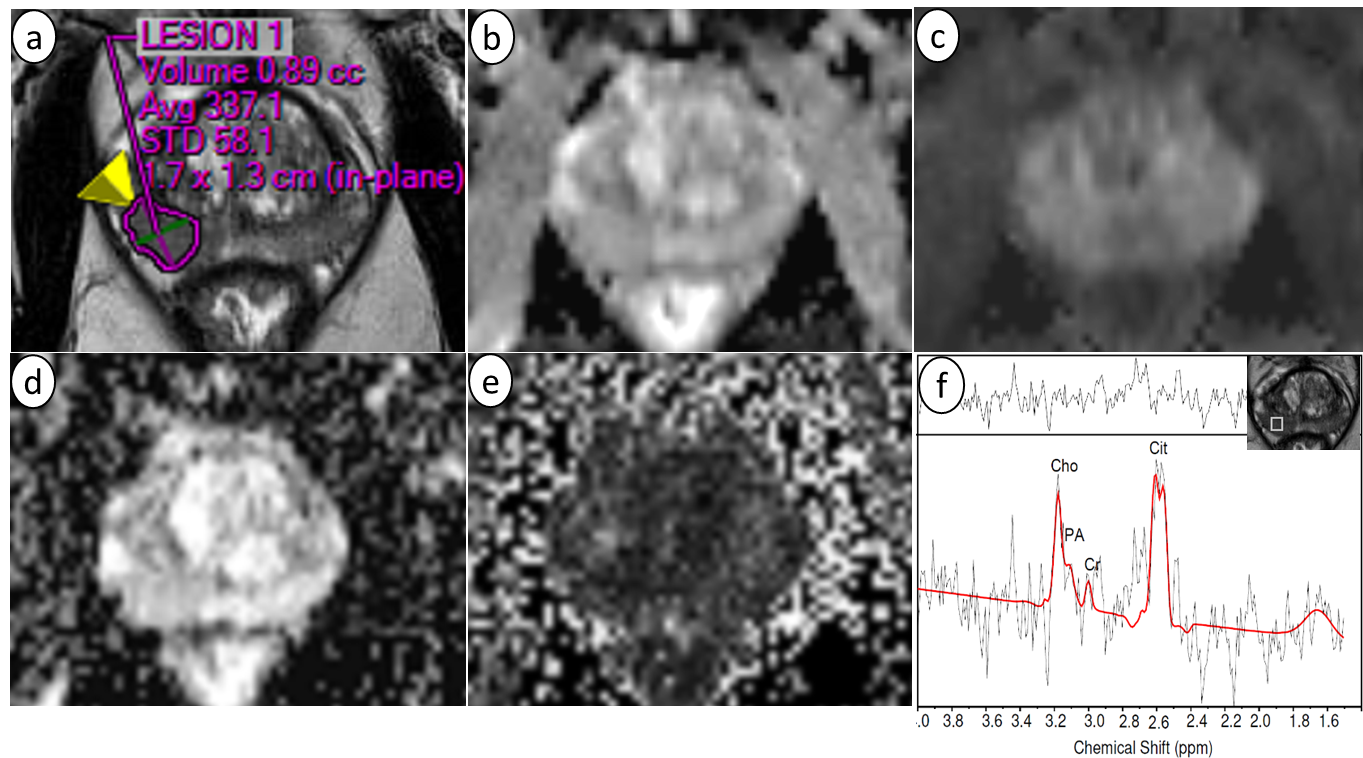
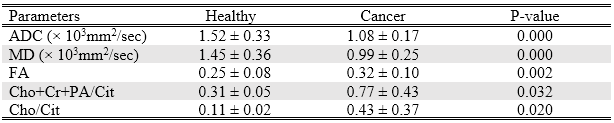
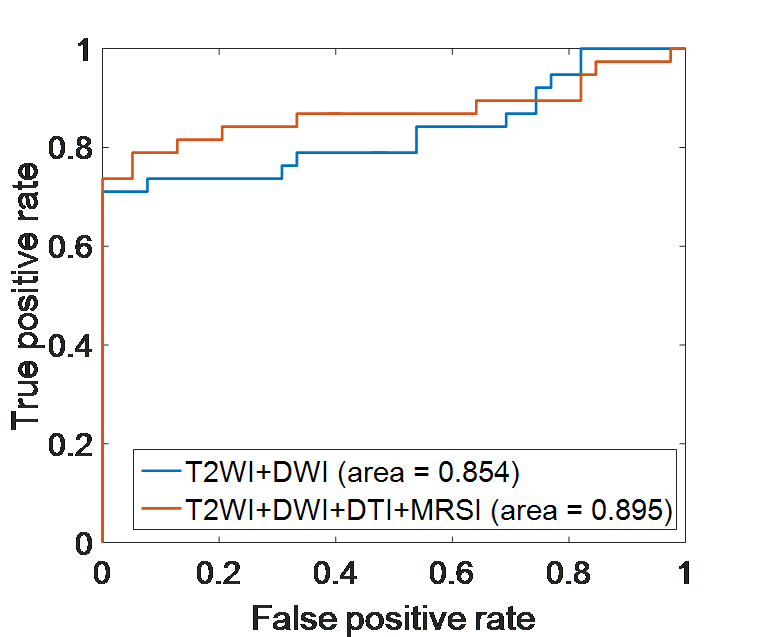
Figure 1 shows an example of mp-MRI with a prostate cancer ROI delineated in the peripheral zone. The quantitative parameters from each image for healthy and cancer ROIs and the corresponding p-values are summarized in Table 1. Mean ADC values of DWI and mean diffusivity (MD) values of DTI in healthy regions were significantly higher than cancer regions (p-value < 0.01), whereas mean fractional anisotropy (FA) values of DTI in healthy regions was significantly lower than cancer regions (p-value < 0.01). For MRSI, the concentration of choline (Cho), creatine (Cr), polyamine (PA) and citrate (Cit) were measured using LCmodel and the ratio of Cho+Cr+PA/Cit and Cho/Cit were calculated for each voxel within tissue. The mean Cho+Cr+PA/Cit and Cho/Cit ratios of MRSI results in the cancer regions was significantly higher than the healthy regions (p-value < 0.05). The diagnostic performance of the T2WI+DWI and T2WI+DWI+DTI+MRSI yielded an area under the ROC curve of 0.854 and 0.895, respectively for the discrimination of cancer and healthy regions (Figure 2).Conclusion
Our results suggest that mp-MRI using DWI, DTI and MRSI in combination with structural T2WI improve performance for discrimination of cancer and healthy prostate tissues.Acknowledgements
Jameen Arm and Leah Best are thanked for assistance in scanning subjects.References
1. Liddell H, Jyoti R, Haxhimolla HZ. mp-MRI Prostate Characterised PIRADS 3 Lesions are Associated with a Low Risk of Clinically Significant Prostate Cancer - A Retrospective Review of 92 Biopsied PIRADS 3 Lesions. Current Urology 2015;8(2):96-100.
2. Tanimoto A, Nakashima J, Kohno H, et al. Prostate cancer screening: The clinical value of diffusion-weighted imaging and dynamic MR imaging in combination with T2-weighted imaging. Journal of Magnetic Resonance Imaging 2007;25(1):146-152.
3. Kitajima K, Kaji Y, Fukabori Y, et al. Prostate cancer detection with 3 T MRI: Comparison of diffusion-weighted imaging and dynamic contrast-enhanced MRI in combination with T2-weighted imaging. Journal of Magnetic Resonance Imaging 2010;31(3):625-631.
4. Ouzzane A, Puech P, Lemaitre L, et al. Combined Multiparametric MRI and Targeted Biopsies Improve Anterior Prostate Cancer Detection, Staging, and Grading. Urology 2011;78(6):1356-1362.
5. Kurhanewicz J, Vigneron D, Carroll P, et al. Multiparametric magnetic resonance imaging in prostate cancer: present and future. Current opinion in urology 2008;18(1):71-77.
6. Bourne R, Panagiotaki E. Limitations and Prospects for Diffusion-Weighted MRI of the Prostate. Diagnostics 2016;6(2).
7. Steinseifer IK, van Asten JJ, Weiland E, et al. Improved volume selective (1) H MR spectroscopic imaging of the prostate with gradient offset independent adiabaticity pulses at 3 tesla. Magn Reson Med 2015;74(4):915-924.
8. Barrio-Arranz G, de Luis-García R, Tristán-Vega A, et al. Impact of MR Acquisition Parameters on DTI Scalar Indexes: A Tractography Based Approach. PLoS ONE 2015;10(10).
Figures