2563
Characterising prostate tumour growth patterns in men on active surveillance: linking ADC features to growth kinetics1CRUK Imaging Centre, Institute of Cancer Research, London, United Kingdom, 2MRI Unit, The Royal Marsden NHS Foundation Trust, Sutton, United Kingdom, 3Urology Department, The Royal Marsden NHS Foundation Trust, Sutton, United Kingdom, Sutton, United Kingdom
Synopsis
Tumor growth kinetics of low-risk prostate cancer in 15 men managed by active surveillance with size increase on repeat MRI were correlated with ADC histogram metrics. Measurements were made over 3 time-points at least 1 year apart (mean 3.6 ± 0.95 years). Median growth was 23.1% in the first interval and 49.8% in the second. ADC reduced over time. Accelerated growth during the second time interval correlated with the increase in interquartile range (r=0.6, p=0.02) and shift to more positive skew (r=-0.56, p=0.03) seen during the first time interval, suggesting that increasing heterogeneity and reducing ADC may signal accelerated growth.
Background
In men with low-risk prostate cancer managed by active surveillance, ADC metrics have been used to distinguish tumors that progress histologically from those who do not1. Numerous studies also link ADC to tumour grade2. However, shifting ADC metrics have not directly been linked to tumor growth. The purpose of this study was to establish this relationship in order to develop ADC histogram metrics as a biomarker for disease progression.Methods
15 men on active surveillance (aged 54-77 years, mean 68.5 ± 7.9 years) with evidence of increasing tumour volume on T2W+diffusion-weighted MRI over a minimum of 3 scans done at least 1 year apart and therefore who progressed to treatment were retrospectively identified from men imaged over a 6-year period. All had MRI at 3T (Philips Achieva) with T2-W scans in 3 orthogonal planes (FSE, TR=2500msec, TE=90 msec) plus ZOOM (Zonal Oblique Multislice) diffusion-weighted imaging (b=0, 100, 300, 500, 800 s/mm2) in a transverse plane to match the T2-W images. Regions of interest (ROIs) were drawn around tumor by a single experienced radiologist on the ADC maps. The most recent images were viewed first, followed by those from earlier time points (TPs) to ensure measurement of the same lesion. ADC metrics (mean, centiles, interquartile range [IQR], skew and kurtosis) were derived for individual tumors at each TP using a monoexponential fit to the data. Baseline ADC metrics and percentage change in ADC metrics during the first time interval were correlated with the tumor growth rate (percentage volume increase per annum) during the second time interval to establish whether changes in ADC distribution could predict subsequent tumor growth.Results
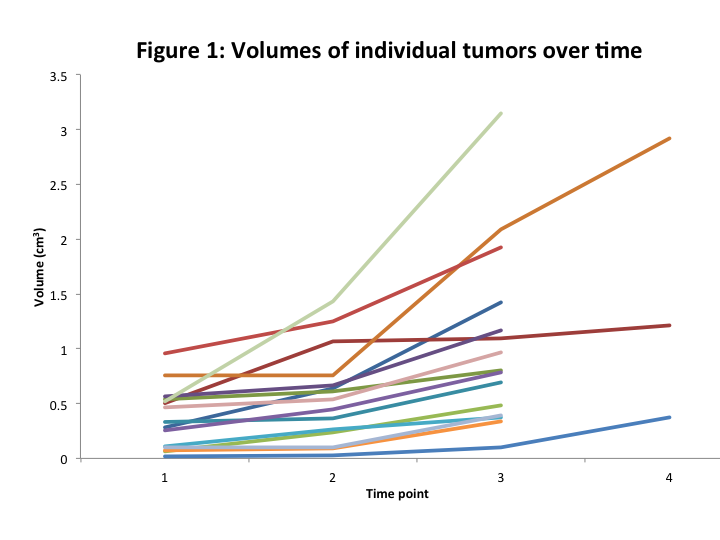
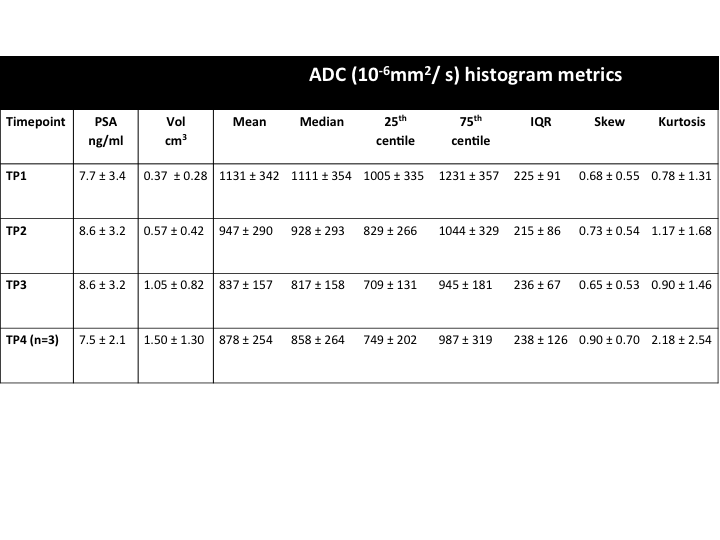
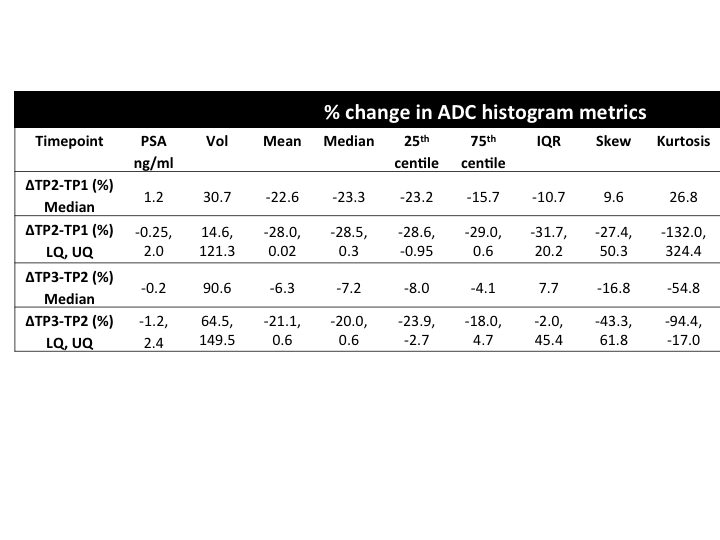
12 patients had 3 scans and 3 had 4 scans over a 3.6 ± 0.95 year interval. PSAs were 7.7 ± 3.4 ng/mL at TP1 increasing to 8.6 ± 3.2 ng/mL at TP2 and 9.3 ± 4.7 ng/mL at TP3. Tumor volumes were 0.02-0.96 cm3 at TP1, 0.03-1.44 cm3 at TP2 and 0.10-3.15 cm3 at TP3 (Figure 1). The median percentage change in volume between TP1 and 2 was 30.7% (LQ 14.6%, UQ 121.3%) and between TP2-TP3 was 90.6% (LQ 64.5%, UQ 149.5%). Median tumor growth rates were 23.1% at the first time interval (LQ 7.7%, UQ 70.3%) and 49.8% (LQ 38.5, UQ 104.6%) at the second time interval, indicating accelerated growth during the latter. Absolute values of mean, median, 25th, 75th centiles, IQR, skew and kurtosis are given in Table 1 and their corresponding percentage changes at each time interval in Table 2. No correlations were seen between any ADC metric and growth rate during the first time interval. During the second time interval, ADC mean, median, 25th and 75th centiles correlated negatively with tumor growth rate (r=-0.83, -0.84, -0.83, -0.82 for mean, median 25th and 75th centiles respectively, p<0.01). Additionally, there was a significant positive correlation between change in IQR (r=0.6, p=0.02) during the first time interval and tumor growth rate during the second time interval. There was also a weak but significant negative correlation with skewness (increase of lower ADC values, r=-0.56, p=0.03) during the first time interval and tumor growth rate during the second time interval.Discussion and Conclusion
In patients with enlarging tumors, there is a gradual reduction in ADC values with time. This reduction exceeds the reproducibility measures of tumor ADC as demonstrated in numerous other tumor types3. Tumor growth largely showed an exponential pattern with acceleration during the second time interval compared to the first. Once tumors were in a growth accelerated phase, the reduction in ADC metrics (left shift of the ADC histogram) correlated with growth rate. The relationship between increase in IQR as well as more positive skewness during the first time interval and faster growth during the second time interval suggests that increasing heterogeneity (IQR) and lower ADC values (more positive skew) result as tumors de-differentiate. This may well be the first sign of a phase of accelerated growth.Acknowledgements
CRUK and EPSRC support to the Cancer Imaging Centre at ICR and RMH in association with MRC and Department of Health C1060/A10334, C1060/A16464 and NHS funding to the NIHR Biomedical Research Centre and the Clinical Research Facility in Imaging.References
1. deSouza NM, Riches SF, Vanas NJ, Morgan VA, Ashley SA, Fisher C, Payne GS, Parker C. Diffusion-weighted magnetic resonance imaging: a potential non-invasive marker of tumour aggressiveness in localized prostate cancer. Clin Radiol. 2008 Jul;63(7):774-82.
2. Helfrich O, Puech P, Betrouni N, Pinçon C, Ouzzane A, Rizk J, Marcq G, Randazzo M, Durand M, Lakroum S, Leroy X, Villers A. Quantified analysis of histological components and architectural patterns of gleason grades in apparent diffusion coefficient restricted areas upon diffusion weighted MRI for peripheral or transition zone cancer locations. J Magn Reson Imaging. 2017 Apr 6.
3. Winfield JM, Tunariu N, Rata M, Miyazaki K, Jerome NP, Germuska M, Blackledge MD, Collins DJ, de Bono JS, Yap TA, deSouza NM, Doran SJ, Koh DM, Leach MO, Messiou C, Orton MR. Extracranial Soft-Tissue Tumors: Repeatability of Apparent Diffusion Coefficient Estimates from Diffusion-weighted MR Imaging. Radiology. 2017 Jul;284(1):88-99.
Figures