2556
Effect of Rectal Gas on Susceptibility Artifact in Prostate DWI1Bioengineering, Radiological Sciences, University of California, Los Angeles, Los Angeles, CA, United States, 2Radiological Sciences, University of California, Los Angeles, Los Angeles, CA, United States
Synopsis
Diffusion-weighted imaging (DWI) is a key component of multi-parametric prostate MRI; however, DWI is prone to susceptibility artifact occurring in the peripheral zone, where 70% of tumors are found. The purpose of this study was to qualitatively and quantitatively assess the effect of rectal gas on the presence of this artifact. The study found that in cases with no rectal gas (<2cm3), image quality is excellent as a rule. When more than 2cm3 of gas is present, a range of image quality is seen that is not correlated to the amount of gas present.
Purpose
Diffusion-weighted imaging (DWI) is a key component of multi-parametric prostate MRI; however, DWI is prone to susceptibility artifact occurring in the peripheral zone, where 70% of tumors are found1. The purpose of this study was to qualitatively and quantitatively assess the effect of rectal gas on the presence of this artifact.Methods and Materials
144 patients were scanned on a 3T MRI system (MAGNETOM Skyra; Siemens Healthcare, Erlangen, Germany). The standard single-shot echo-planar DWI was performed with multichannel phased-array coils.
For each dataset, one axial DWI slice with the severest degree of artifact was manually selected as the representative slice. In the case where there was not a single, clear slice with the severest artifact, the default slice selected was the slice in the mid zone with the largest cross-sectional prostate area. The image quality of the representative axial DWI slice was scored by two experienced abdominal radiologists, both of who have interpreted over 1000 prostate MR cases. The following scale was used: 1 = no perceptible artifact; 2 = minimal geometric distortion or susceptibility, which would not interfere with diagnosis (i.e., prostate looks minimally misshapen on DWI relative to T2); 3 = mild to moderate artifact, which may interfere with diagnosis (i.e., thin white line all along the peripheral zone posteriorly); 4 = at least moderate artifact which will definitely impede diagnostic accuracy, (i.e. misshapen prostate gland with thicker white line posteriorly, obscuring the entire posterior peripheral zone); 5 = severe artifact such that the exam is non-diagnostic.
Fraction of prostate area obscured, a quantitative measurement of image quality, was calculated from one ROI drawn around the cross-sectional prostate area unobscured by artifact and another around the entire prostate area, on the representative DWI slice. The drawing of ROI around the entire prostate was informed by the T2w image of that slice. Fraction of prostate area obscured is equal to the difference in the areas of these two ROIs divided by the area of the second ROI.
To quantify rectal gas, contours were drawn around gas in the rectum in T2w images. Contours were drawn on all of the slices in which gas was present, out of a total of 20 slices. Volume of gas was generated on OsiriX from these contours.
Results
There is an extremely statistically significant association between rectal gas volume and the qualitative scores as assessed by the nonparametric test for trend (p-value<0.0001) and a moderate correlation between gas volume and the fraction of prostate obscured (Spearman rho = 0.5327, p-value<0.0001).
In the no gas group (gas volume<2 cm3, n=84), the mean qualitative scores is 1.0833±0.2980 and the mean fraction of prostate area obscured is 0.00413±0.02752.
In the gas group (gas volume>2cm3, n=60), there is no statistically significant association between gas volume and qualitative scores, as assessed by the nonparametric test for trend (p-value=0.271). There is also no correlation between gas volume and the fraction of prostate area obscured (Spearman rho=0.0890, p-value=0.499).
There is a good inter-reader agreement (kappa=0.68). There is a statistically significant association between the qualitative scores and the fraction of prostate area obscured, as assessed by the nonparametric test for trend (p-value<0.0001).
Discussion
Beyond presence of gas, additional factors likely influence image quality, including rectal distance and rectal movement.Conclusion
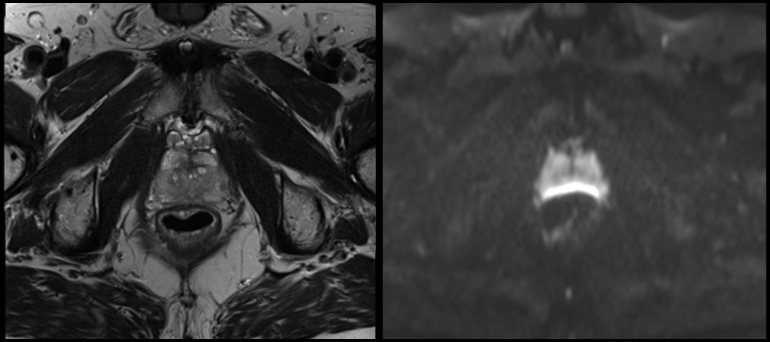
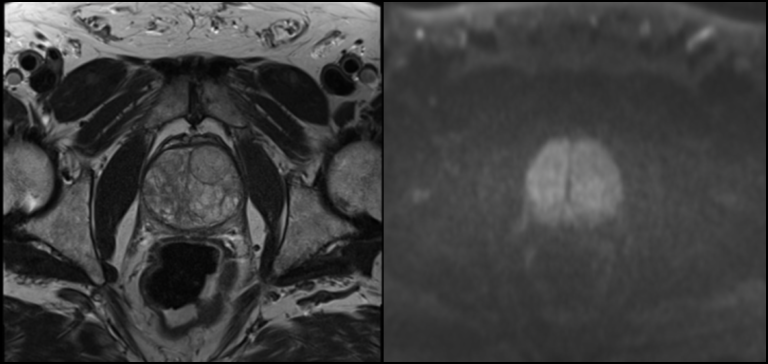
In cases with no rectal gas (<2cm3), image quality is excellent as a rule. When more than 2cm3 of gas is present, a range of image quality is seen that is not correlated to the amount of gas present. Figures 1 and 2 show cases in which we see a lack of correlation between image quality and gas volume.Clinical Relevance
DWI has been shown to improve prostate cancer detection and apparent diffusion coefficient (ADC) values derived from these acquisitions has shown potential for predicting disease aggressiveness.Acknowledgements
No acknowledgement found.References
1. McNeal, JE, Redwine, EA, Freiha FS, Starney TA. Zonal distribution of prostatic adenocarcinoma. Correlation with histologic pattern and direction of spread. Am J Surg Pathol. 1988 Dec;12(12):897-906.Figures