2554
The Influence of Temporal Resolution on the Diagnostic Accuracy of DCE-MRI in Evaluation of Prostate Cancer.1Physics and Astronomy, University of British Columbia, Vancouver, BC, Canada, 2Radiology, University of British Columbia, Vancouver, BC, Canada, 3Pathology and Laboratory Medicine, University of British Columbia, Vancouver, BC, Canada, 4Urologic Sciences, University of British Columbia, Vancouver, BC, Canada
Synopsis
DCE-MRI is widely used for cancer detection, and is a part of PIRADS v2 guideline for scoring prostatic lesions. Diagnostic accuracy of DCE-MRI may depend on the rate of temporal sampling. In this study we have investigated the relationship between the rate of temporal sampling of DCE-MRI and the accuracy of detection of prostatic carcinoma. We have acquired and analyzed DCE-MRI data from 15 patients. Our results show that the accuracy of DCE-MRI in detection of prostatic carcinoma is not affected by sampling rates between 3.4 to 13.6 seconds.
Purpose:
To study the impact of the rate of temporal sampling of dynamic contrast-enhanced (DCE) MRI on the accuracy of diagnosing prostate carcinoma (PCa).Introduction:
DCE-MRI has been widely used during the past decades for cancer diagnosis and treatment monitoring (1, 2). Many studies have indicated that the diagnostic accuracy of DCE-MRI can be significantly affected by the rate of temporal sampling (3-5). Several studies investigated the influence of temporal resolution on the accuracy of DCE-MRI in human tissues, such as breast (3, 4, 6). However, to the best of our knowledge, no study has yet specifically investigated the effect of temporal resolution on the accuracy of diagnosing PCa, although the prostate imaging and data reporting system version 2 (PIRADS v2) recommends a temporal resolution of < 10s with preference for <7 s (7). Therefore, this study has been designed to investigate the relationship between the rate of temporal sampling of DCE-MRI and the accuracy of detection of PCa.Methods:
Fifteen patients with biopsy proven PCa were examined with a 3T scanner prior to undergoing radical prostatectomy. MR signals were acquired with a combined endorectal/pelvic phased-array coils. DCE-MRI data consisted of one proton density (PD) image, and 170 T1-weighted (T1W) images acquired prior to (4 images) and after the injection of the contrast agent (Magnevist). Contrast agent concentration in the tissue was calculated based on PD and T1W images, acquired using a 3D ultrafast spoiled gradient echo sequence (T1-TFE), as explained in (1). The sequence parameters are presented in Table 1. To mimic the lower temporal resolutions, data were down-sampled by averaging every 2, 3, 4, and 5 time frames, which generated data sets with temporal resolutions of 6.8s, 10.2s, 13.6 s, and 17s, respectively (original temporal resolution=3.4 s). Arterial Input Functions (AIFs) were generated by fitting the concentration of contrast agent in the voxels within the external iliac or femoral arteries to a double Gaussian function (8). Maps of pharmacokinetic parameters: volume transfer constant (Ktrans), fractional volume of the extra-vascular extra-cellular space (ve), and fractional volume of plasma (vp) were generated by fitting the extended Tofts model (9) to the original and down-sampled data sets. Parametric maps were correlated to whole-mount histology using image registration. Receiver operating characteristics (ROC) analysis and logistic regression were performed to evaluate the diagnostic accuracy of individual and combined MR parameters in detection of PCa for different temporal sampling rates.Results:
Graphs of area under the ROC curve (AUC) values versus temporal resolution, in the peripheral zone, transition zone, and the entire prostate are shown in, Figures 1, 2, and 3, respectively. Results of multi-parameter ROC analyses are summarized in Table 2. Overall, we did not observe a noticeable difference between AUC values obtained for temporal resolutions ranging from 3.4s to 13.6 s.Discussions & Conclusions:
Our results demonstrate that the accuracy of DCE-MRI in detection of PCa is not affected by sampling rates between 3.4s to 13.6 s. The significance of this finding can be understood by considering the trade-off between temporal resolution and spatial resolution in DCE-MRI. If two sequences with different temporal sampling rates provide similar accuracy, the slower sampling rate may be preferred as it will then allow for improvement of spatial resolution (while maintaining the same scan time). The increase in spatial resolution of DCE-MRI will decrease false-negative diagnoses and improve specificity as demonstrated by Furman-Haran et al. (10). The fact that we did not observe a difference in the diagnostic accuracy for a number of different temporal sampling rates might be surprising at first glance, especially considering that following the bolus injection the contrast agent in arterial blood increases very rapidly, such that this signal may contain significant high frequency components. It has been shown that using the lower sampling rates results in a greater fitting error and inaccurate calculation of the fit parameters (5). Hence, it could be expected that lower diagnostic accuracy would be observed for slower temporal sampling rates. A possible explanation for our counterintuitive results is that, even though the slower sampling rates result in higher fit error, if the calculated parameters in both tumour and normal tissue diverge from their true values in a similar manner (e.g. both underestimated or both overestimated), a similar contrast may be maintained between the tumour and normal tissue regardless of the temporal sampling rate. A more conclusive explanation of the observed results requires future investigation.Acknowledgements
This study has been supported by the Canadian Institutes of Health Research.References
1. Probing tumor microvascularity by measurement, analysis and display of contrast agent uptake kinetics. Parker GJ, Suckling J, Tanner SF, Padhani AR, Revell PB, Husband JE, Leach MO. J Magn Reson Imaging, 1997;7(3):564-74
2. Dynamic Contrast-enhanced MRI in Clinical Oncology: Current Status and Future Directions. AR., Padhani. J Magn Reson Imaging, 2002;16:407-422.
3. Temporal sampling requirements for the tracer kinetics modeling of breast disease. Henderson E, Rutt BK, Lee TY. Magn Reson Imaging., 1998;16(9):1057-73.
4. Temporal Sampling Requirements for Reference Region Modeling of DCE-MRI Data in Human Breast Cancer. Planey CR, Welch EB, Xu L, et al. J. MAgn Reson Imaging, 2009;30:121-34.
5. The influence of temporal resolution in determining pharmacokinetic parameters from DCE-MRI data. Heisen M, Fan X, Buurman J, van Riel NA, Karczmar GS, ter Haar Romeny BM. Magn Reson Med, 2010; 63(3):811-6.
6. The effect of temporal sampling on quantitative pharmacokinetic and three-time-point analysis of breast DCE-MRI. Fluckiger JU, Schabel MC, Dibella EV. Magn Reson Imaging, 2012;30(7):934-43.
7. PI-RADS. Prostate Imaging Reporting and Data System, Version2. American College of Radiology Website. 2015. Retrieved on 19/04/2017 from http:/ ̴ /www.acr.org//media/ACR/Documents/PDF/QualitySafety/Resources/PIRADS/PIRADS%20V2.pdf
8. Experimentally-derived functional form for a population-averaged high-temporal-resolution arterial input function for dynamic contrast-enhanced MRI. Parker GJ, Roberts C, Macdonald A, Buonaccorsi GA, Cheung S, Buckley DL, Jackson A, Watson Y, Davies K, Jayson GC., 2006; 56(5):993-1000.
9. Estimating kinetic parameters from dynamic contrast-enhanced T(1)-weighted MRI of a diffusable tracer: standardized quantities and symbols. Tofts PS, Brix G, Buckley DL, Evelhoch JL, Henderson E, Knopp MV, Larsson HB, Lee TY, Mayr NA, Parker GJ, Port RE, Taylor J, Weisskoff RM. J Magn Reson Imaging, 1999;10(3):223-32.
10. Critical Role of Spatial Resolution in Dynamic Contrast-Enhanced Breast MRI. Furman-Haran E, Grobgeld D, Kelcz F, Degani H. J Magn Reson Imaging. 2001;13(6):862-7.
Figures
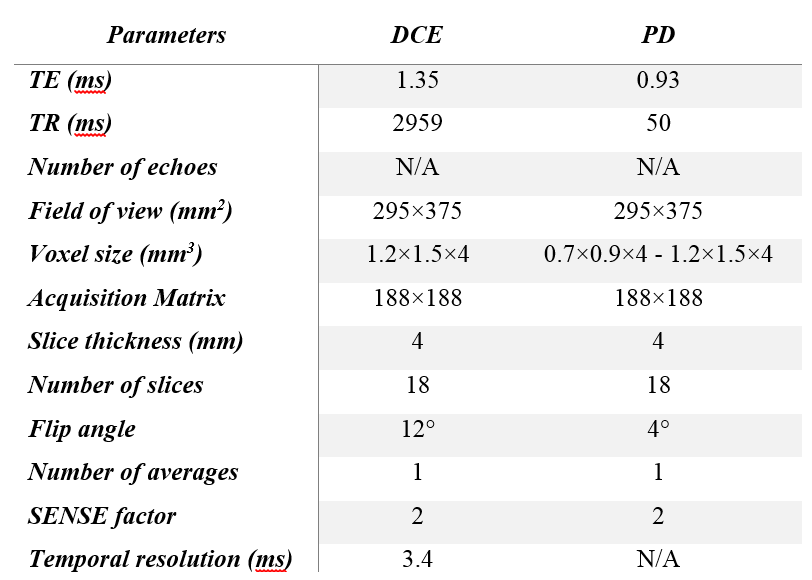
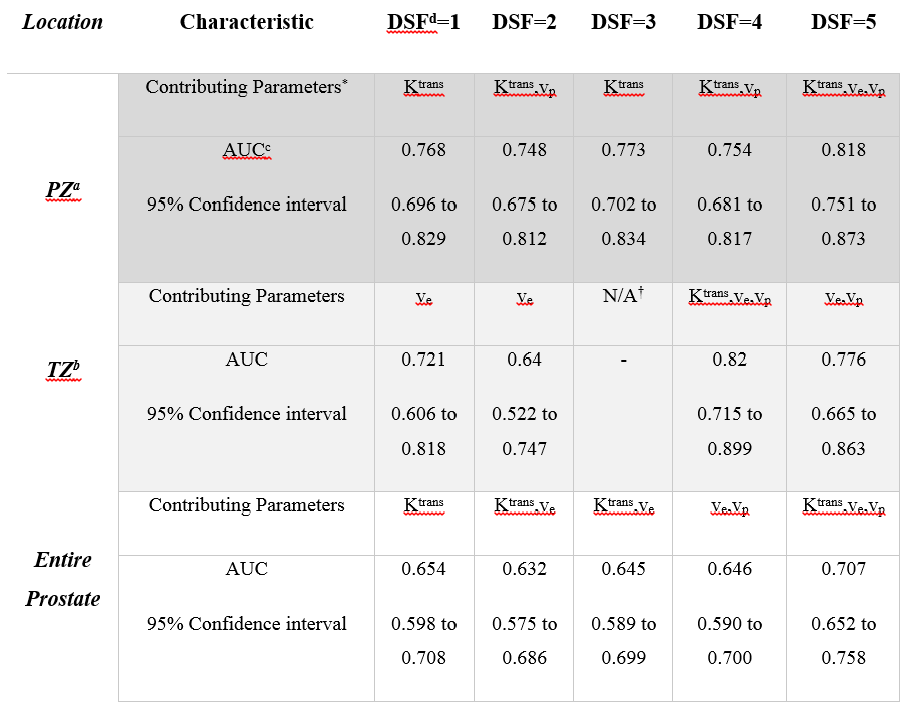
Table 2. Results of multi-parametric ROC analyses.
aPZ: peripheral zone, bTZ: transition zone, cAUC: area under the (ROC) curve. dDSF: down-sample factor. DSF=1: 3.4 s, DSF=2: 6.8s, DSF=3: 10.2s, DSF=4: 13.6 s, and DSF=5: 17s.
*Multi-parametric ROC analyses were performed using logistic regression, while only parameters that contributed significantly to the model, were used in the calculations.
†For DSF=3 Multi-parametric ROC analysis could not be performed in TZ since no parameter was retained in the model.
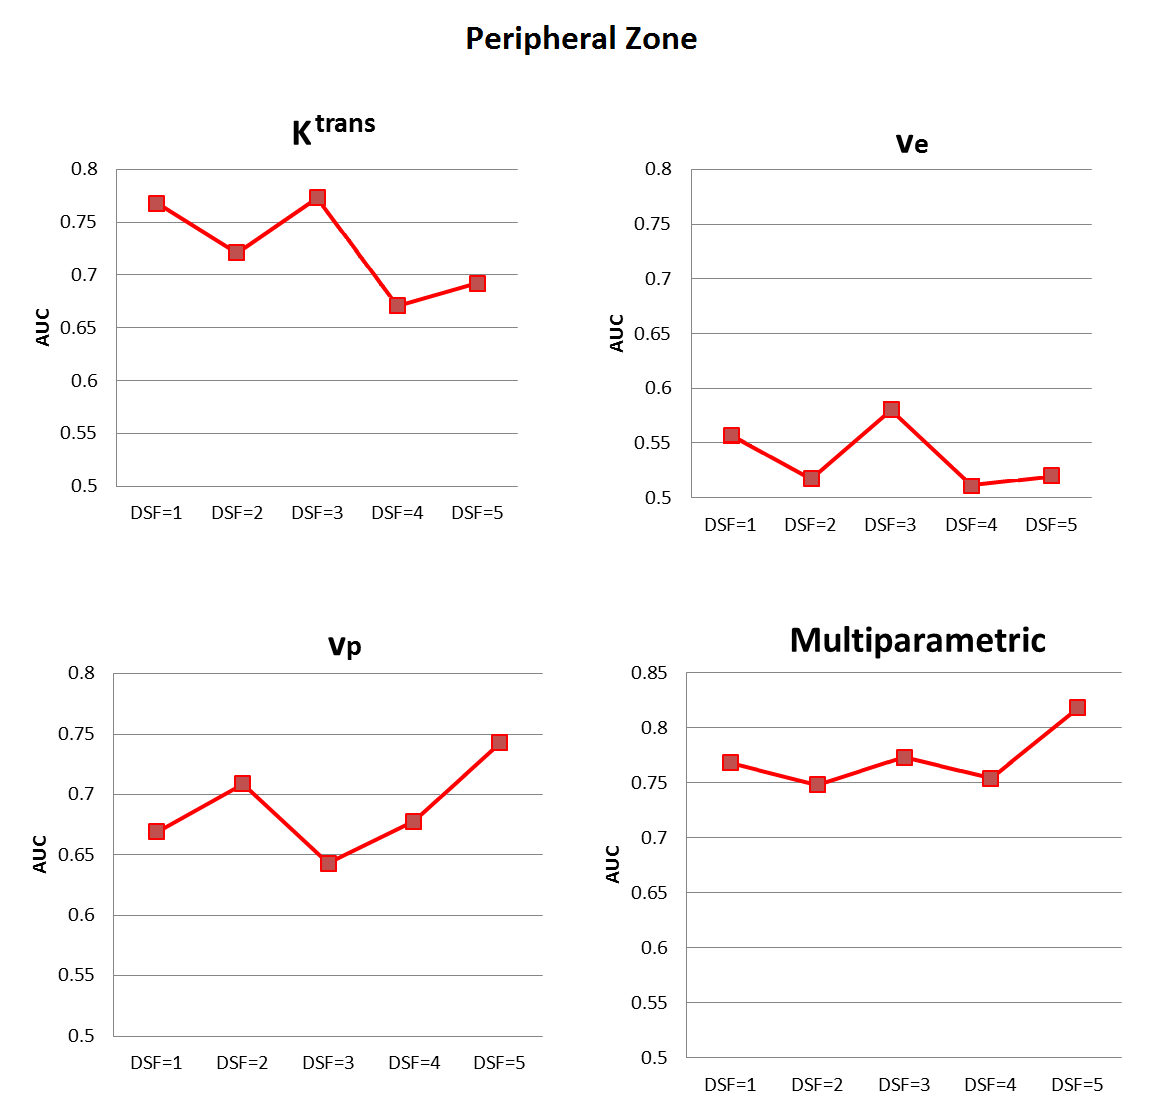
Figure 1. Graphs of area under the (ROC) curve (AUC) as a function of down-sample factor (DSF) in the peripheral zone.
DSF=1: 3.4 s, DSF=2: 6.8s, DSF=3: 10.2s, DSF=4: 13.6 s, and DSF=5: 17s
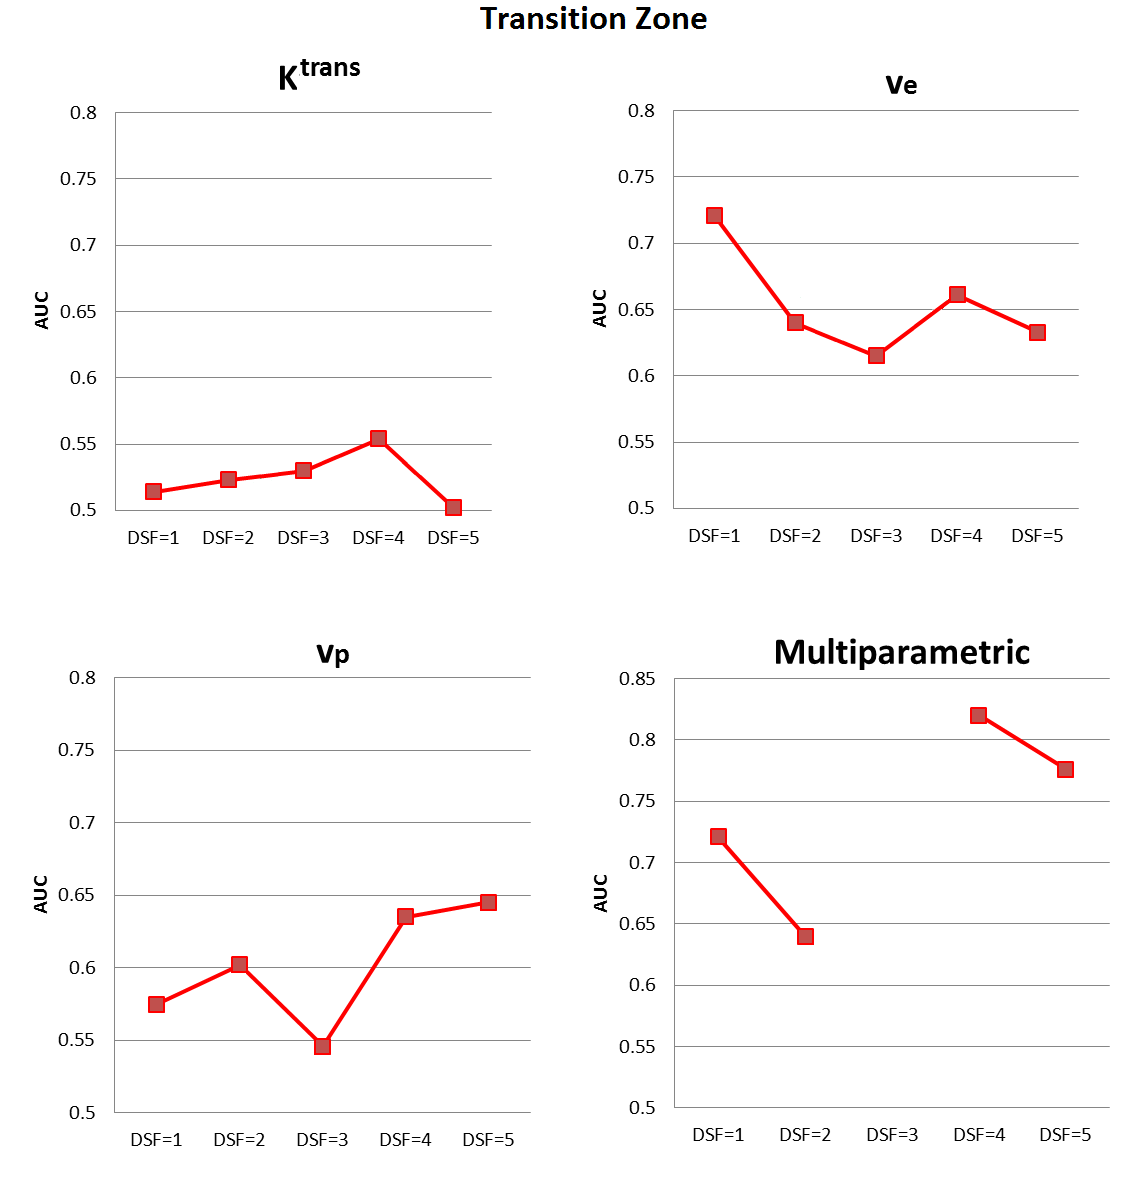
Figure 2. Graphs of AUC values as a function of DSF in the transition zone.
Multi-parametric ROC analyses were performed using logistic regression, while only parameters that contributed significantly to the model were used in the calculations. For DSF equal to 3, multi-parametric ROC analysis could not be performed as no parameter was retained in the model; therefore, there are no results report for it in the above figure.
DSF=1: 3.4 s, DSF=2: 6.8s, DSF=3: 10.2s, DSF=4: 13.6 s, and DSF=5: 17s.
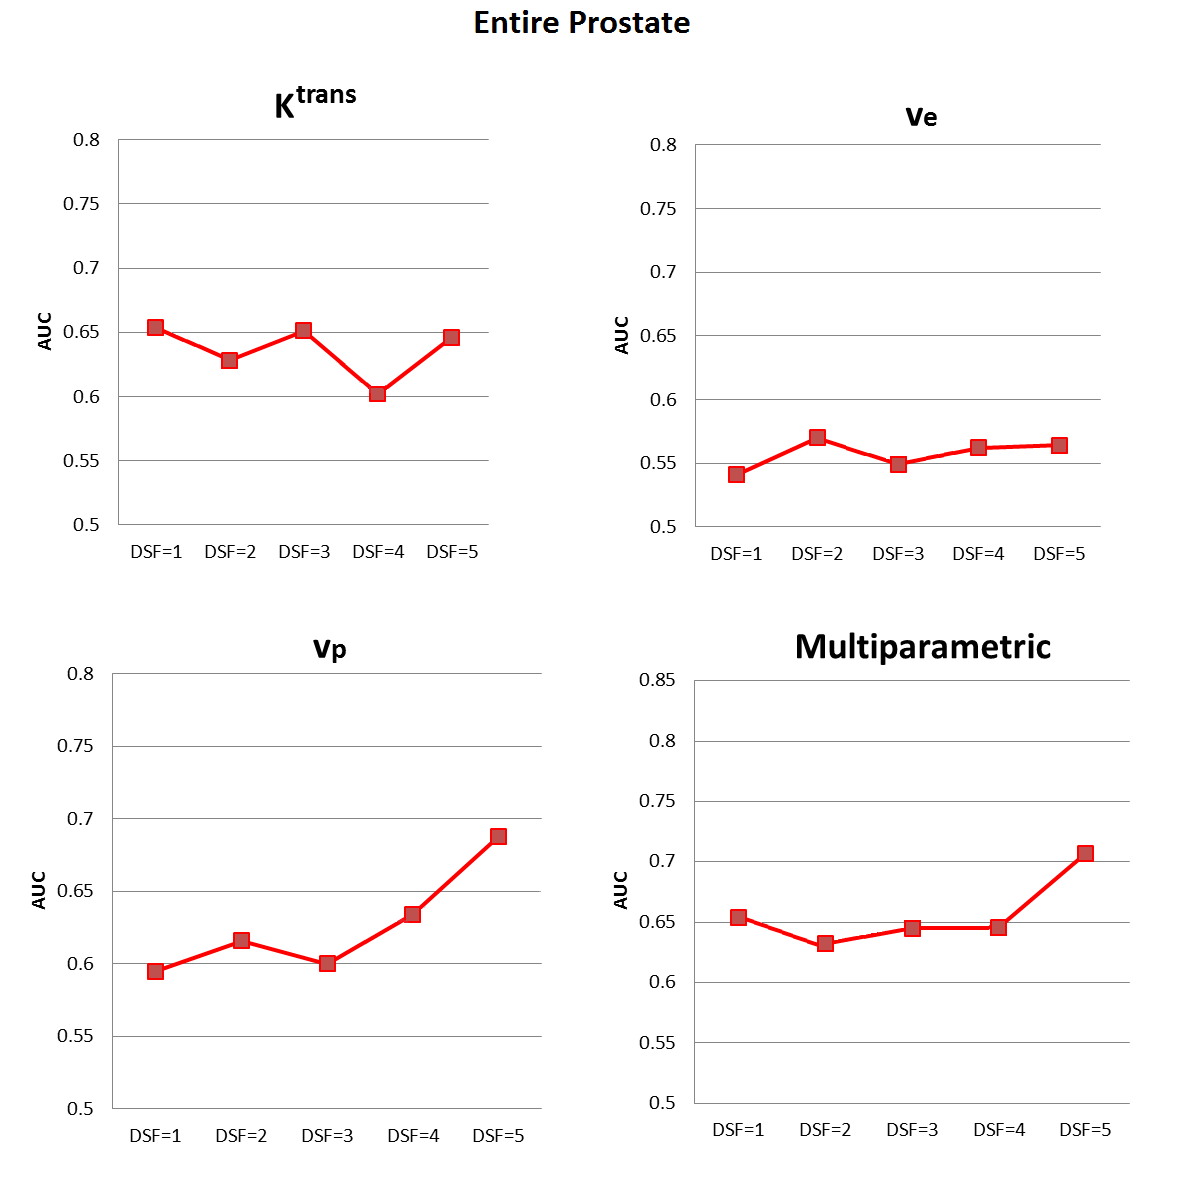
Figure 3. Graphs of AUC values as a function of DSF in the entire prostate.
DSF=1: 3.4 s, DSF=2: 6.8s, DSF=3: 10.2s, DSF=4: 13.6 s, and DSF=5: 17s.