2553
Optimization of the Contrast-to-noise Ratio between Malignant and Non-malignant Prostate Tissue in T2-weighted MRI.Shirin Sabouri1, Silvia D. Chang2, Edward C. Jones3, S. Larry Goldenberg 4, Peter C. Black4, and Piotr Kozlowski2
1Physics and Astronomy, University of British Columbia, Vancouver, BC, Canada, 2Radiology, University of British Columbia, Vancouver, BC, Canada, 3Pathology and Laboratory Medicine, University of British Columbia, Vancouver, BC, Canada, 4Urologic Sciences, University of British Columbia, Vancouver, BC, Canada
Synopsis
T2W imaging is an important sequence in the PIRADSv2 guideline for scoring prostatic lesions. The apparent contrast between malignant and non-malignant tissues on T2W images depends on the time of echo (TE). In this study we have investigated the effect of TE on the contrast-to-noise ratio (CNR) between malignant and non-malignant tissues. We have acquired and analyzed T2W data from 12 patients. Our results show that CNR increases abruptly for TEs between 25 and 175ms. After CNR reaches its maximum at 175ms it gradually decreases. Our findings may be used toward improvement of T2W protocols for diagnosis of prostatic carcinoma.
Purpose:
To investigate the influence of time of echo in T2 weighted (T2W) magnetic resonance imaging (MRI) on the apparent contrast-to-noise ratio (CNR) between malignant and non-malignant prostate tissue.Introduction:
T2W sequence is part of the prostate imaging and data reporting system version2 (PIRADSv2). In general, clinically significant cancers usually appear as hypointense lesions on T2W images. As the T2W signal is echo time dependent, the apparent contrast between a tumour and the neighbouring non-malignant tissue may be different among images acquired at different effective times of echo (TE). To evaluate the perception of the distinct differences between tumours and non-malignant tissues on images, it is useful to measure the corresponding contrast-to-noise ratio (CNR). CNR is defined as the difference of signal intensity between two regions, scaled to image noise. This work has been conducted to investigate the influence of TE of T2W images on the measured CNR between tumours and non-malignant tissues. We were particularly interested to determine whether there is a TE value at which the CNR is maximum.Methods:
12 patients with biopsy proven prostatic carcinoma (PCa) were examined at a 3T scanner prior to undergoing radical prostatectomy. MR signals were acquired with combined endorectal/pelvic phased-array coils. A 3D multi-echo GRASE sequence (TR/TE=3061/25ms,NE=64,FOV=240×240×40mm3,voxel-size=1×1×4mm3,matrix-size=240×240) was used to obtain T2W images at different TEs. In total, 30 slices that contained both non-malignant tissue and tumours with cross-sectional area≥100mm2 were selected for data analysis. Average values of signal intensity were calculated within tumour and non-malignant regions-of-interest (ROIs) manually outlined on digitized whole-mount histology sections registered to MR images. The ROIs were only selected from peripheral-zone (PZ) due to limited number of transition-zone (TZ) tumours among the acquired data set. Standard deviation of noise was calculated from ROIs manually outlined in the area outside the body(air). For each T2W image, the CNR was calculated by subtracting the average signal intensity within tumour ROI from the average signal intensity within non-malignant ROI and dividing the result by the standard deviation of noise. Curves of CNR as a function of TE were generated for each individual slice. The individual curves were then added and averaged to generate the curve of average CNR as a function of TE.Results:
Representative T2W images and the corresponding histology sections are presented in Figure1. The graph of average CNR versus TE is presented in Figure2. Our results demonstrate that CNR increases abruptly from -10 to 110 for TEs between 25 and 175ms. The maximum CNR occurs at TE=175ms. After reaching its peak value, CNR gradually decreases to a minimum of 10 at 1600ms.Discussion & Conclusions:
In this study, we investigated the influence of TE in T2W on the CNR between malignant and non-malignant tissues. Our results must be interpreted with caution as the analyzed data were sampled from a limited range of tumour grades (Gleason pattern≥4+3). Although we can expect a similar rise-fall pattern in CNR for other tumour grades, the location of the peak might be different for different grades. Therefore, when interpreting our results, we focus on the variation pattern of CNR as a function of TE, rather than the location of its peak value. To optimize the CNR for all tumour grades, a study involving a larger number of patients and broader range of Gleason scores is needed. Another limitation of this study is that its data and findings lend themselves only to PZ, for which T2W is not the dominant sequence in the PIRADSv2, but still helpful in providing overall score, particularly for caveats. Performing similar analyses in TZ could lead to a more significant contribution, as T2W is the dominant sequence for scoring TZ lesions in PIRADSv2. To expand this study to TZ, more patient data should be included, because the prevalence of tumours in TZ is much less compared to PZ. Another limitation to be noted is that in this study noise calculation was performed using a simplistic approach. As our imaging involved sensitivity encoding, the noise had spatial dependence and a more accurate estimation of noise could have been performed by considering this effect. Such complex estimation was not implemented in this study; however, more accurate noise estimate will result in a different scale factor on the CNR vs TE graph, and would likely not affect the overall findings of this study. In conclusion, in this work we characterized the dependence of CNR on the TE of T2W imaging, and we showed that there is a TE that maximises the CNR. This result may have important implications in clinical settings as acquiring T2W images with optimal TE may provide a significant improvement in the detectability of tumours and improve the sensitivity of diagnosis of PCa.Acknowledgements
This study has been supported by the Canadian Institutes of Health Research.References
1. PI-RADS. Prostate Imaging Reporting and Data System, Version2. American College of Radiology Website. 2015. Retrieved on 19/04/2017 from http:/ ̴ /www.acr.org//media/ACR/Documents/PDF/QualitySafety/Resources/PIRADS/PIRADS%20V2.pdfFigures
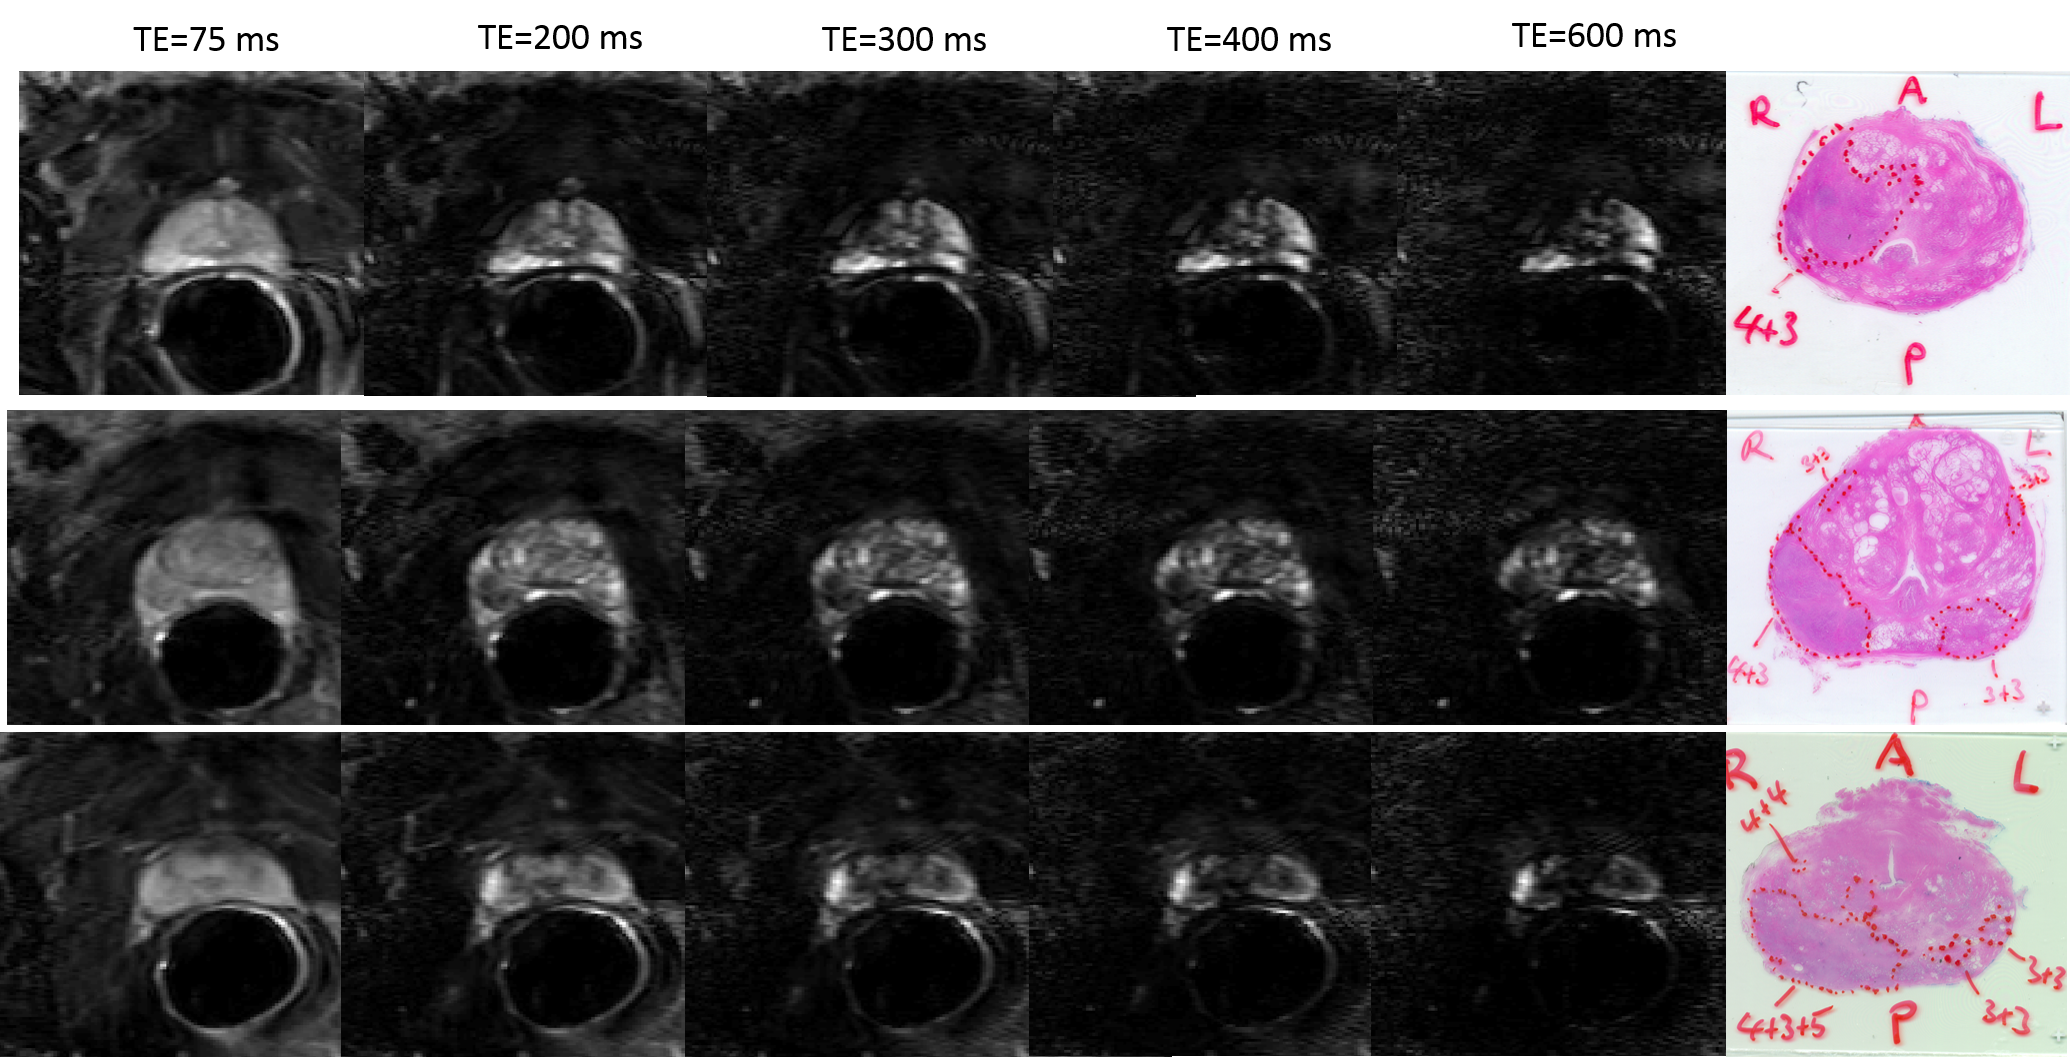
Figure 1. Representative T2W images, and histology
whole-mount section of the same slice.
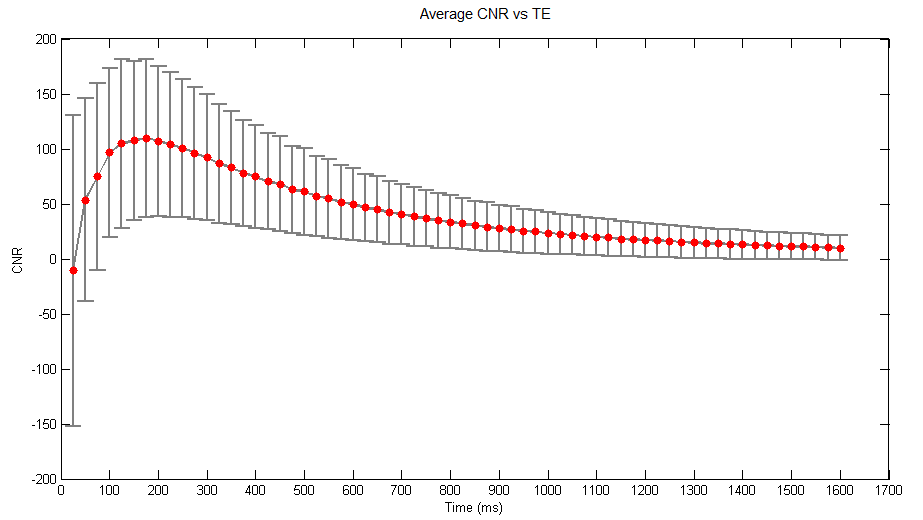
Figure 2. The graph of average
contrast-to-noise ratio (CNR) as a function of time of echo (TE). The vertical
error bars represent standard deviation from the mean CNR.