2550
Model-based volumetric T2 mapping of the liverJeong Hee Yoon1, Yohan Son2, Berthold Kiefer3, and Jeong Min Lee1
1Seoul National University Hospital, Seoul, Republic of Korea, 2Siemens Healthcare Korea, Seoul, Republic of Korea, 3Siemens Healthcare, Erlangen, Germany
Synopsis
T2 relaxation time estimation is able to aid liver tissue characterization by providing quantitative information of the tissue.
Introduction
Relaxometry and stiffness imaging have been increasingly used to grade fibrosis in liver imaging. However, inflammation is one of the confounding factors of liver fibrosis assessment, and the separation of inflammation from fibrosis would be clinically valuable. T2 relaxometry has been performed for cardiac imaging for assessment of the tissue edema (1), but it has been occasionally attempted for abdominal imaging due to prolonged scan time. Thus, the purpose of this study is to investigate the value of T2 relaxation time to assess inflammation in the liver, using model-based volumetric T2 map (2).Methods
In this prospective study, 35 patients (M:F =19:16, mean age 58.9±7.2 years) with liver cirrhosis who underwent liver MRI including T2 map were enrolled. All examinations were done at 3T scanner (MAGNETOM Skyra, Siemens Healthcare, Erlangen, Germany). Sixteen slices of T2 map were generated from following scan parameters: FOV 350-380; TR 3591msec; ETL, 16; pace triggering; acceleration factor, 5; matrix 200x180. Eight to ten regions of interest (ROIs, area: 100mm2-160mm2) were drawn in the liver right lobe on a T2 map, and the mean value was considered as a representative value of a patient. In addition, the Child-Pugh classification, and serum liver function test results were also checked.Results and Discussion
There were 21 patients with Child-Pugh class A, and 14 patients with Child-Pugh class B. There were three patients with iron deposition on dual-echo images, and their T2 relaxation time was significantly lower than those without iron deposition (385.9±22.5 msec vs. 518.0±76.5 msec, P=0.006). In 32 patients without gross iron deposition, T2 values did not show a significant difference between twenty patients with Child A and twelve patients with Child B (508.2±60.8 msec vs. 534.3±98.3 msec, P=0.36). However, patients with elevated aspartate transaminase (AST) level (n=9, > 40IU/L) showed a significantly prolonged T2 relaxation time than those with normal range of AST (562.2±74.0 msec vs. 500.6±71.8 msec, P=0.038). Although the cause of AST elevation can vary, but the elevation of the enzyme would indicate inflamed or injured liver cells in patients with chronic liver disease. The prolonged T2 relaxation time is thought to reflect increased water content, which can be found in inflammatory condition.Conclusion
T2 relaxation time of the liver may provide the information of active inflammation in patients with hepatic fibrosis.Acknowledgements
No acknowledgement found.References
1. Verhaert D et al, Direct T2 quantification of myocardial edema in acute ischemic injury. JACC 2011;4(3):269-278
2. Sumpf T et al, “Model-based nonlinear inverse reconstruction for T2 mapping using highly undersampled spin-echo MRI”, Journal of Magnetic Resonance Imaging JMRI 34(2):420-8, 2011
Figures
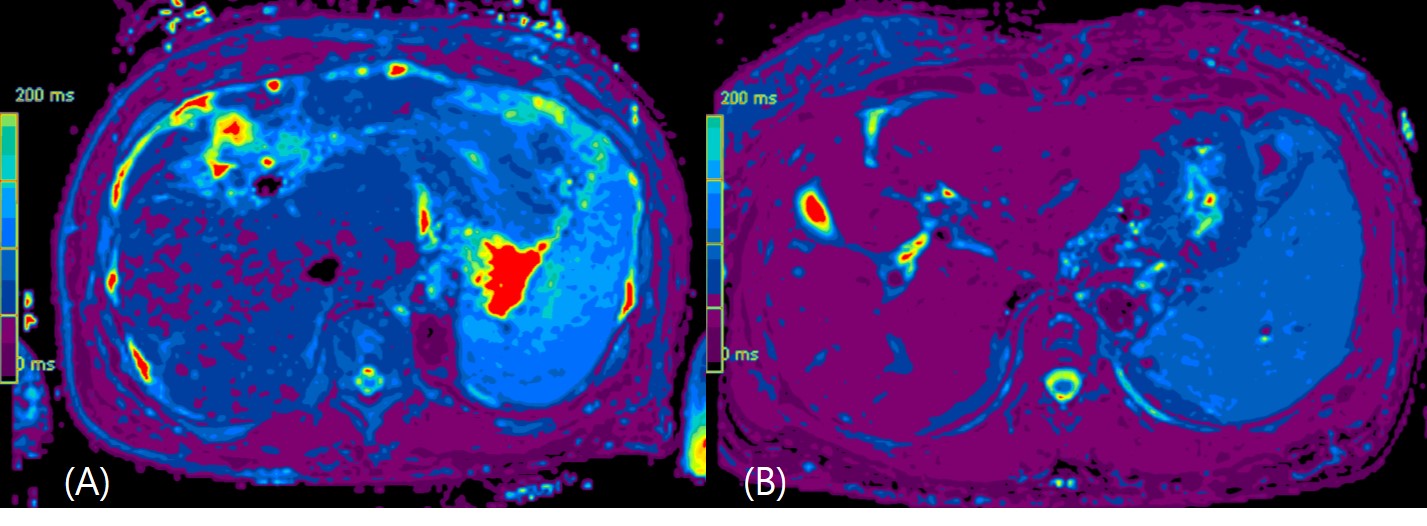
T2
maps of two patients. (A) T2 map of a 61-year-old man with elevated AST level
(50IU/L). T2 relaxation time was 631.8msec. (B) T2 map of a 56-year old woman
with normal AST level (21IU/L), and the T2 relaxation time was 440.8msec.