2549
Vessel Size Imaging for Liver Fibrosis Staging Based on Dynamic Susceptibility Contrast Using SE/GRE-EPI Sequence:Comparison with US Elastography and Histopathological Correlation1Radiology, Ruijin Hospital, Shanghai Jiaotong University School of Medcine, Shanghai, China, 2Philips Healthcare, Shanghai, China, 3Institute of Science and Technology for Brain-Inspired Intelligence, Shanghai, China
Synopsis
The study investigated the value of vessel size imaging (VSI) based on dynamic susceptibility contrast using SE/GRE-EPI sequence for liver fibrosis staging, compared with US elastography and correlated with histopathological results. We found that VVF and Nu value based on VSI were independent predicative factors of liver fibrosis (R2=0.566,P=0.002). They had correlation with hepatic sinusoidal structures including parenchymal area (PA), sinusoidal area (SA), hepatocyte area (HA), sinusoidal perimeter (SP), SA/SP ratio, SA/SP index, and HA/SP index. Microvessel density (MVDdensity) and area (MVDarea). VSI has potential for liver fibrosis staging with good diagnostic capability similar to US elastography.
Purpose
To investigate the value of vessel size imaging (VSI) based on dynamic susceptibility contrast using SE/GRE-EPI sequence for liver fibrosis staging and compare with US elastography for liver fibrosis staging and correlate with histopathological results.Methods
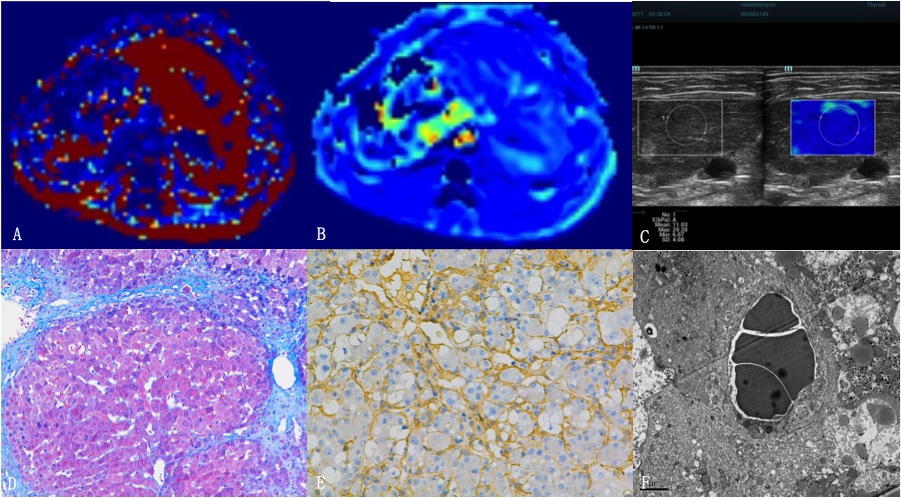
Fifty-five rabbit models of CCl4-induced liver fibrosis were established and six untreated rabbits served as controls. VSI and 2D shear-wave elastography (SWE) examinations were successfully performed at 2, 4, 6, 8, 10, and 12 weeks. VSI quantitative parameter (Q、VVF、Nu、mVD) and liver stiffness (LSARFI and LSSWE) were measured.
Fibrosis was staged according to the METAVIR scoring system. Morphometrical data of sinusoidal structure were measured based on HE staining specimen, including parenchymal area (PA), sinusoidal area (SA), hepatocyte area (HA), sinusoidal perimeter (SP), SA/SP ratio, SA/SP index, and HA/SP index. Microvessel density (MVDdensity) and area (MVDarea) were counted using α-SMA immunochemical staining.
Spearman correlation analysis was performed between Q、VVF、Nu、mVD and fibrosis stage. Multiple variance logistic regression analysis was performed to determine independent predicative factors of liver fibrosis. Pearson correlation analysis was performed between VSI parameters and PA、SA、HA、SP、SA/PA、SA/SP index、HA/SP index. Receiver operating characteristic (ROC) analysis was performed for assessing diagnostic performance of VSI, SWE, and combination set in detection of significant fibrosis (≥F2), advanced fibrosis (≥F3), and cirrhosis (F4).
Results
Q, VVF, and Nu showed moderate to significant correlation with fibrosis stage (r=0.614, -0.609, and 0.504, respectively; P=0.0001, 0.0001, and 0.0015, respectively). Multiple variance logistic regression analysis demonstrated that VVF and Nu were independent predicative factors of liver fibrosis (R2=0.566,P=0.002). VVF showed significant correlation with SA、SA%、SP(r=0.627~0.642, P=0.000)and moderate correlation with HA/SP(r=-0.467, P=0.004). Nu showed moderate correlation with SA、SP、HA/SP(r=-0.490~-0.418, P=0.002~0.01).
VVF had sensitivity of 90.32%, 70.83%, 73.68, specificity of 83.33%, 100%, 83.33, and AUROCs of 0.911, 0.897, 0.839(P<0.0001)for diagnosis of F1 to F3, respectively, but failed to detect F4 fibrosis (AUROC=0.636,P=0.2296). Nu had sensitivity of 80.65%, 75.00%, 84.21% and 85.71%, specificity of 83.33%, 69.23%, 66.67% and 70.00%, and AUROCs of 0.823, 0.702, 0.760, 0.7719 for diagnosis of F1 to F4(P<0.05). There was no significant difference between AUROC of Nu and that of SWE for diagnosis of F2 to F4 (P= 0.2495, 0.5949, 0.4943, and 0.8302, respectively). Combination of VSI and SWE had a sensitivity of 95.65%, 73.68%, and 100%, specificity of 66.67%, 78.57%, and 42.31%, AUROC of 0.812, 0.761, and 0.712, respectively. There was no significant difference among AUROC of VVF, SWE, and combination set(P=0.4532~1.000).
Conclusion
VSI has potential for liver fibrosis staging based on progressive changes of hepatic sinusoidal structures with good diagnostic capability similar to ultrasonography elastography.Acknowledgements
No acknowledgement found.References
1. Tang A, Cloutier G, Szeverenyi NM, et al.Ultrasound Elastography and MR Elastography for Assessing Liver Fibrosis: Part 1, Principles and Techniques.AJR Am J Roentgenol.2015;205(1):22-32.
2. Tang A, Cloutier G, Szeverenyi NM, et al.Ultrasound Elastography and MR Elastography for Assessing Liver Fibrosis: Part 2, Diagnostic Performance, Confounders, and Future Directions.AJR Am J Roentgenol.2015;205(1):33-40.
3. Ferraioli G, Tinelli C, Dal Bello B, et al.Accuracy of real-time shear wave elastography for assessing liver fibrosis in chronic hepatitis C: a pilot study.Hepatology.2012;56(6):2125-33.
4. Persigehl T, Ring J, Budny T, et al.Vessel size imaging (VSI) by robust magnetic resonance (MR) relaxometry: MR-VSI of solid tumors in correlation with immunohistology and intravital microscopy.Mol Imaging.2013;12(7):1-11.
5. Ungersma SE, Pacheco G, Ho C, et al.Vessel imaging with viable tumor analysis for quantification of tumor angiogenesis.Magn Reson Med.2010;63(6):1637-47.
6. Kwon HJ, Shim WH, Cho G, et al.Simultaneous evaluation of vascular morphology, blood volume and transvascular permeability using SPION-based, dual-contrast MRI: imaging optimization and feasibility test.NMR Biomed.2015;28(6):624-32.
7. Pannetier N, Lemasson B, Christen T, et al.Vessel size index measurements in a rat model of glioma: comparison of the dynamic (Gd) and steady-state (iron-oxide) susceptibility contrast MRI approaches.NMR Biomed. 2012;25(2):218-26.
8. Donahue KM, Krouwer HG, Rand SD, et al.Utility of simultaneously acquired gradient-echo and spin-echo cerebral blood volume and morphology maps in brain tumor patients.Magn Reson Med.2000;43(6):845-53.
9. Kim SG, Harel N, Jin T, et al.Cerebral blood volume MRI with intravascular superparamagnetic iron oxide nanoparticles.NMR Biomed.2013;26(8):949-62.
10. Lemasson B, Valable S, Farion R, et al.In vivo imaging of vessel diameter, size, and density: a comparative study between MRI and histology.Magn Reson Med.2013;69(1):18-26.
11. Kording F, Weidensteiner C, Zwick S, et al.Simultaneous assessment of vessel size index, relative blood volume, and vessel permeability in a mouse brain tumor model using a combined spin echo gradient echo echo-planar imaging sequence and viable tumor analysis.J Magn Reson Imaging.2014;40(6):1310-8.
12. Persigehl T, Ring J, Budny T, et al.Vessel size imaging (VSI) by robust magnetic resonance (MR) relaxometry: MR-VSI of solid tumors in correlation with immunohistology and intravital microscopy.Mol Imaging.2013;12(7):1-11.
Figures