2548
Amide Proton Transfer (APT) MR imaging and Magnetization Transfer (MT) MR imaging of liver cirrhosis: a clinical feasibility study1Shandong Medical Imaging Research Institute, Jinan, China, 2Department of Radiology, Johns Hopkins University School of Medicine, Baltimore, MD, United States, 3Center for Brain Imaging Science and Technology, Department of Biomedical Engineering, Zhejiang University, Hangzhou, China, 4Philips Healthcare, Shanghai, China
Synopsis
This study aimed to demonstrate the feasibility of the APT and MT MR imaging in depicting the liver cirrhosis at 3.0T. We compared MTR and APTw values in 11 healthy livers and 8 liver cirrhosis. The patients with liver cirrhosis showed a lower APTw values than healthy volunteers indicating APT imaging detectable mobile protein levels in the liver tissues. The patients with liver cirrhosis exhibited a higher MTR values than the healthy volunteers. Liver cirrhosis exhibited a significantly higher MTR, indicating indicating a higher concentration of biochemistry components in liver cirrhosis. We have shown that it is clinically feasible to perform APT and MT MR imaging of liver cirrhosis.
Introduction/Purpose
Liver cirrhosis is an abnormal liver condition that liver experiences irreversible scarring. Once the injury has happened, the liver would repair it through the deposition of collagen, proteoglycans, and other macromolecules in the extracellular matrix[1]. The risk of liver cancer is greatly increased once cirrhosis develops, and therefore cirrhosis should be considered to be a pre-malignant condition. Amide proton transfer (APT) imaging is a specific form of CEST imaging based on chemical exchange of amide protons without exogenous contrast agents[2], and it shows the great advantages of high specificity to certain biochemistry components such as protein, glycosaminoglycan, glycogen etc. The magnetization transfer (MT) contrast is based on the interaction between semi-solid macromolecular protons and the free water protons of tissue[3]. The objective of this study was to assess whether APT and MT imaging is capable of depicting the liver cirrhosis at 3.0T.Materials and methods
A total of 11 healthy volunteers (5M/6F, age: 27 yrs.) and 8 patients with liver cirrhosis (5M/3F, age: 51 yrs.) have been enrolled in this study. The APT/MT imaging data acquisition was performed on a 3T scanner (Philips Healthcare), using a 2D SE sequence. The imaging parameters were the following: TR/TE = 3000/6.52ms, echo train length=58, slice thickness = 9 mm, voxel size = 3×3 mm2, acquisition time =3min 6sec. All of the APTw-MRI data were analyzed by the interactive data language (IDL 8.3; Exelis Visual Information Solutions, Inc., Boulder, Colorado, USA). The magnetization transfer ratio (MTR) values and APT-weigthted(APTw) values were calculated from a region of interest drawn on liver tissues. Student t-test was used to compare MTR and APTw values in healthy livers and liver cirrhosis regions. Statistical significance was considered at p < 0.05.Results and Discussion
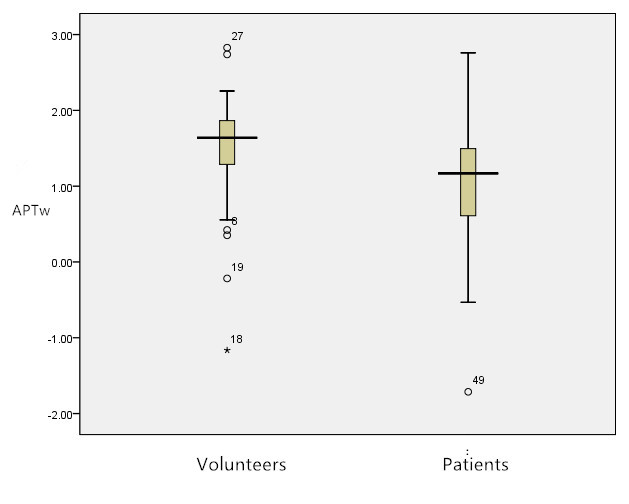
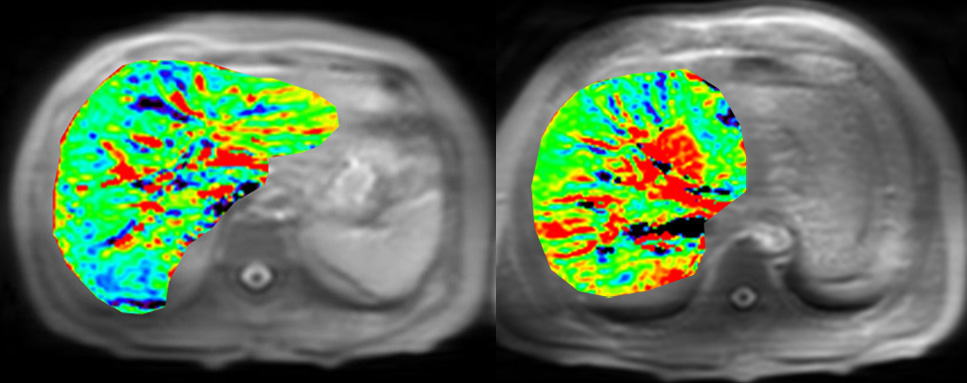
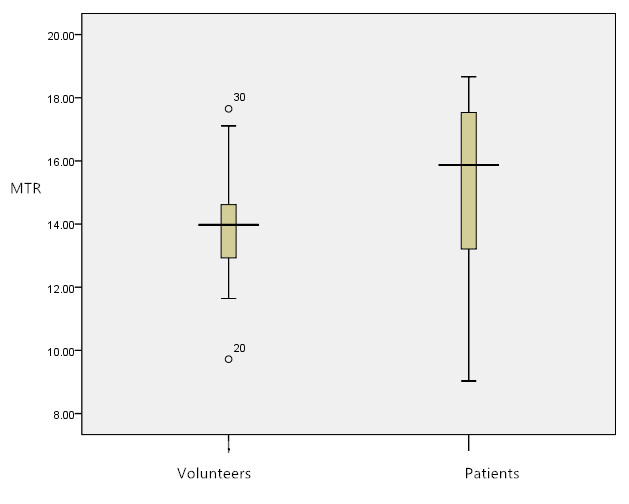
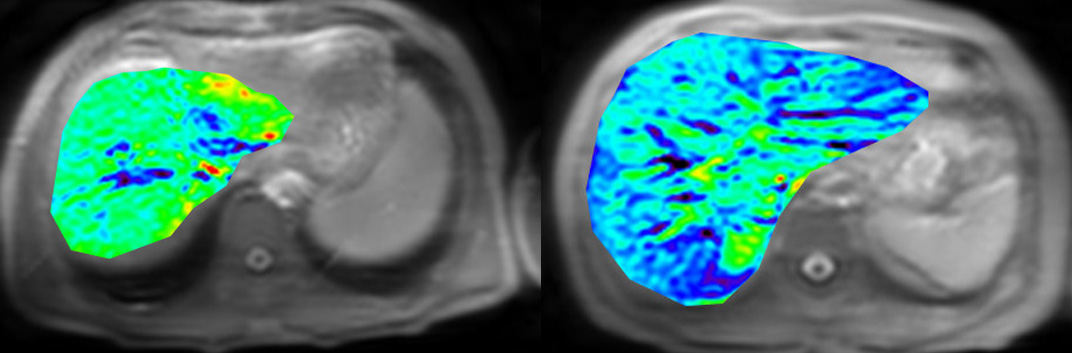
The patients with liver cirrhosis showed significant lower APTw values than healthy volunteers (0.94±0.45vs. 1.46±0.56, P=0.03, Figure 1) indicating APT imaging detectable mobile protein levels in the liver tissues. Figure 2 shows the representative APTw images acquired from a pair of a volunteer and a liver cirrhosis patient. Based on Figure 2, the APTw signal intensities decreased in liver cirrhosis. The patients with liver cirrhosis exhibited a higher MTR values than the healthy volunteers (15.3±1.76 vs. 13.95±1.68, p = 0.026, Figure 3) indicating a higher concentration of biochemistry components in liver cirrhosis. Figures 4 shows the representative MTR images acquired from a volunteer and a liver cirrhosis patient. Based on Figure 4, the MTR signal intensities increased in the parenchyma of liver cirrhosis.Conclusion
We have shown that it is clinically feasible to perform APT and MT MR imaging of liver, and liver cirrhosis exhibited lower APTw values and higher MTR values. Further experiments are necessary to assess the stability and reproducibility of the results.Acknowledgements
No acknowledgement found.References
1. Pellicoro A, et al., Nat Rev Immunol, 14(3),181-194(2014).
2. Zhou J, et al., Nat Med, 9(8):1085-90 (2003).
3. Henkelman RM, et al., NMR Biomed 14:57–64(2001).
Figures