2547
Evaluating of segmental liver function by using Gd-EOB-DTPA-enhanced MRI1Department of Radiology,the Third People’s Hospital of Nantong, Nantong, China
Synopsis
The aim of this study is to investigate the value of Gd-EOB-DTPA-enhanced MRI in evaluating segmental liver function. Statistical analysis was used to evaluate the relationship between the △LMR of each liver segment and liver function,as well as the△LMR of different liver segments. Our quantitative study demonstrated that Gd-EOB-DTPA intake into hepatocytes was strongly affected by liver function .The segmental liver function can be evaluated via Gd-EOB-DTPA-enhanced MRI and calculation of the △LMR may be a novel optional.
Introduction
Assessing regional liver function plays a significant role in clinical practice, especially for surgeons, providing valuable informationto predict postoperative risk after partial liver resection.Gd-EOB-DTPA is the hepatocyte-specific MR contrast agent. It could be transported some 50% doses into hepatocytes after intravenous injection via organic anion transport polypeptide(OATP)on the surface of the liver sinus, and eventually was excreted into the bile through another carrier protein multidrug resistance-associated protein (MRP). Recently,studies have confirmed that gadoxetic acid-enhanced MR imaging of hepatocyte-phase could reflect the function of liver function1-3. However,few research has been performed on segmental liver function evaluation4. The purpose of this study is to investigate the efficiency of Gd-EOB-DTPA-enhanced MRI in evaluating each segment liver function.Methods
A total of 124 patients were classified into the 4 groups: patients with normal liver function(NLF)group (n=21); hepatitis B cirrhosis patients with Child–Pugh A(CPA) group(n=48);hepatitis B cirrhosis patients with Child–Pugh B (CPB) group(n=40);hepatitis B cirrhosis patients with Child–Pugh C(CPC) group(n=15). All patients underwent Gd-EOB-DTPA-enhanced MRI examination according to the clinical needs and the serological examination indicators were obtained within one week before and after the imaging examination.The increase rate of liver muscle signal ratio (△LMR)was calculated the signal intensity of liver parenchyma and erector spinal muscle before(SI pre) and 3min、10min、20 min after (SI post) Gd-EOB-DTPA intravenous administration, using the following formula: LMR=SI(liver)/SI (muscle);△LMR=LMRpost- LMRpre/LMRpre.The one way ANOVA was used to compare the △LMR of each liver segment.Between different liver segments were compared using two way ANOVA considering only the main effect. ROC curve of △LMR was used to analyze the diagnosis efficiency between NLF-CPA and CPB-CPC group.Spearman rank correlation was used to analyzed the correlation of △LMR with Child-Pugh score and model for end-stage liver disease (MELD) score.Results
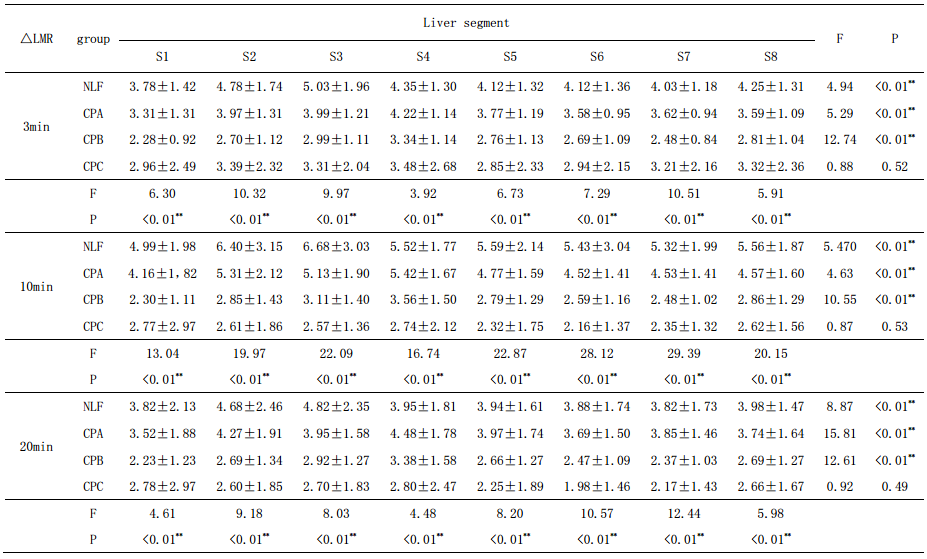
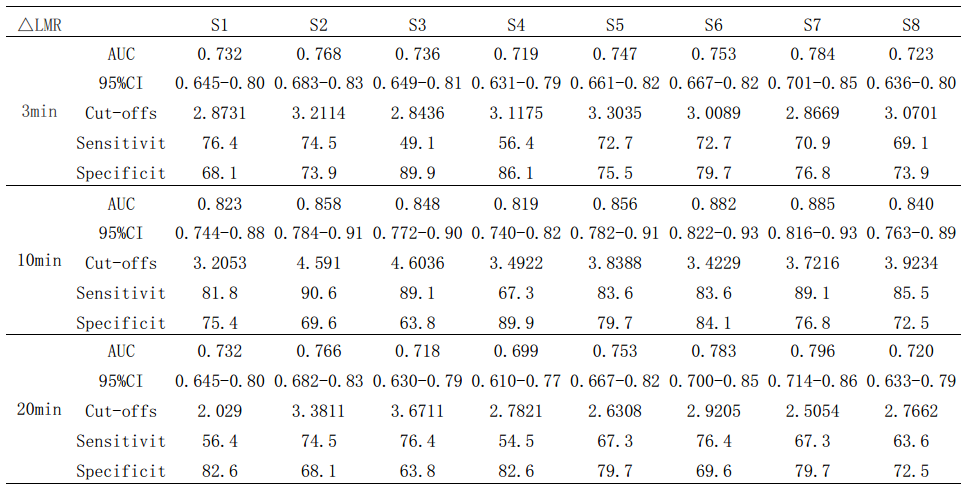
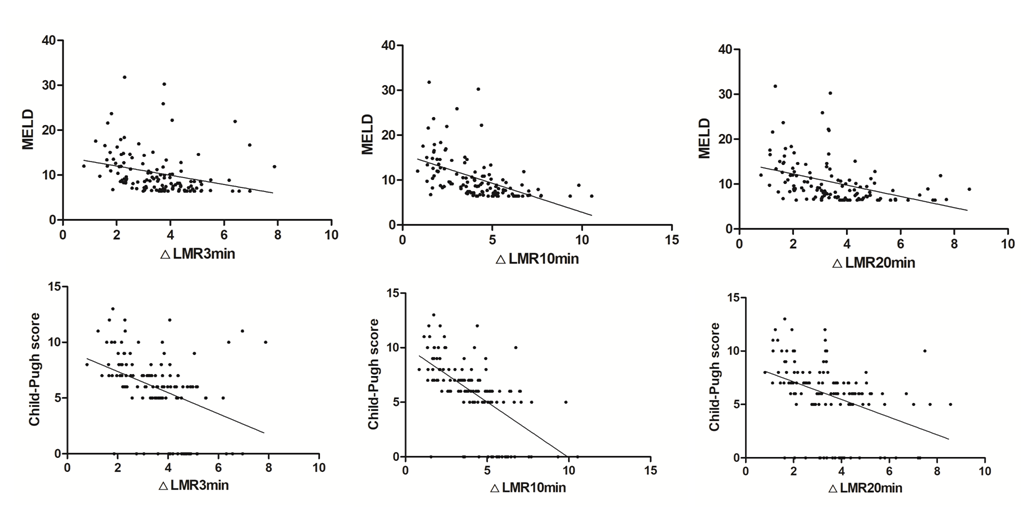
After 3min、10min and 20min injection of Gd-EOB-DTPA,△LMR showed significant difference (P < 0.05) in each liver segment of different groups.The △LMRvaried significantly at different time points of each liver segment in NLF,CPA,CPB group (P < 0.05),but no significant difference in CPC groups(P>0.05)(table1). △LMR of most liver segment showed a decreasing trend with the increase of the degree of impaired liver function,and the trend is more obvious at 10min and 20min after contrast agent administration. Generally,the△LMR values of normal liver function were higher than abnormal liver function group,△LMR values of CPC group is the lowest.The △LMR10min diagnostic efficacy is the highest in NLF-CPA and CPB-CPCgroups(table2). The△LMR had significant negative correlations with Child-Pugh score and MELD score (P < 0.05) (figure1).Discussion
As previously reported that hepatic enhancement with Gd-EOB-DTPA is strongly affected by the degree of liver cirrhosis, which is classified by the Child-Pugh score 5. Gd-EOB-DTPA is the hepatocyte-specific MR contrast agent, absorbed by normal hepatocytes after injecting, and then liver parenchyma shows the high signal. With increasing damage of liver, contrast agent intake was decreased or none and sequent showing low signal in parenchyma. The changes were directly indicated in the signal intensity of liver parenchyma. In our study,we analyzed the△LMR after 3min、10min、20min of Gd-EOB-DTPA enhancement of each liver segment. The △LMR varied significantly at different time points of each liver segment in NLF,CPA,CPB group.There was no significant difference of CPC group between different liver segment.However, the mechanism remained unclear.We hypothesized that the distribution of hepatocytes and bile ducts in liver segments is different, as well as the blood vessels. This difference suggested the changes in the△LMR. Severe damage and relatively equal on the liver function of CPC group could explained the phenomenon. Based on clinical demand, we put NLF and CPA inNLF-CPA group in which the patients could get better prognosis, but CPB and CPC in CPB-CPC group whose prognosis were poor. The ROC curve was used for further analysis between the two groups.In our study, △LMR used to examine the diagnostic efficiency of between NLF-CPA and CPB-CPC groups of each segmentat different time points. At 10min after injection,the AUC of △LMRwas above 0.8,some segment is close to 0.9.It demonstrated that the △LMR at 10min may be efficient for evaluation of liver function.Conclusion
This study showed that Gd-EOB-DTPA intake into hepatocytes was strongly affected by liver function.Segmental liver function could be efficiently evaluated byGd-EOB-DTPA-enhanced MRI.Acknowledgements
No acknowledgement found.References
1. Motosugi U, Ichikawa T, Sou H, Sano K, Tominaga L, Kitamura T,et al. Liver parenchymal enhancement of hepatocyte-phase images inGd-EOB-DTPA-enhanced MR imaging: which biological markers ofthe liver function affect the enhancement[J]? J Magn Reson Imaging .2009,30(5):1042–6.
2. Haimerl M, Verloh N, Zeman F, et al. Gd-EOB-DTPA-enhanced MRI for evaluation of Liver function: Comparison between signal-intensity-based indices and T1 relaxometry[J]. Sci Rep, 2017,7:43347.
3. Verloh N , Haimerl M, Zeman F, et al.Assessing liver function by liver enhancement during the hepatobiliary phase with Gd-EOB-DTPA-enhanced MRI at 3 Tesla [J]. EurRadiol. 2014,24(5):1013-9.
4. ZP Zhou ,LL Long ,WJ Qiu ,et al. Evaluating segmental liver function usingT1 mapping on Gd-EOB-DTPA-enhancedMRI with a 3.0 Tesla [J]. BMC Med Imaging. 2017,17(1):20.
5. Verloh N, Haimerl M, Rennert J et al Impact of liver cirrhosison liver enhancement at Gd-EOB-DTPA enhanced MRI at 3Tesla[J].Eur J Radiol .2013,82(10):1710–1715.
Figures