2545
MRI in the evaluation of liver involvement in pediatric patients with cystic fibrosis1Medical Physics, University of Wisconsin, Madison, WI, United States, 2Radiology, University of Wisconsin, Madison, WI, United States, 3Radiology, Texas Children's Hospital, Houston, TX, United States
Synopsis
In this prospective study of 15 pediatric cystic fibrosis subjects, we show that non-sedated comprehensive quantitative liver MRI is feasible. Furthermore, free-breathing 2D IDEAL IQ outperformed breath-held 3D IDEAL IQ in both image quality and repeatability of proton density fat fraction. Short term 1-2 week repeatability of MR elastography stiffness measurements were comparable with ultrasound elastography. Quantitative liver MRI in the pediatric cystic fibrosis population offers the ability to visualize structure and quantify hepatic steatosis and liver stiffness in a single exam.
Introduction
MRI offers the potential of more comprehensive and quantitative evaluation of cystic fibrosis (CF) related liver disease (CFLD) than ultrasound (US) because of its ability to evaluate the biliary tree and quantify both hepatic steatosis and liver stiffness during a single examination.Purpose
Evaluate the feasibility and repeatability of performing quantitative liver MRI to identify CFLD in pediatric patients age 5-17.Methods
In this IRB-approved, HIPAA-compliant prospective study, we recruited 15 pediatric subjects with known CF (5:10 M:F, age: 5-15 years) who underwent two study visits separated by 1-2 weeks.
All subjects underwent MRI and US imaging at each visit. Liver and upper abdomen grayscale US images and ultrasound elastography (USE) of the liver were acquired on a state-of-the-art ultrasound machine (SSI Aixplorer) with a 2D probe1. Ten measurements were made in the right hepatic lobe within 5 cm of the skin surface, with the patient supine and in suspended respiration.
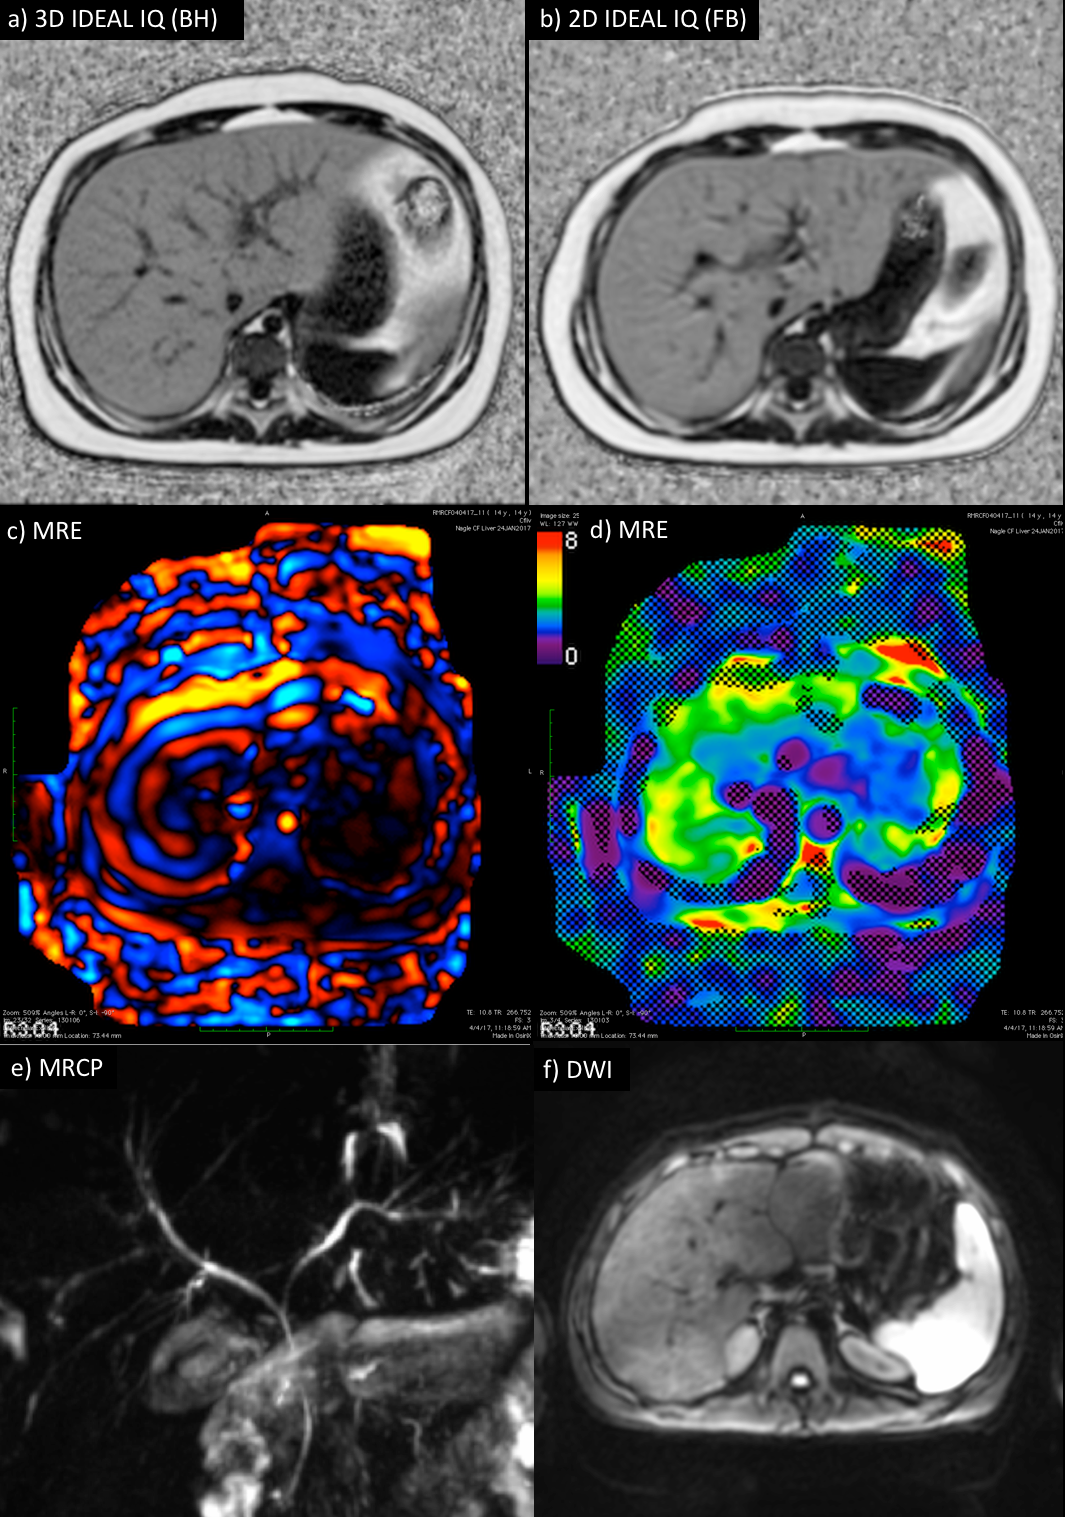
MRI was performed on a 3.0T clinical MRI system (Discovery MR750, GE Healthcare) using a 32-channel phased-array cardiac coil. Acquisitions included breath-held 3D IDEAL IQ acquisition2, free-breathing 2D IDEAL IQ acquisition3, breath-held MR Elastography (MRE)4, respiratory gated 3D Magnetic resonance cholangiopancreatography (MRCP), and breath held diffusion weighted imaging (DWI). All MRI acquisitions were performed twice during each visit.
In order to assess clinical usefulness for obtaining reliable measurements and diagnoses, two radiologists independently evaluated all MRI images and a third radiologist evaluated US images on a 4 point scale – 1: Poor (Non-diagnostic), 2: Fair (Limited diagnostic value), 3: Good (Diagnostic), 4: Excellent (Diagnostic with high degree of confidence).
Regions of Interest (ROI) measurements were performed in each liver segment on all IDEAL IQ scans and then averaged to determine an average proton density fat fraction (PDFF) percentage of the liver5. ROI measurements were performed on MRE to provide a liver stiffness value in kPa.
Image quality scores were combined to create a binary score (1,2 = non-diagnostic, 3,4 = diagnostic), and a 95% one-sided Wilson binomial confidence interval was used to assess clinical usefulness scores. Bland-Altman analysis of same-day and inter-day repeatability was performed.
Results
All but 2 subjects completed both visits (86%). One subject (age 6) dropped out during the second visit and the other (age 5) dropped out during the first visit.
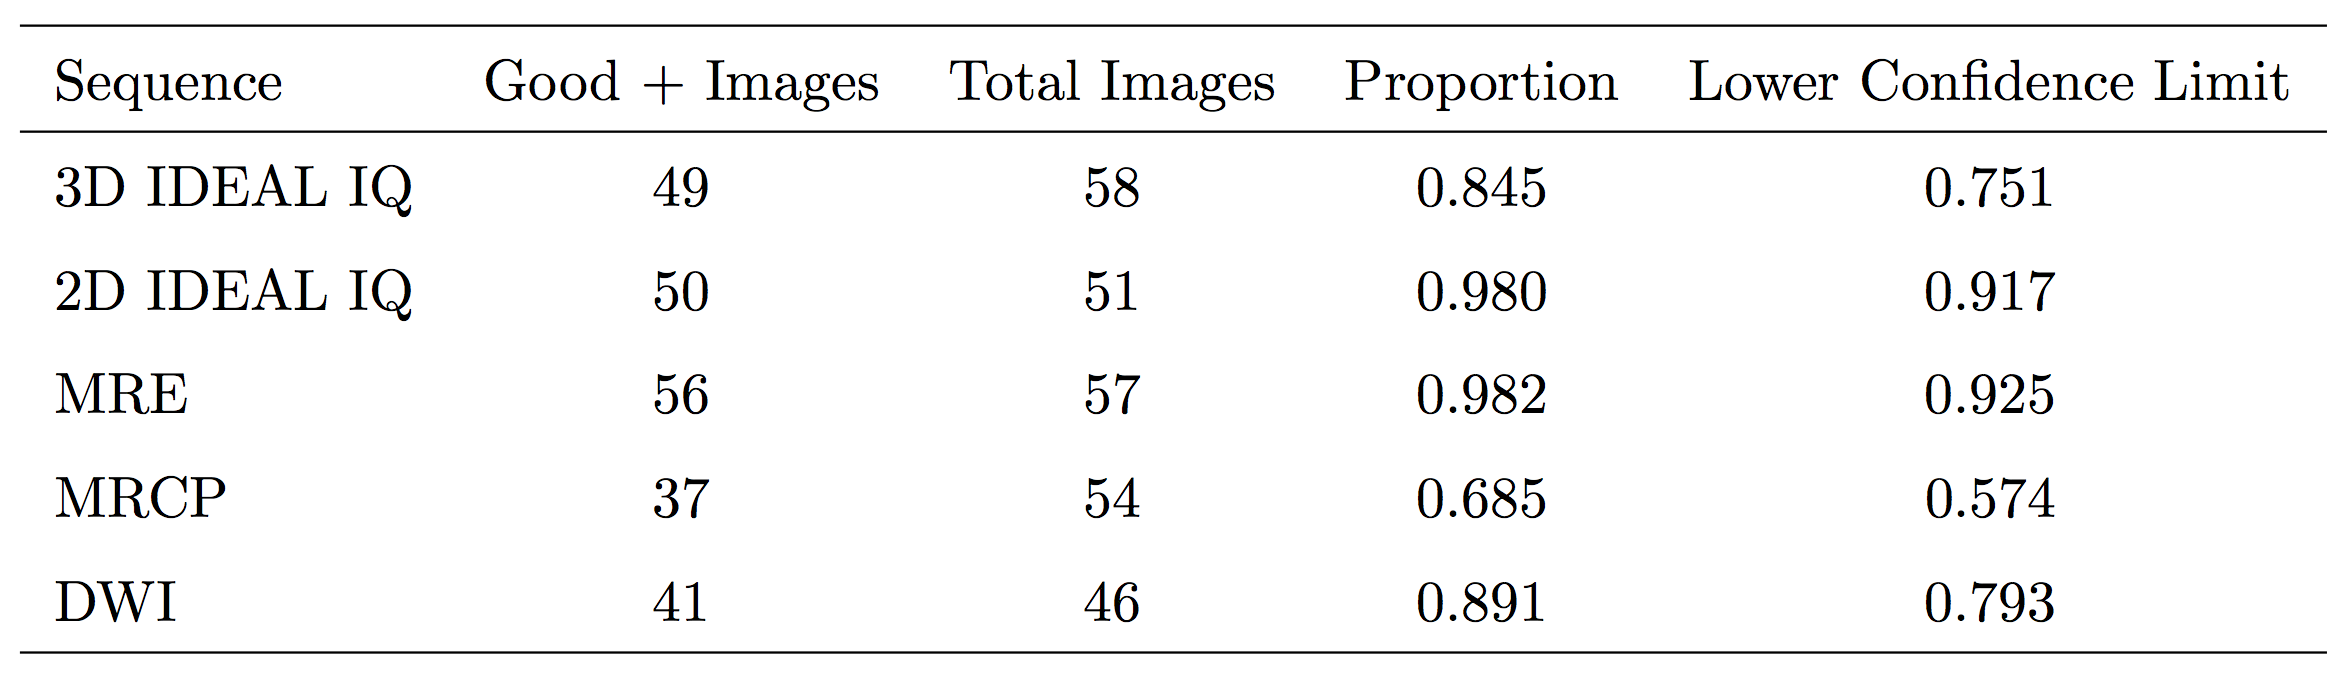
Figure 1 shows the proportion of each image ranked as clinically useful. 2D IDEAL IQ (98%) and MRE (98%) had the most clinically useful images, followed by DWI (89%), 3D IDEAL IQ (84%), and MRCP (68%). Figure 2 shows examples of clinically useful images for each sequence. There were two abnormal cases identified from the MRI images: a subject with a fatty liver (fat fraction: 41%) and a subject with cirrhosis of the liver (stiffness: 4.4 kPa).
The average measured PDFF over all subjects was 7.5% ± 9.6% for 3D IDEAL IQ and 7.8% ± 9.8% for 2D IDEAL IQ. The average measured liver stiffness over all subjects was 3.1 kPa ± 0.7 kPa.
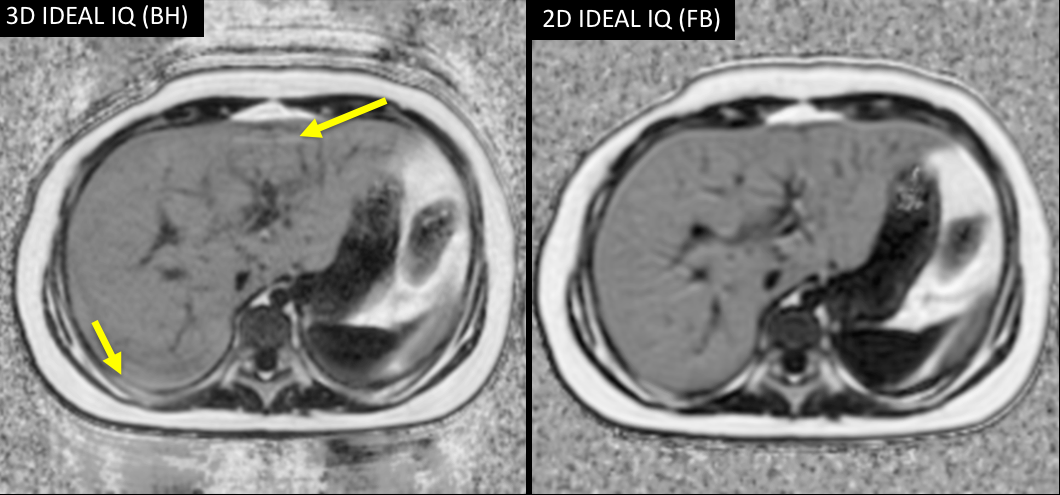
Free-breathing 2D IDEAL produced higher quality images in this population than breath-held IDEAL 3D (Figure 3). 2D IDEAL IQ had a higher percentage of images ranked as diagnostically excellent compared to 3D IDEAL IQ (84% and 69%), likely due to the fact that it did not require breath-holds.
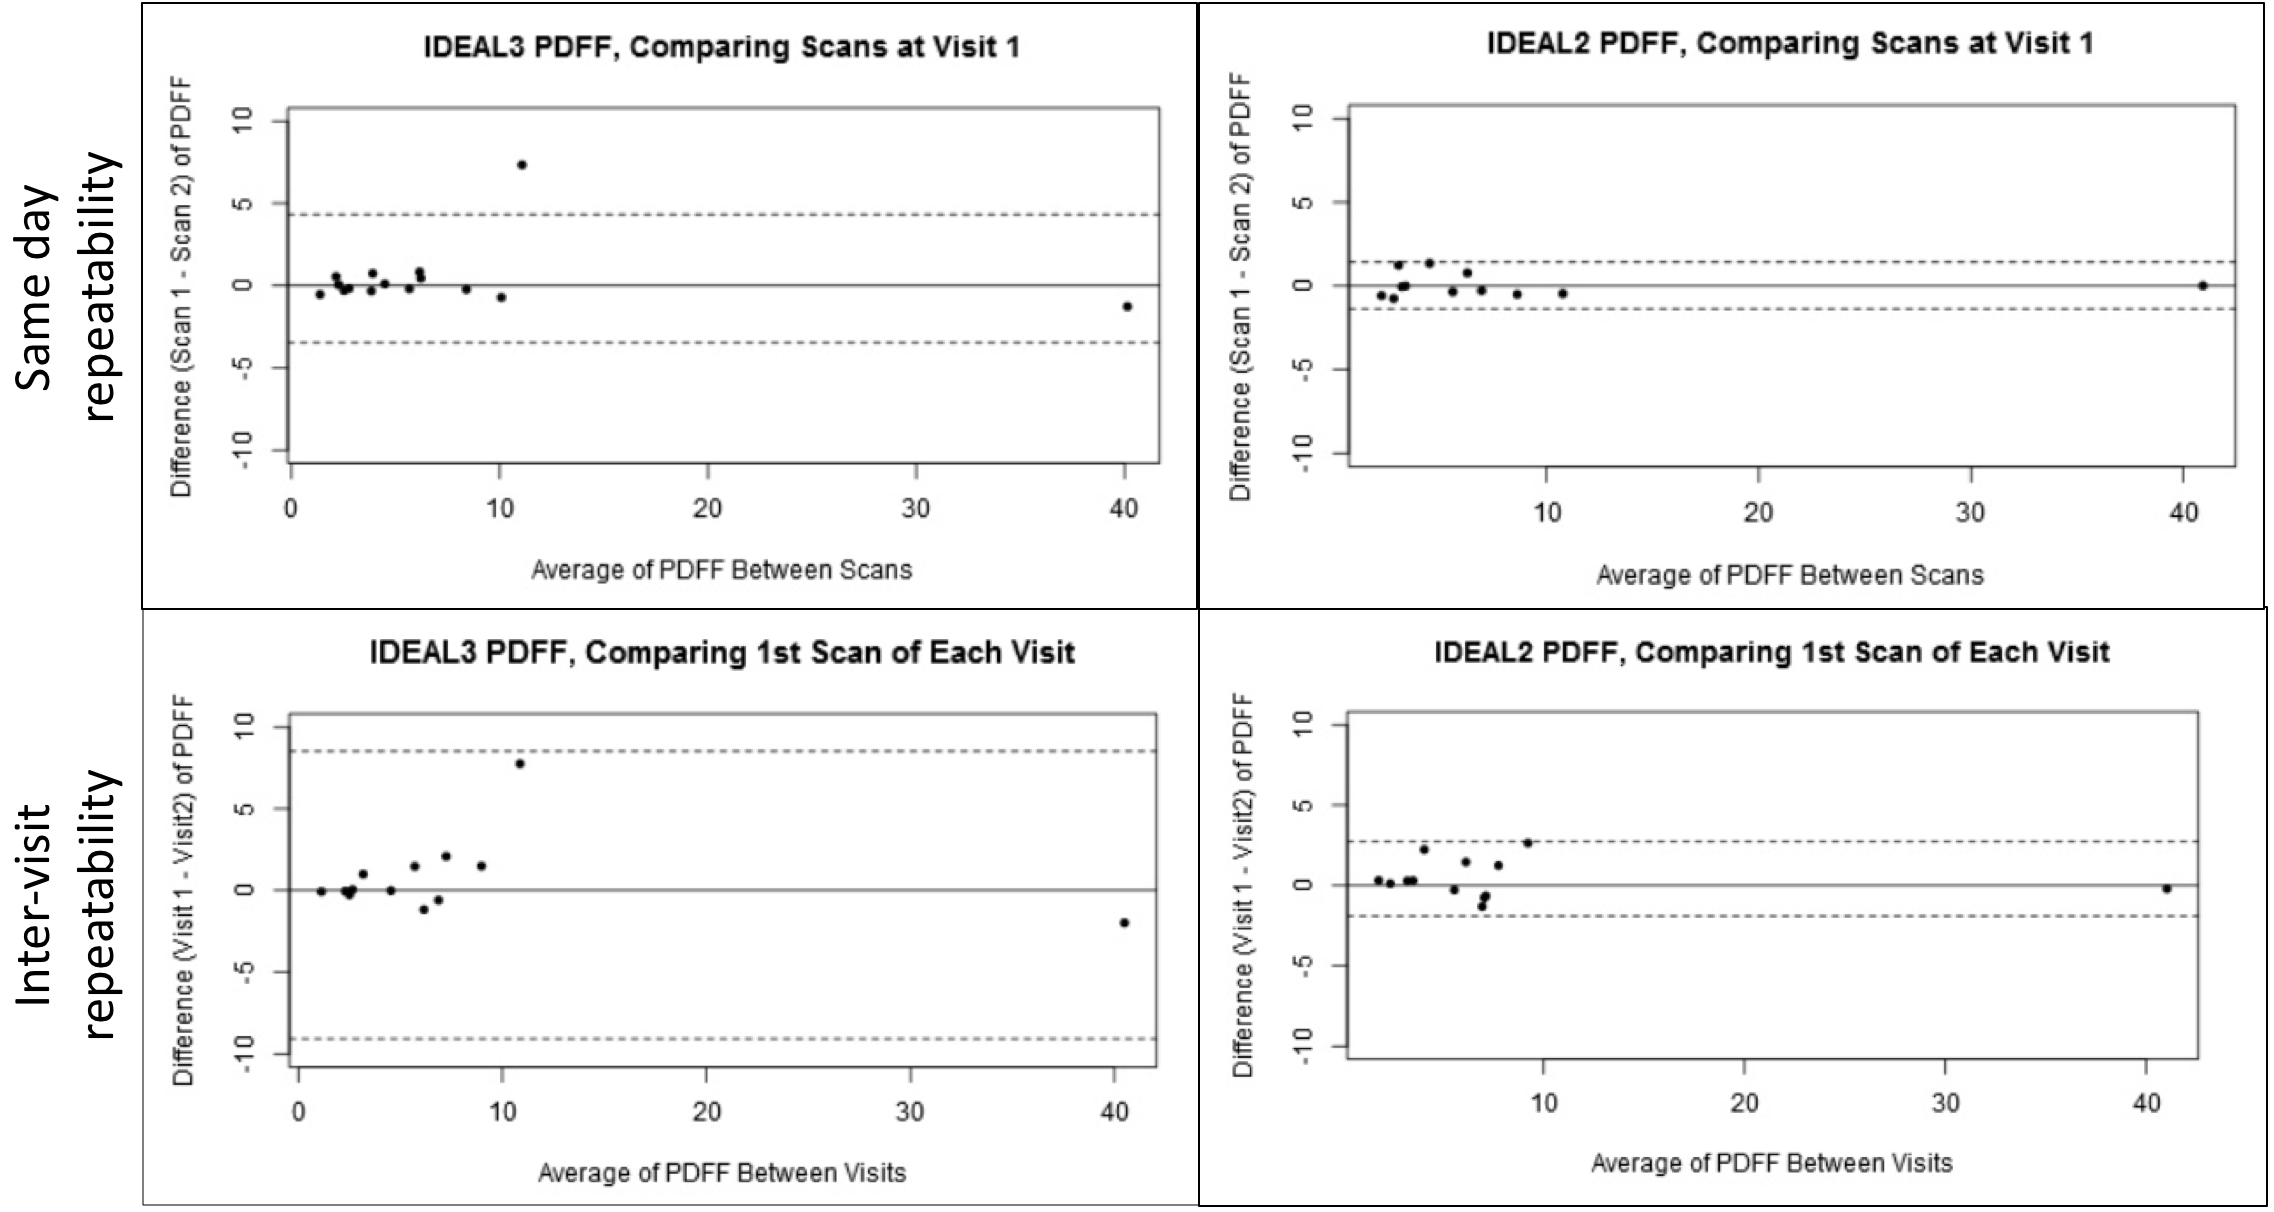
Figure 4 shows Bland-Altman plots of quantitative measurements from same-day and inter-visit IDEAL IQ acquisitions. 2D IDEAL IQ had tighter limits of agreement than 3D IDEAL IQ for both same-day and inter-visit repeatability.
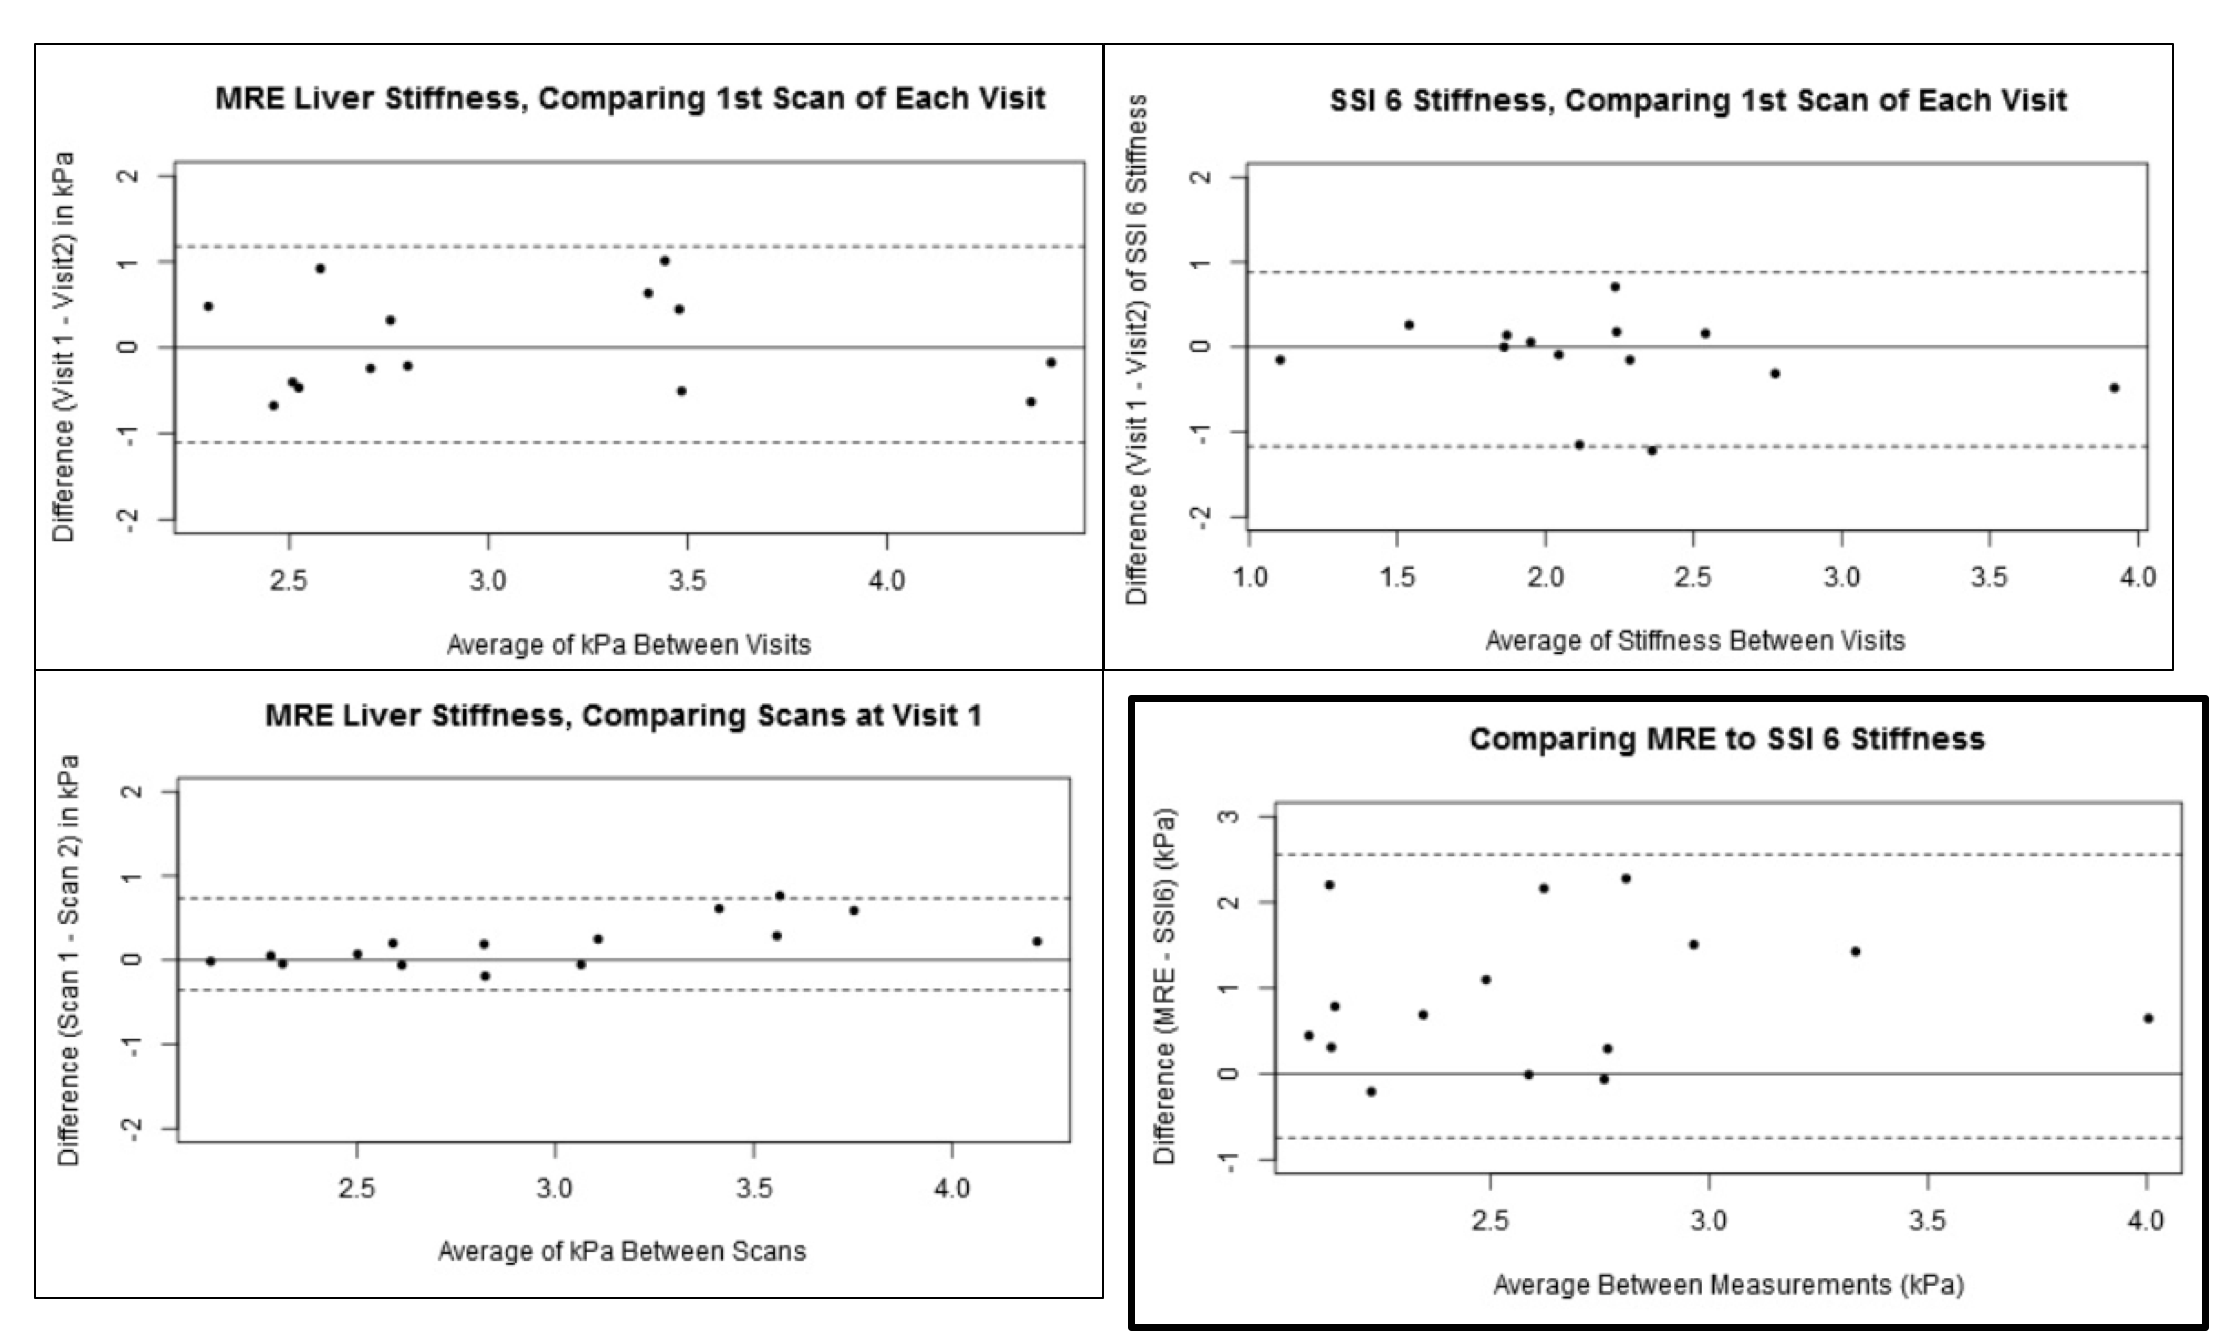
Figure 5 shows Bland-Altman plots of quantitative elastography measurements. The variability in MRE between visits is similar to the variability in USE stiffness measurements between visits. There is a bias of 0.9 kPa between MRE and USE stiffness values.
Discussion
Comprehensive liver MRI is feasible in non-sedated pediatric CF patients. In this population, 2D IDEAL IQ outperformed 3D IDEAL IQ image quality and repeatability, most likely due to these patients having difficulty performing breath-holds. The quantitative measures were found to have low variability during the same visit and between visits, showing that they provide consistent values. The variability of MRE stiffness values between visits was similar to the variability of USE. Performing quantitative liver MRI in this population offers the unique advantage of being able to see structure and quantitate steatosis and stiffness in a single exam.Acknowledgements
This project was supported by the Departments of Radiology and Medical Physics, University of Wisconsin. The authors also wish to acknowledge support from the NIH (K24 DK102595), as well GE Healthcare who provides research support to UW-Madison.References
- Yoon JH, Lee JM, Joo I, Lee ES, Sohn JY, Jang SK, Lee KB, Han JK, Choi BI. Hepatic fibrosis: prospective comparison of MR elastography and US shear-wave elastography for evaluation. Radiology. 2014 Dec;273(3):772-82.
- Reeder SB, Cruite I, Hamilton G, Sirlin CB. Quantitative assessment of liver fat with magnetic resonance imaging and spectroscopy. J Magn Reson Imaging. 2011 Oct; 34(4):729-49.
- ISMRM 2016, Abstract #3836. Motion insensitive quantification of liver proton density fat-fraction using a single-shot 2D technique. Jeannine A. Ruby, Diego Hernando, Camilo A. Campo, Ann Shimakawa, Karl K. Vigen, James H. Holmes, Kang Wang, and Scott B. Reeder.
- Binkovitz LA, El-Youssef M, Glaser KJ, Yin M, Binkovitz AK, Ehman RL. Pediatric MR elastography of hepatic fibrosis: principles, technique and early clinical experience. Pediatric Radiology. 2012;42(4):402-409.
- Campo CA, Hernando D, Schubert T, Bookwalter CA, Van Pay AJ, Reeder SB. Standardized Approach for ROI-based Measurements of Proton Density Fat Fraction and R2* in the Liver. American Journal of Roentgenology 2017 209:3, 592-603.
Figures