2541
Precontrast MRI based radiomics in differential diagnosis of hepatocellular carcinoma and hepatic cavernous hemangioma using a logistic regression classifier1Department of Radiology, The First Affiliated Hospital of Dalian Medical University, Dalian, China, 2Huiying Medical Technology Co., Ltd., Beijing, China, 3GE Healthcare, MR Research, Beijing, China
Synopsis
Recently, radiomics has drawn attention in radiological research. Many scholars believe that radiomics may provide effective information for cancer diagnosis. In present study, we aim to distinguish hepatocellular carcinoma (HCC) and hepatic cavernous hemangioma (HCH) by precontrast MRI based radiomics and conclude that T2WI based radiomics using logistic regression classifier showed optimal diagnostic performance.
Purpose
To investigate the application of precontrast magnetic resonance imaging (MRI) based radiomics in the differential diagnosis of hepatocellular carcinoma (HCC) and hepatic cavernous hemangioma (HCH) using a logistic regression classifier.Introduction
Radiomics was recently developed, and there have been increasing number of investigations on its application in clinical practice. Radiomics principally applies the extraction of multiple features which can quantitatively demonstrate the characteristics of lesions1. HCC and HCH share similar signatures, where the differential diagnosis of them majorly depends on pathological evidence post to surgeries, puncture or interventional tumor cell staining in clinical practice. In the current study, it was of interest that whether radiomics signature with high specificity and sensitivity can be identified, where machine learning model was performed to provide a noninvasive method for the differential diagnosis of HCC and HCH.Material and Methods
A total number of 222 HCC lesions and 224 HCH lesions in 369 patients were retrospectively enrolled in the current study. Given the abdominal MRI data of the patients from Picture Archiving and Communication System (PACS), dual-echo T1WI (in-phase, out-phase), T2WI and DWI images were collected, and then the regions of interest (ROIs) were manually segmented by two independent radiologists with 3 years of clinical practice experience. Thereafter, the radiomics features based on ROIs were gradually calculated using variance threshold, select K best and lasso algorithms. In total, 1029 candidate radiomics features were categorized as original classes (i.e. first order statistic, shape, Gray Level Co-occurence Matrix [GLCM], Gray Level Run Length Matrix [GLRLM], Gray Level Size Zone Matrix [GLSZM]) and transformed as filter classes (i.e. exponential, square, square root, logarithm, wavelet). Eventually, the logistic regression classifier was used to identify a machine learning model based on dual-echo T1WI (in-phase, out-phase), T2WI and DWI images, respectively. The diagnostic performance of each model was evaluated by four metrics, including precision, recall, f1-score, and support, and the area under receiver-operating characteristic curve (AUC).Results
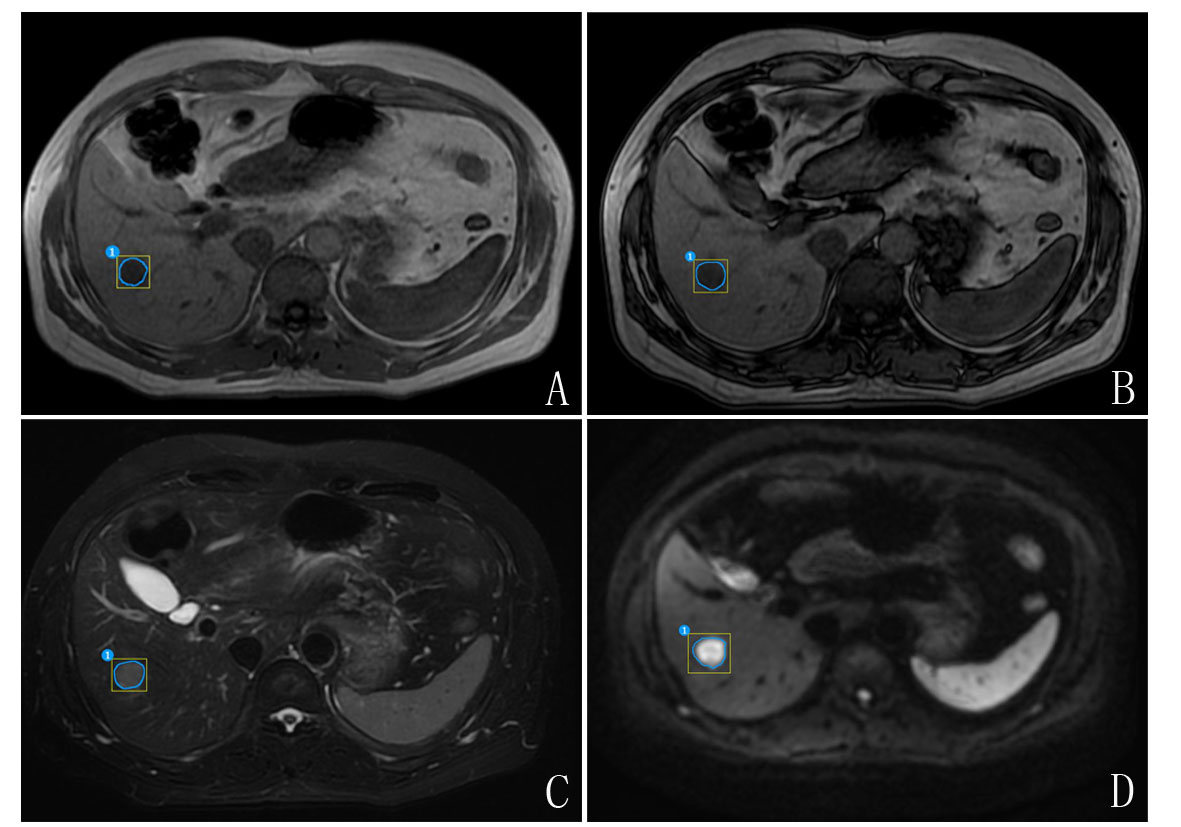
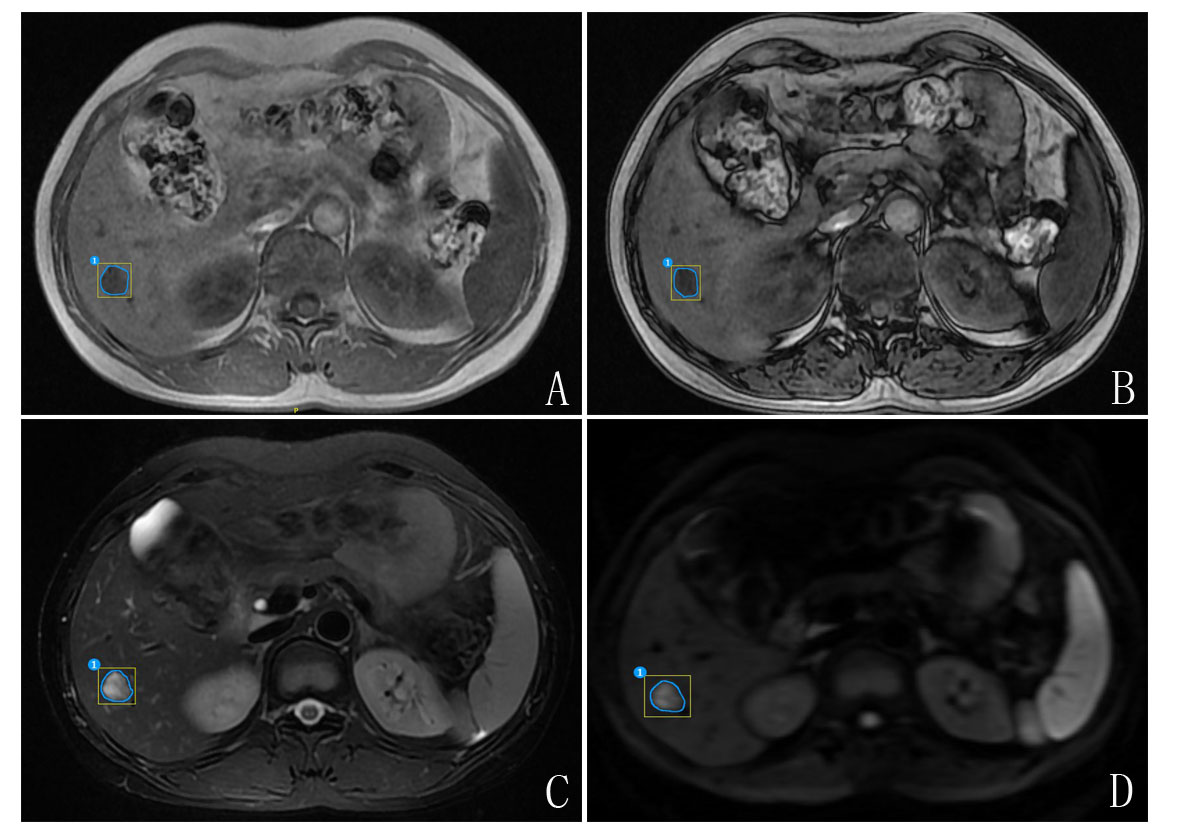
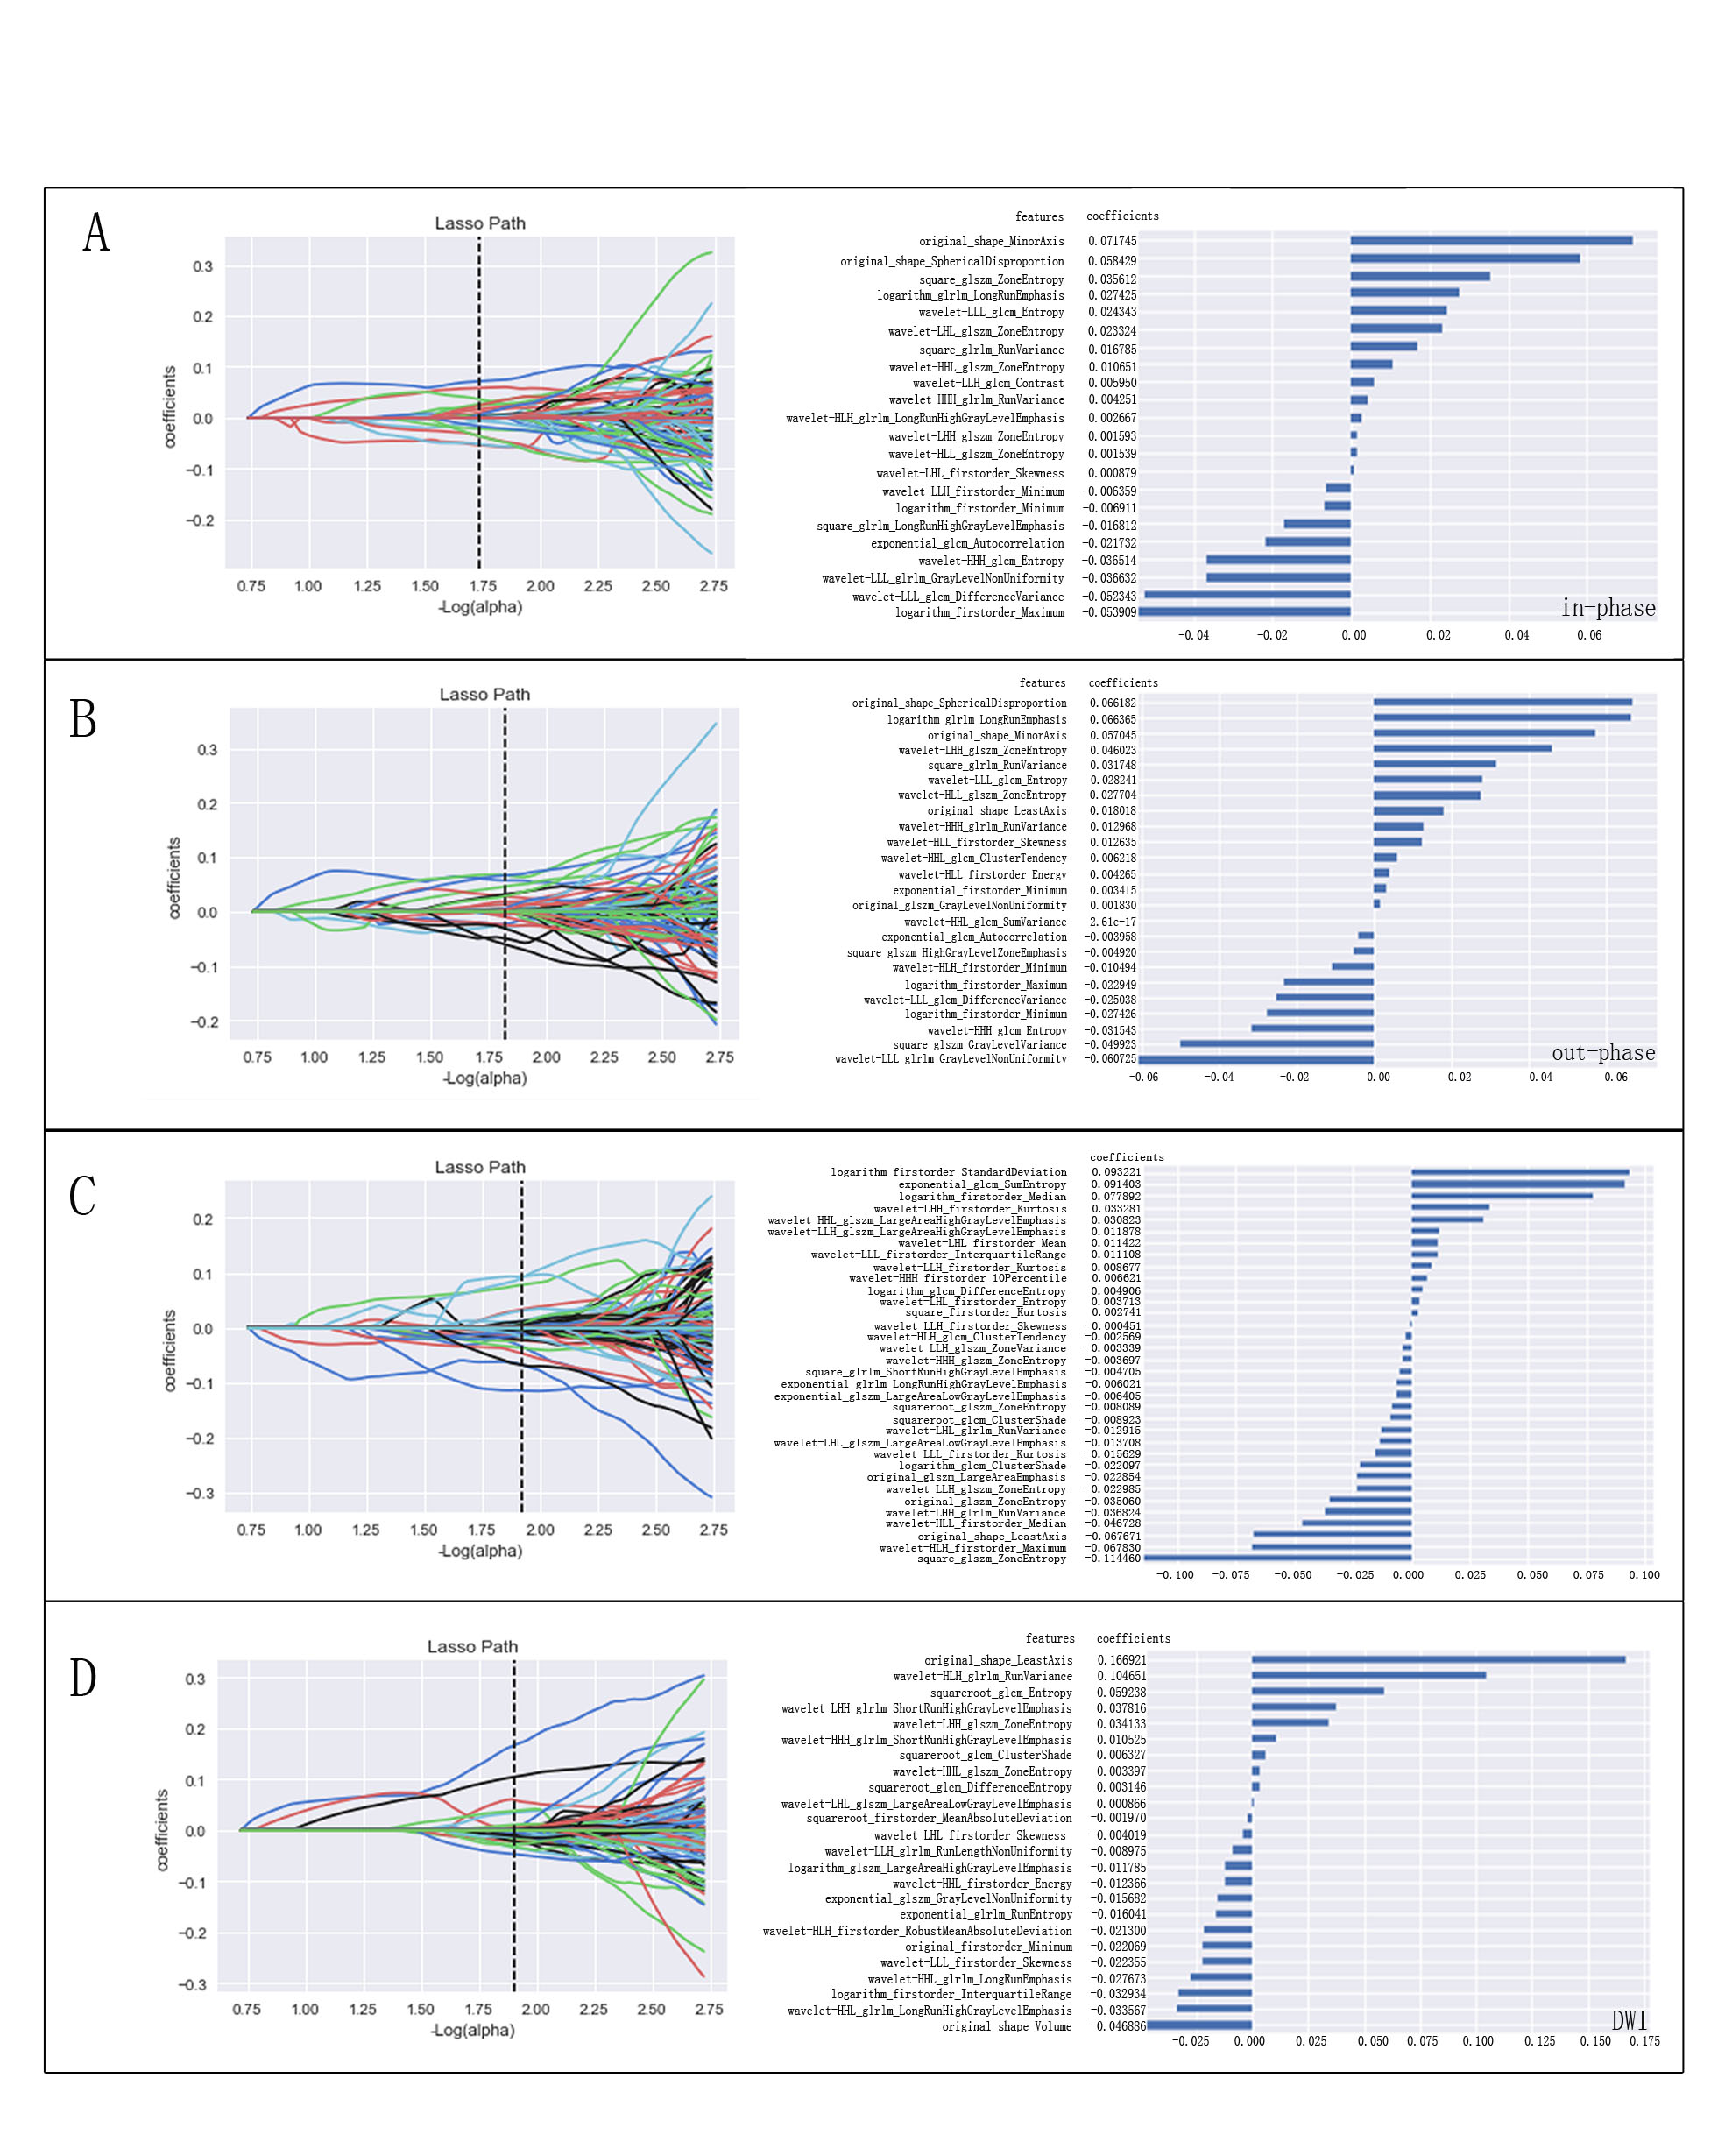
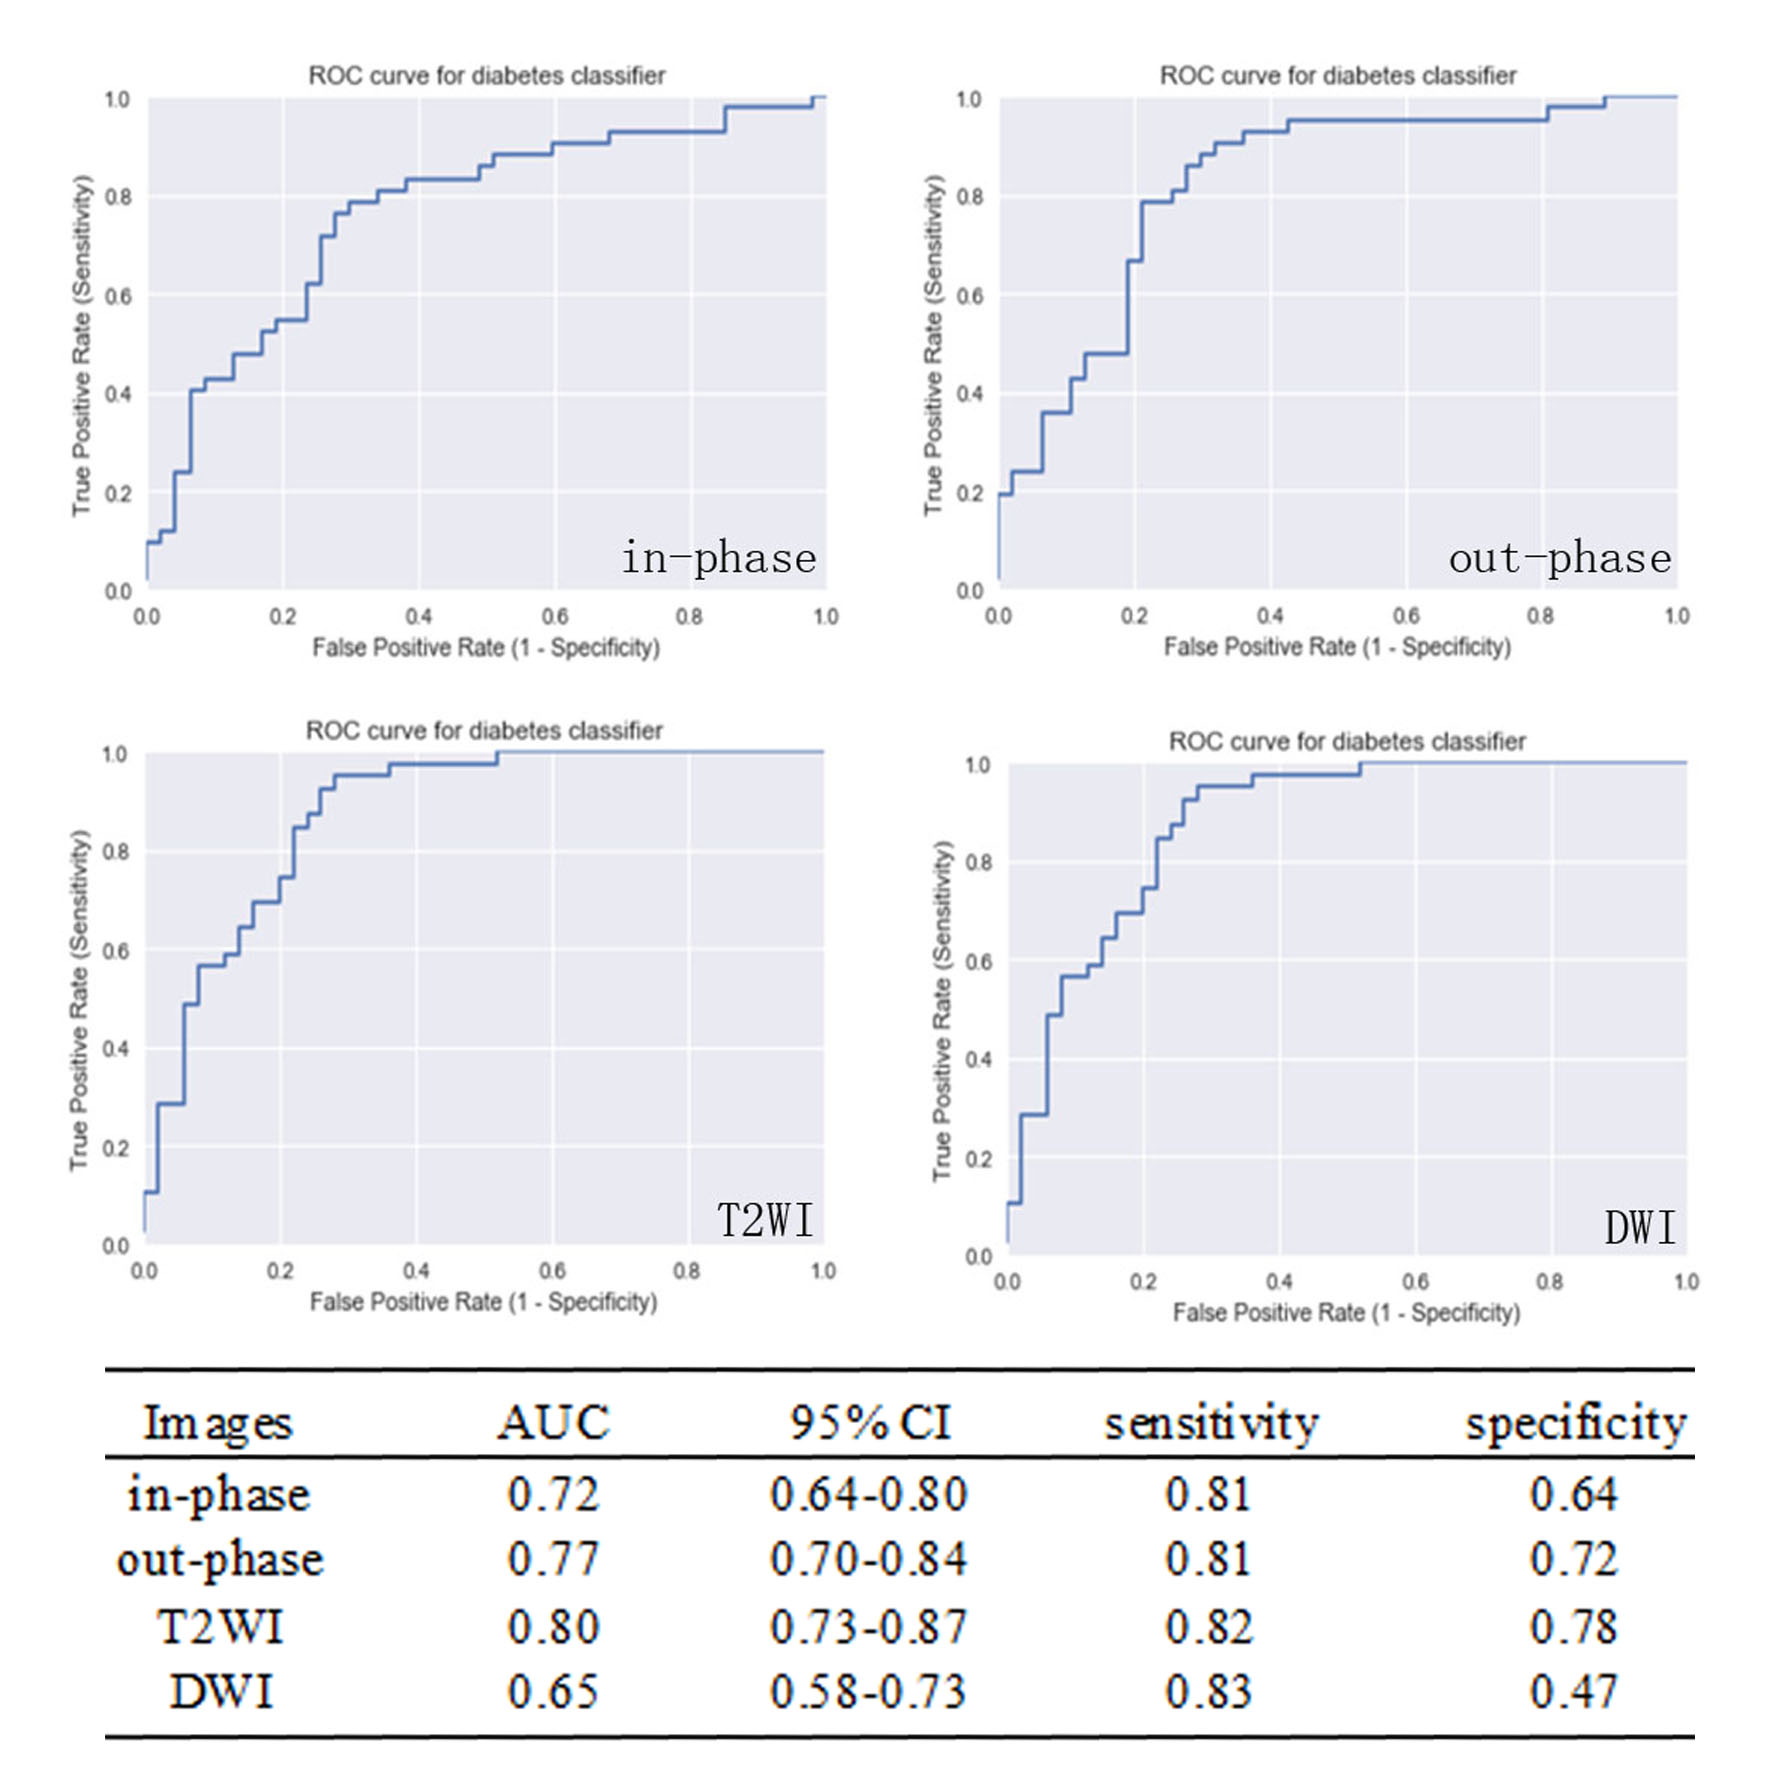
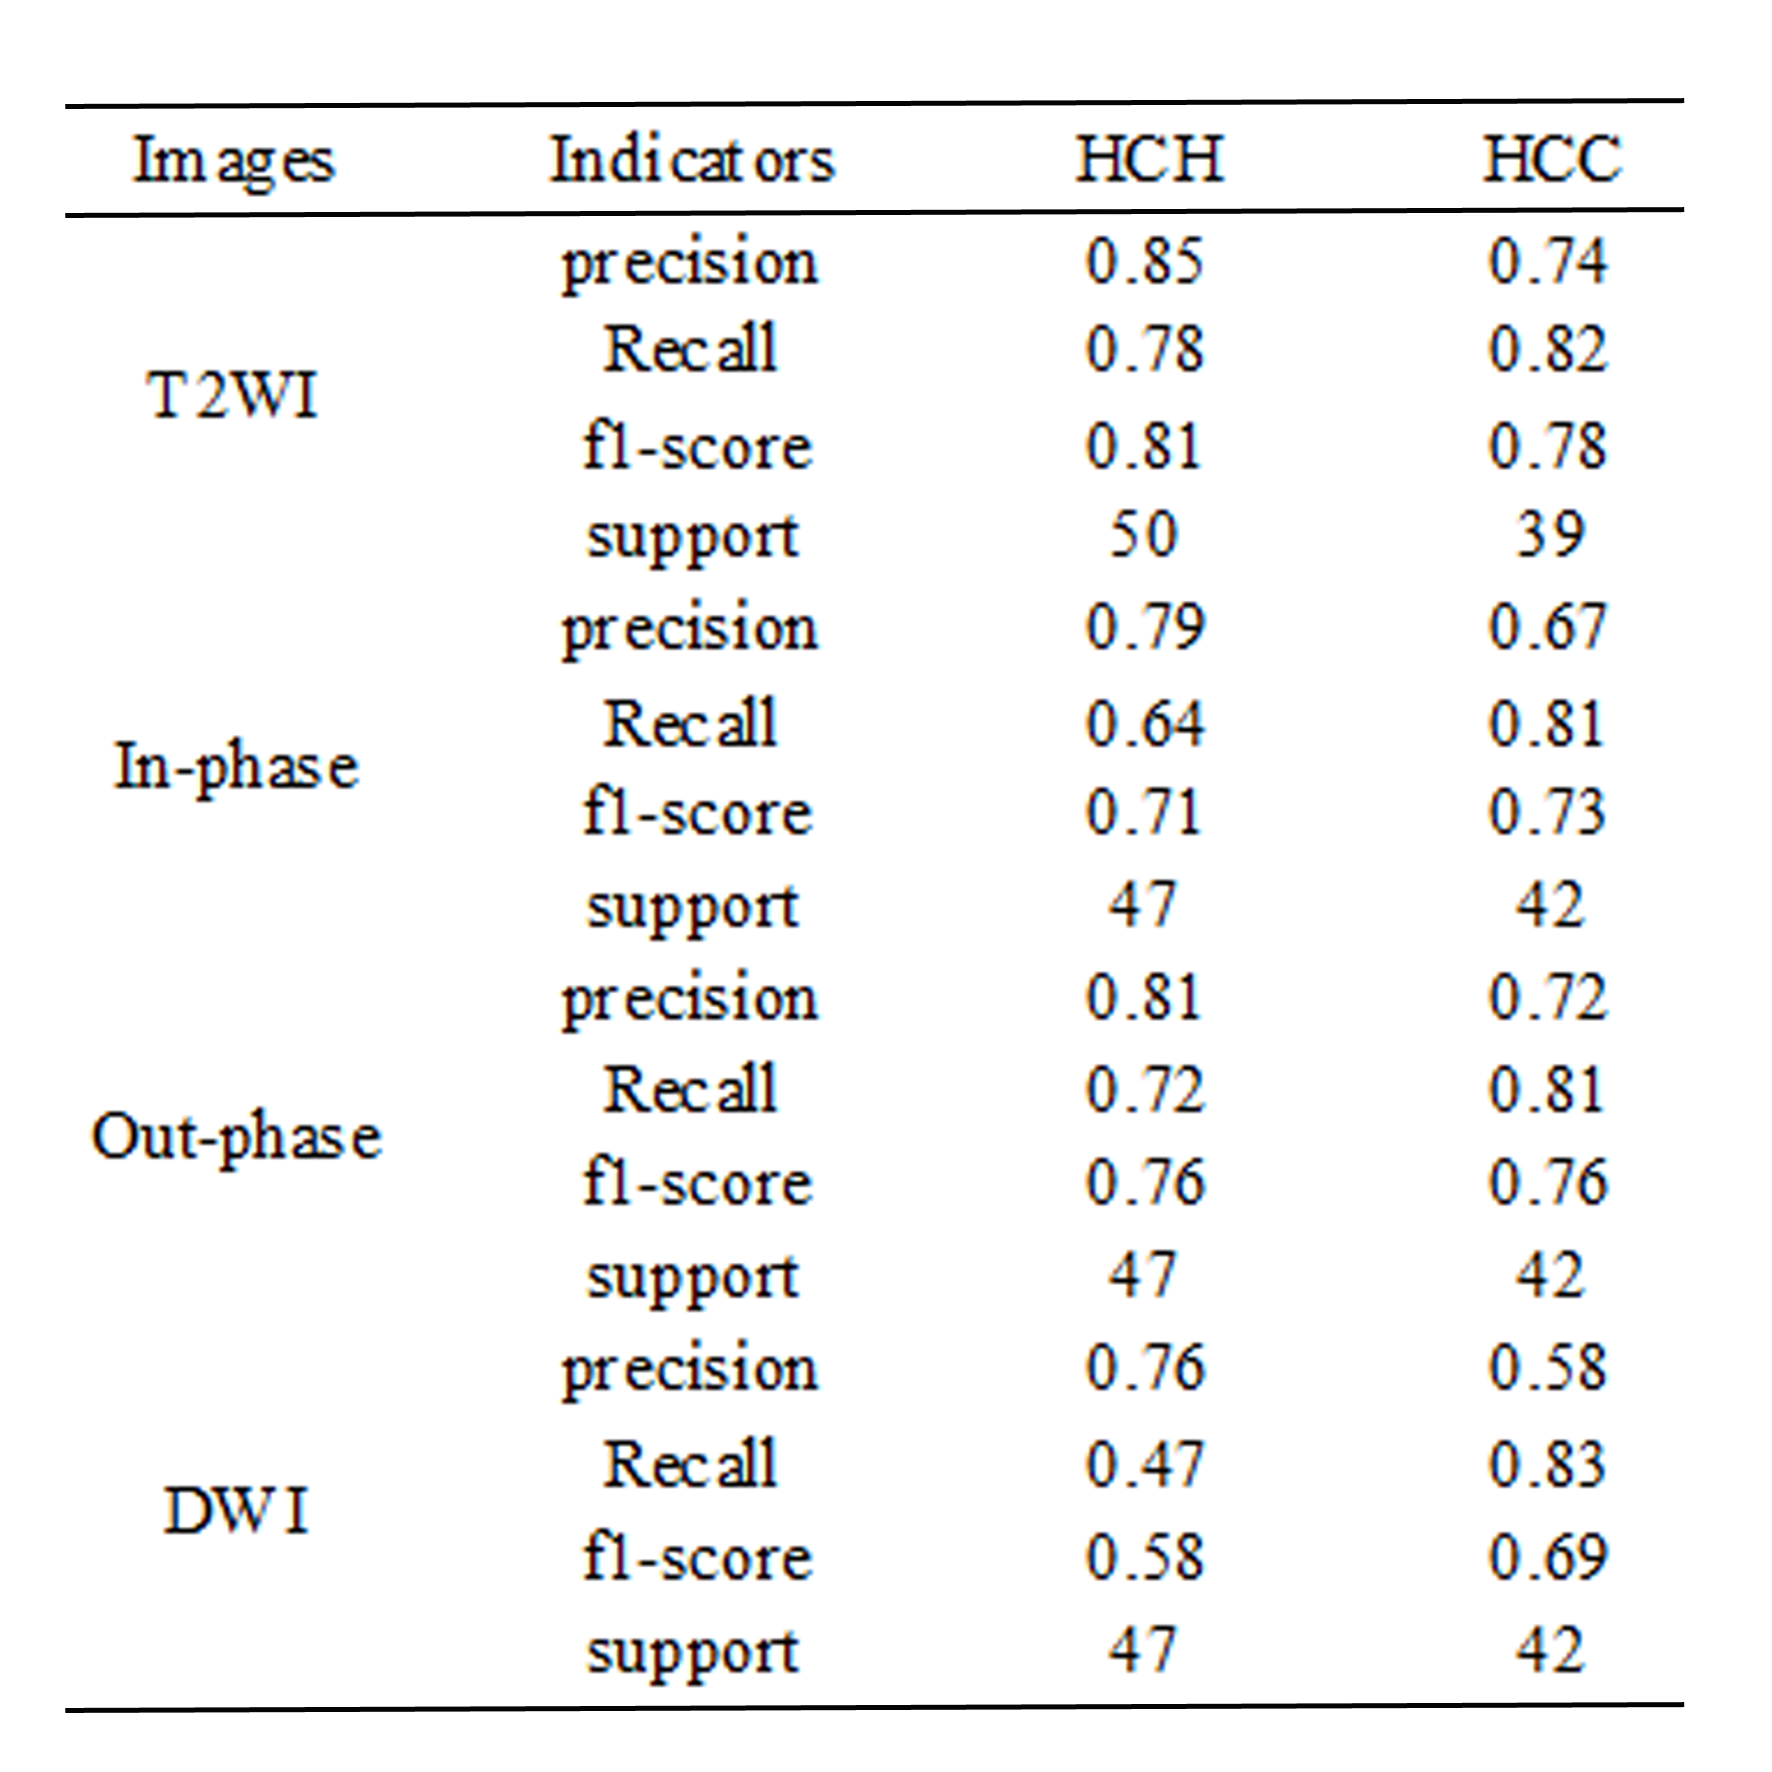
Representative sets of images including in-phase, out-phase, T2WI and DWI of HCC and HCH were demonstrated in Fig.1 and Fig.2, respectively. ROIs enclosing the lesions were drawn on the corresponding images. To build a radiomics signature, valuable radiomics features were extracted on in-phase (n=22), out-phase (n=24), T2WI (n=34), and DWI (n=24), respectively. The corresponding calculated coefficients were also demonstrated in Fig.3. Based on the extracted features, logistic regression classifier was applied for differential diagnosis of HCC and HCH. In comparison, for T2WI images, logistic regression classifier demonstrated the highest diagnostic accuracy with AUC of 0.80 (95%CI: 0.73-0.87; sensitivity: 0.82; specificity: 0.78) and optimum results of four indicators (precision, recall, f1-score, support) in HCC (0.74, 0.82, 0.78, 39) and HCH (0.85, 0.78, 0.81, 50) (Fig. 4). The training model indicators of each image were demonstrated in Table 1.Discussion and Conclusion
Radiomics signature has a significant role on distinguishing HCC and HCH based on the derived T2WI images. Combining the physical meaning of radiomic features on images, we speculate that the asymmetry, heterogeneneity and randomness of lesions are valuable tips for identification, which are consistent with previous similar research2. These results are considered reasonable due to the different micro-structures of HCC and HCH. HCH is more inclined to be uniform because of its compositon of multiple vascular channels and HCC may have asymmetrical gray values with bleeding, necrosis, cytological atypia and heterogeneity of tumor cells3,4. This study has provided a noninvasive method for the differential diagnosis of HCC and HCH by T2WI based radiomics using logistic regression classifier, while further study is still needed to confirm it.Acknowledgements
No acknowledgment found.References
[1] Yip SS, Aerts HJ. Applications and limitations of radiomics. Physics in Medicine & Biology. 2016;61(13):R150-R166.
[2] Z L, Y M, W H, et al. Texture-based classification of different single liver lesion based on SPAIR T2W MRI images. Bmc Medical Imaging. 2017;17(1):42.
[3] Di MM, Saba L, Bosco S, et al. Hepatocellular carcinoma (HCC) in non-cirrhotic liver: clinical, radiological and pathological findings. European Radiology. 2014;24(7):1446-1454.
[4] Yong O, Cheng YD, Zhang XJ, Ouyang XH. The pathological category and the treatment of hepatic cavernous hemangiomas. Journal of Interventional Radiology. 2015.
Figures