2540
Analysis of the Value of Texture Feature Calculated From Contrast-Enhanced MR Images in Differentiating FNH and HCC1National Cancer Center/Cancer Hospital, Chinese Academy of Medical Sciences and Peking Union Medical College, Beijing, China, 2GE Healthcare, China, Beijing, China
Synopsis
For atypical FNH and HCC, conventional MR still has some limitations in differential diagnosis. Texture features can reflect the internal heterogeneity of the lesions. The purpose of this study was to find the texture features’ differences between FNH and HCC, in order to provide auxiliary diagnosis for the lesions which have difficulties in identification.
Introduction
Radiomics uses automated high-throughput data feature extraction algorithms to transform image data into high-resolution image features that can be used, and describe organizational characteristics through these features. Texture analysis can provide objective and quantitative image characteristics. Using radiomics data to distinguish tumor phenotypes can be an effective supplement to clinical data.Purpose
MRI is a common method for the diagnosis of liver disease. However, there is still greater empirical dependence on atypical lesions, some cases of HCC and FNH have some overlap in imaging findings. Because of the clinical treatments and the prognoses of two diseases are completely different, so it is particularly important for their differential diagnoses. Therefore, this study was planned to explored the use of radiomics to evaluate the imaging features of HCC and FNH, then to discuss the value of enhanced MR texture feature in identifying FNH and HCC.Materials and Methods
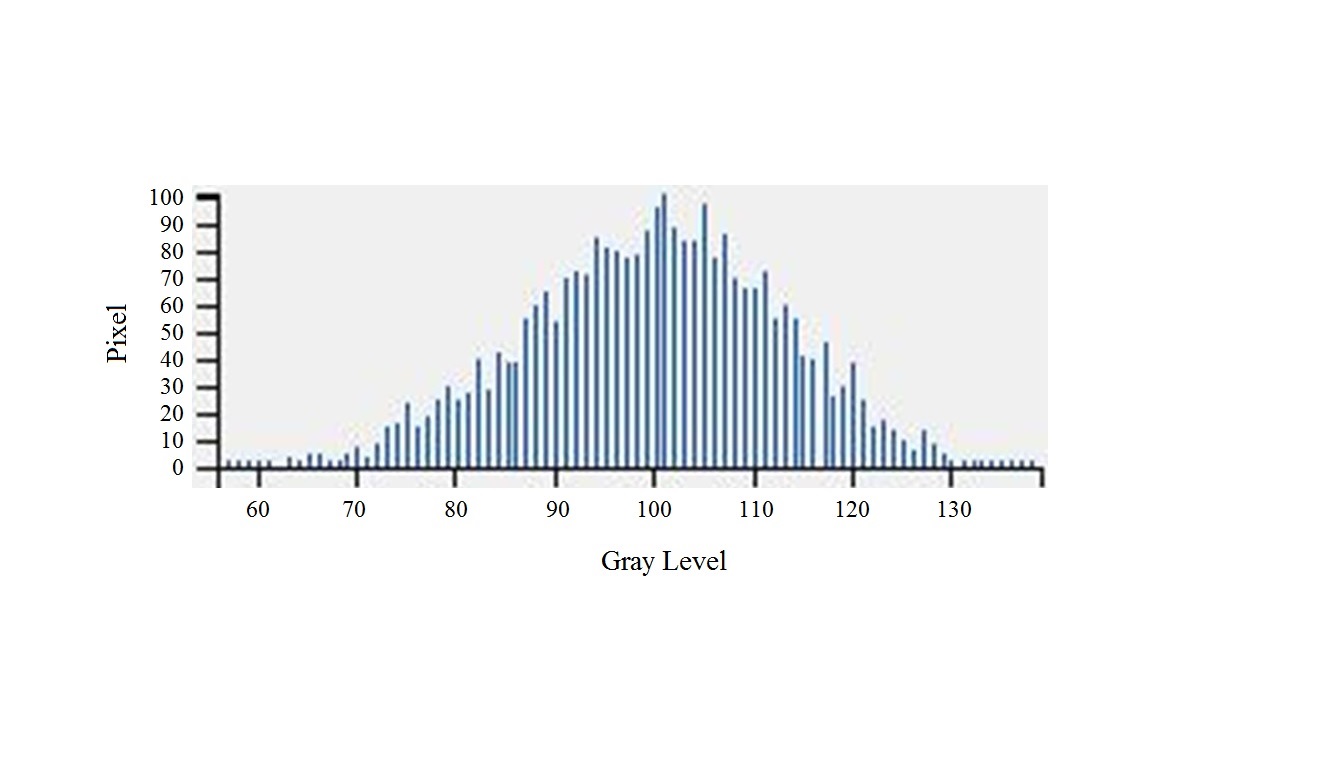
From January 2015 to October 2016, 23 cases of patients with FNH and 27 cases of patients with HCC confirmed by surgery or biopsy were analyzed. All of these patients underwent a GE Discovery MR750 (General Electric Medical Systems, Waukesha, WI, USA) scan. A high pressure syringe was used to do bolus injection at a flow rate of 2.5 ml/s with contrast agent Gd-DTPA (0.1 mmol / kg). The scan range included the whole liver, TR / TE was 2.8ms / 1.3ms, flip angle was 12 °, matrix was 288 × 170, thickness was 4.2mm, no spacing, NEX was 0.7. All of the 50 patients were examined by triple-phase enhanced MR scan, texture features of lesions were analyzed during arterial phase(20~30s), portal venous phase(50~60s) and delayed phase(90~100s), values of texture parameters (mean signal intensity, skewness, kurtosis, correlation, energy, standard deviation and entropy) were determined by texture analysis using gray level histogram and gray-level co-occurrence matrix texture analysis, and all the results were compared and analyzed(Figure.1). This study used MATLAB software to carry out feature extraction, and used SPSS 22.0 statistical software for data analysis. P <0.05 was considered statistically significant.Results
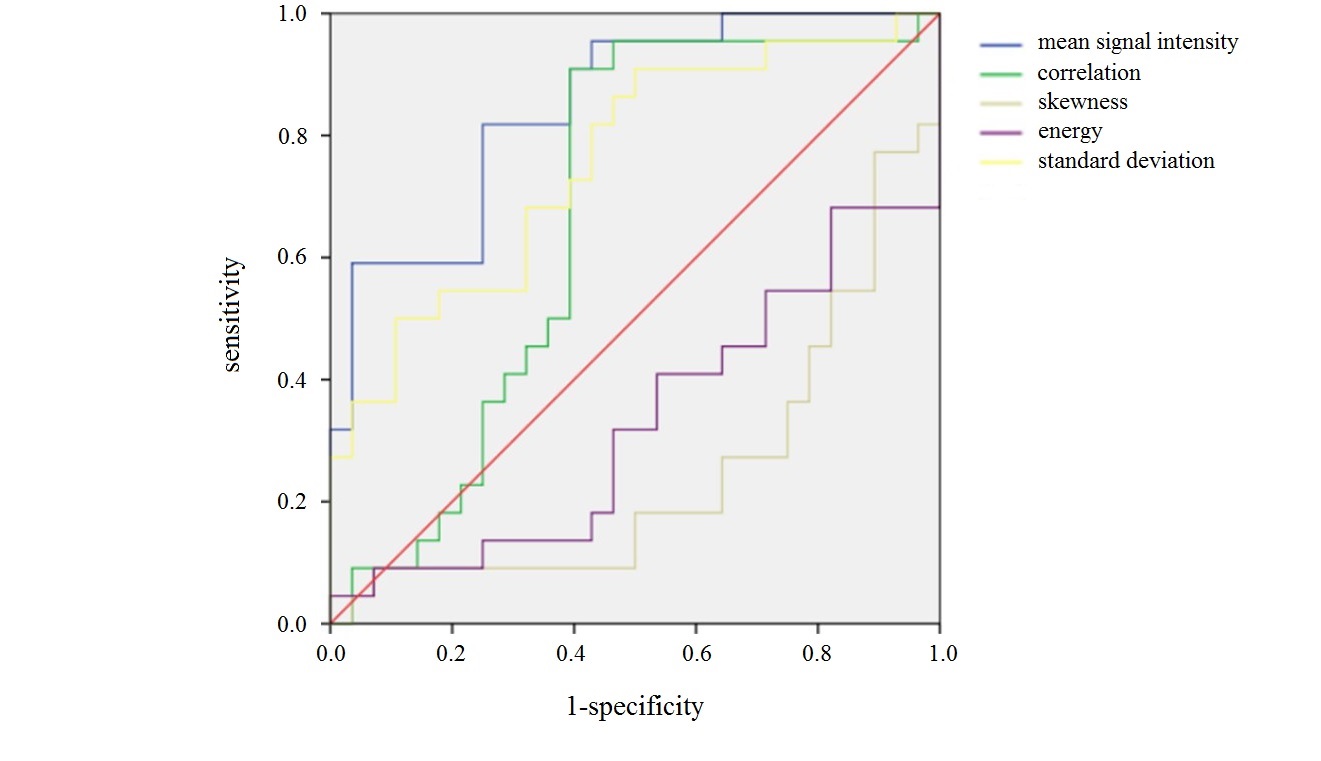
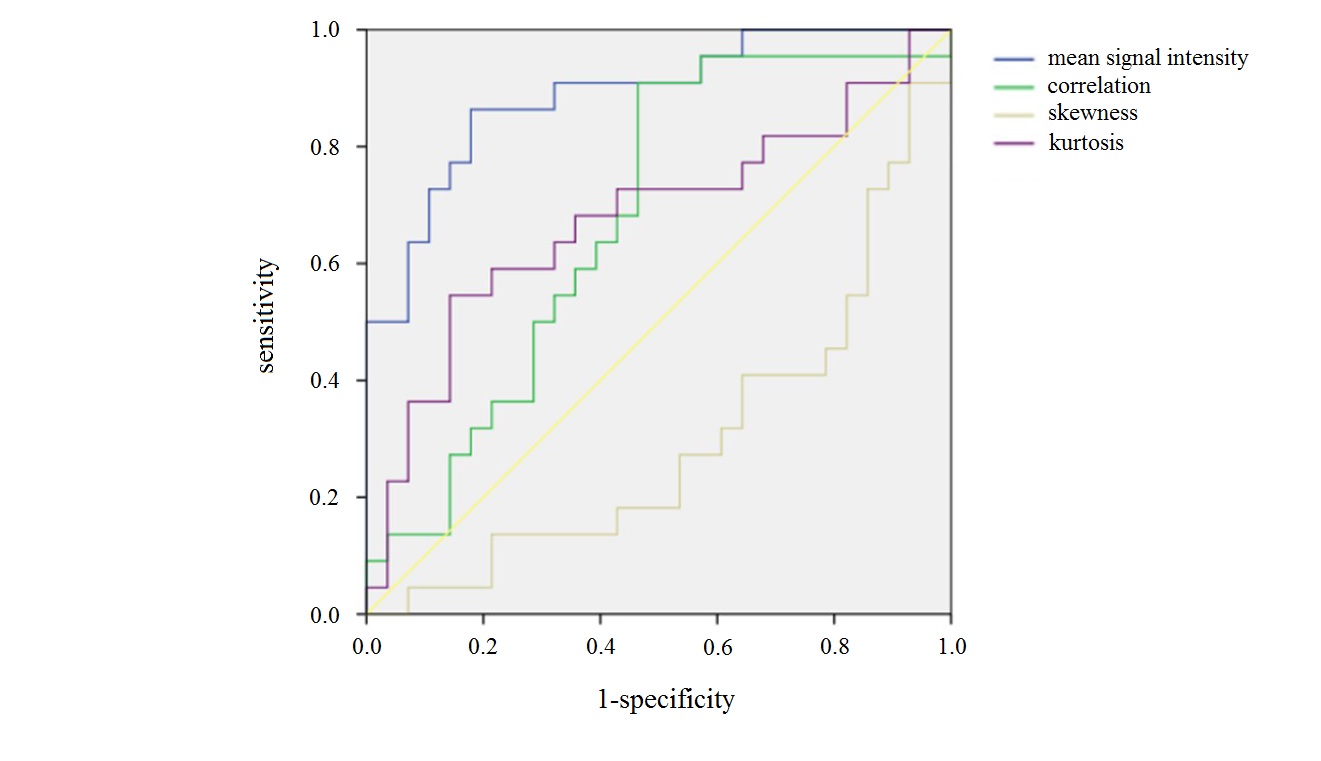
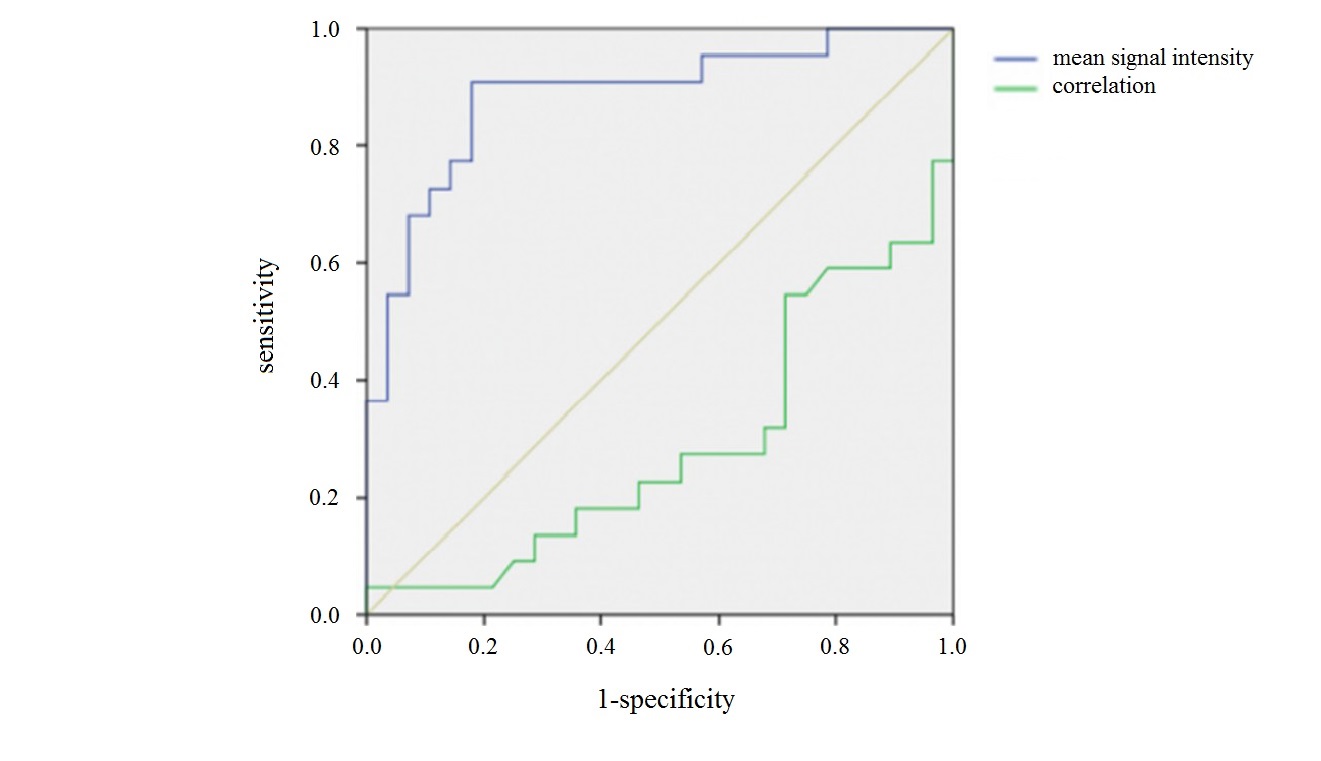
In arterial phase, FNH differed from HCC in skewness, mean signal intensity, SD, energy and correlation(Figure.2); in portal phase, FNH differed from HCC in skewness, mean signal intensity, kurtosis and correlation(Figure.3); and in delayed phase, FNH differed from HCC only in mean signal intensity and correlation(Figure.4). All the above differences were statistical significant (P<0.05). The results of ROC analysis showed that, in all phases of triple-phase enhanced MR scan, mean signal intensity value was the texture parameter that provided the best diagnostic performance, with corresponding AUC values in each phase being 0.849, 0.888 and 0.886, respectively. There was no statistically difference in mean signal intensity value between arterial phase and delayed phase (P=0.495). However, statistically differences were observed in mean signal intensity value between portal venous phase and arterial phase or between portal venous phase and delayed phase (P=0.000, 0.000) (Table.1). Sensitivity and specificity of diagnosis was 81.8% and 75.0% when the cut-off point of mean signal intensity in arterial phase was 79.84, 86.4% and 82.1% when the cut-off point in portal venous phase was set at 101.90, and 90.9% and 82.1% when the cut-off point in delayed phase was 81.78.Conclusion
Texture parameters reflect the heterogeneity of the tumor and disclose the internal characteristics of the tumor that human can’t distinguish from eyes. This study was based on grayscale histogram and GLCM to extract the liver lesions’ texture features. The result shows that texture analysis of MR images holds promising value in differentiating FNH from HCC, and the value of mean signal intensity may be more important in diagnosis.Acknowledgements
No acknowledgement found.References
1.Hennedige T, Venkatesh SK. Advances in computed tomography and magnetic resonance imaging of hepatocellular carcinoma. World J Gastroenterol 2016, 22: 205–220.
2.Simpson AL, Adams LB, Allen PJ, et al. Texture analysis of preoperative CT images for prediction of postoperative hepatic insufficiency: a preliminary study. J Am Coll Surg 2015, 220: 339–346.
3.Ganeshan B, Miles KA, Young RC, et al. Hepatic enhancement in colorectal cancer: texture analysis correlates with hepatic hemodynamics and patient survival. Acad Radiol 2007, 14: 1520–1530.
Figures