2536
Non-Invasive Assessment of Mesenteric Hemodynamics with 4D flow MRI1Medical Physics, University of Wisconsin - Madison, Madison, WI, United States, 2Radiology, University of Wisconsin - Madison, Madison, WI, United States
Synopsis
Chronic mesenteric ischemia (CMI) is caused by inadequate blood flow to the intestines. This study investigates the use of 4D flow MRI to non-invasively assess the hemodynamics of the mesenteric circulation in patients with CMI and controls.
Introduction
Chronic mesenteric ischemia (CMI) is caused by a blood flow reduction to the intestines. Around 90% of cases are the result of atherosclerosis, however, conditions such as median arcuate ligament syndrome (MALS) may also result in CMI1. Patients with CMI typically present with postprandial abdominal pain, occurring 15-60 minutes after a meal. Recurrent symptoms may result in noticeable weight-loss and fear of food. If left unrecognized, CMI has the potential to progress into life-threatening acute ischemia with bowel infarction1. Thus, an importance is placed on the accurate diagnosis of CMI. This has traditionally been accomplished by invasive interventional angiography and duplex ultrasonography, but evaluation and visualization of mesenteric vasculature can be difficult. 2D phase contrast MRI has previously been proposed to functionally evaluate mesenteric vasculature2,3 and a recent 4D flow pilot study demonstrated a wide range of flow responses to a meal challenge in CMI patients4. This abstract further expands on the use of 4D flow MRI in assessing CMI through quantifying hemodynamics in the major vessels of the upper abdomen in patients and controls before and after a meal challenge.Methods
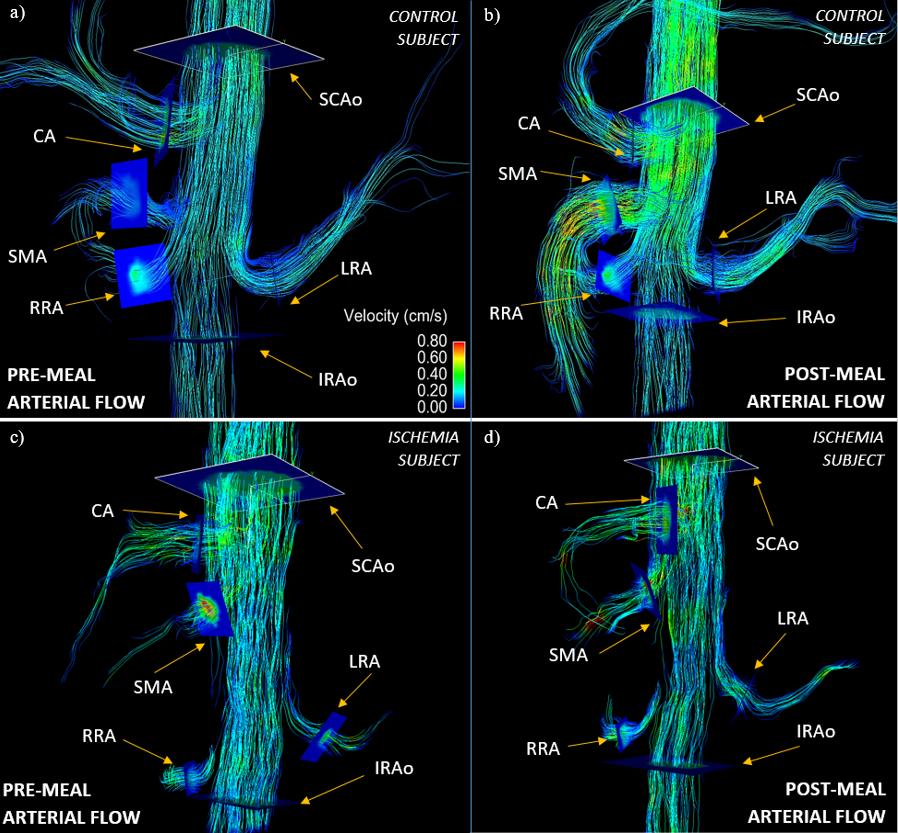
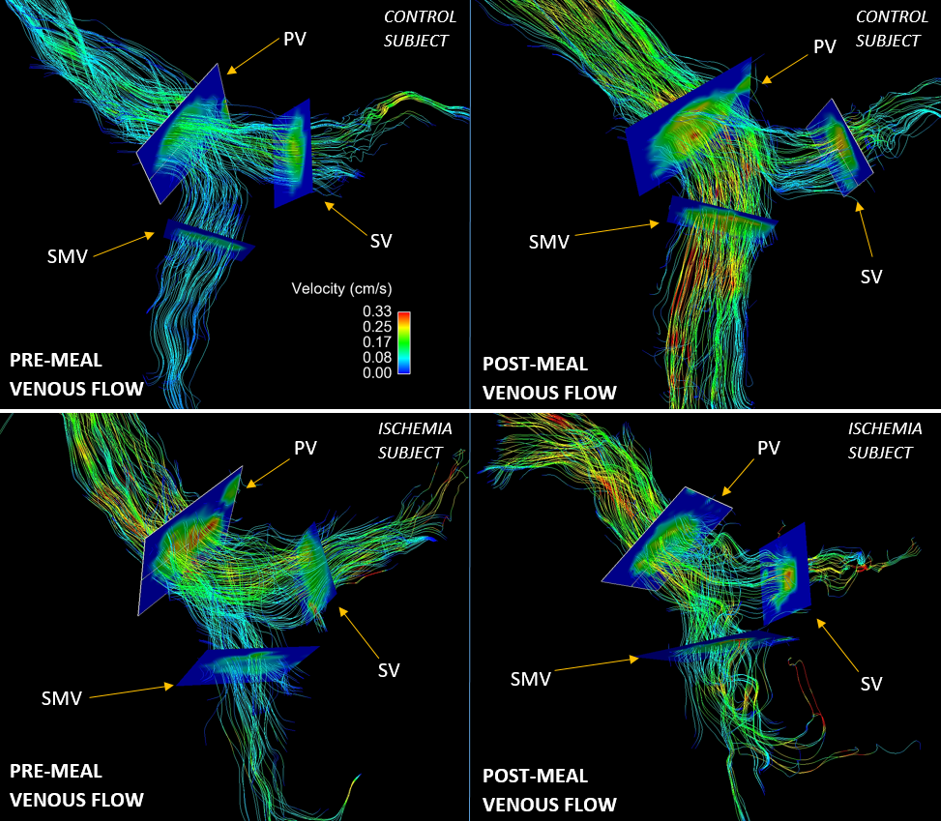
In this IRB-approved and patient-compliant study, 19 subjects (age range 21-86y, mean = 49y, females = 13) presenting with symptoms of mesenteric ischemia and 6 healthy subjects (age range 31-46y, mean = 39y, females = 2) were imaged on clinical 1.5T and 3.0T scanners (GE Healthcare). One patient was brought for a second scan after surgical intervention. For all subjects, 4D flow data were acquired before and after a meal challenge using a radially undersampled trajectory (5-point PC-VIPR5,6) with full volumetric coverage of the upper abdomen: imaging volume: 32x32x24cm spherical; 1.25mm isotropic resolution; TR/TE = 6.4-8.4ms/2.2-2.5ms; VENC = 100-120 cm/s; intravascular contrast agent (0.03mmol/kg of gadofosveset trisodium (Lantheus, N. Billerica, MA)); with retrospective ECG and respiratory gating. Pre-prandial imaging was performed after 5 hours of fasting. After the first scan, subjects orally ingested 574 mL EnSure Plus® (Abbot Laboratories, Columbus, OH) and scanning was resumed 20 minutes after ingestion. 3D vessel segmentation from the PC data was performed semi-automatically using Mimics (Materialize, Leuven, Belgium). Flow visualization and flow analysis plane placement was accomplished in Ensight (CEI, Apex, NC) (Figures 1-2). Flow analysis was conducted in 6 arterial and 3 portal vessel segments. Arterial vessels: supraceliac aorta (SCAo), infrarenal aorta (IRAo), celiac artery (CA), superior mesenteric artery (SMA), right renal artery (RRA), and left renal artery (LRA). Portal vessels: splenic vein (SV), superior mesenteric vein (SMV), and portal vein (PV). Magnitude and velocity vector data from these 9 analysis planes were exported to a customized software package7 that allowed for manual vessel segmentation and hemodynamic analysis throughout the cardiac cycle. Statistical analysis was performed using paired t-tests (between pre- and post-prandial states) as well as a two-sample t-test (between groups) with a P<0.05 for establishing statistical significance.Results
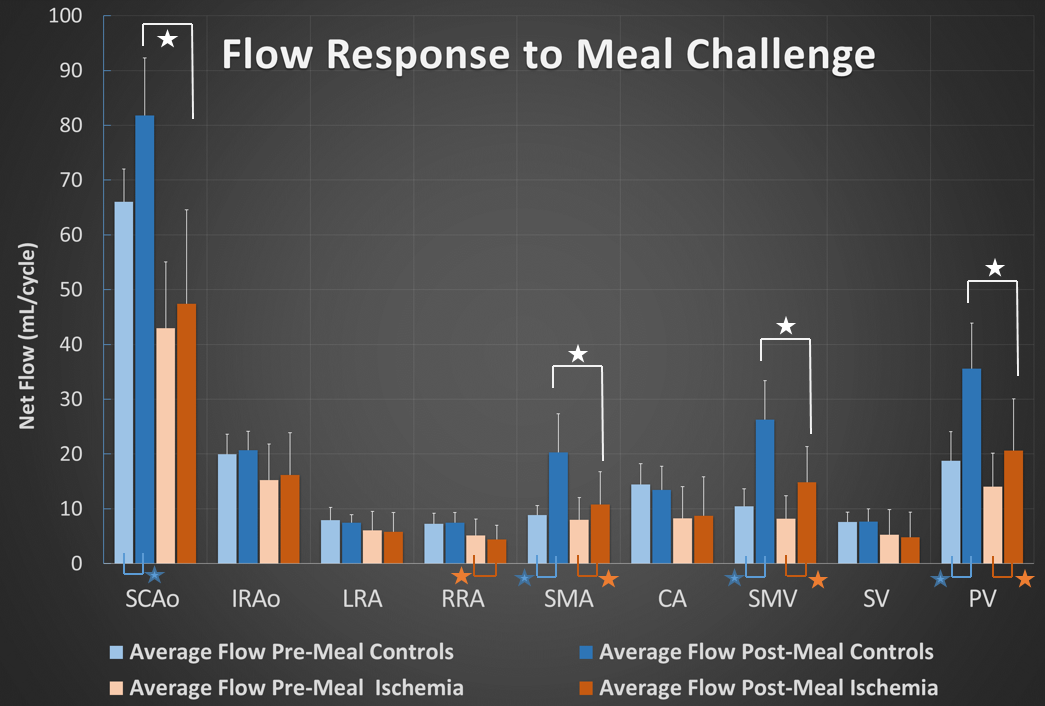
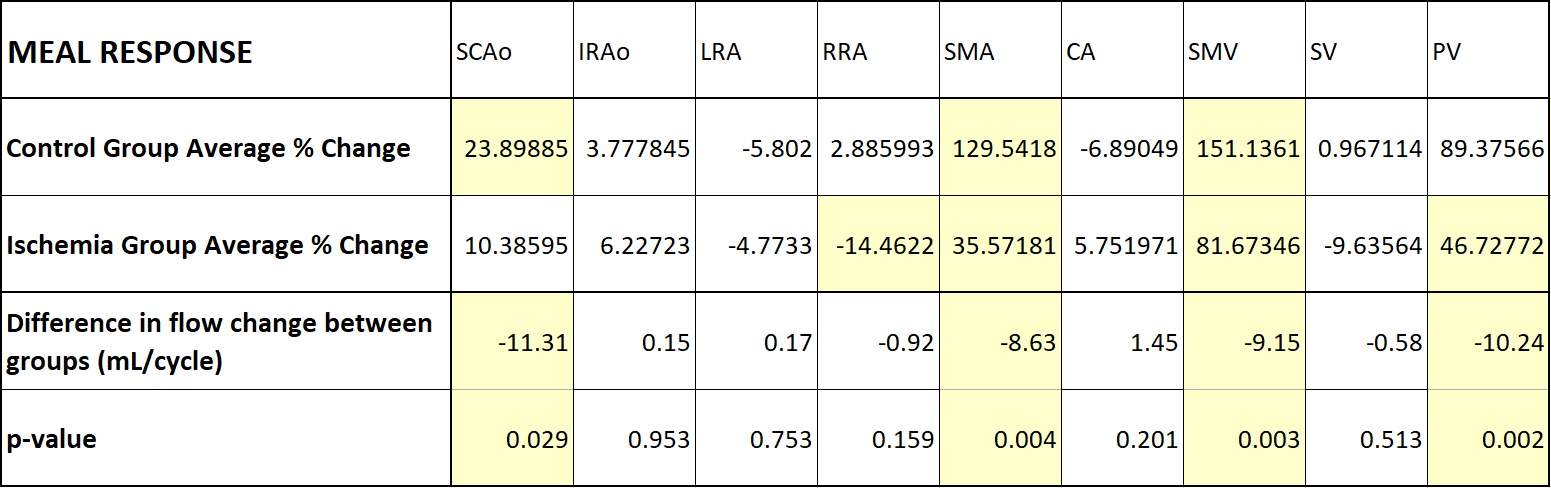
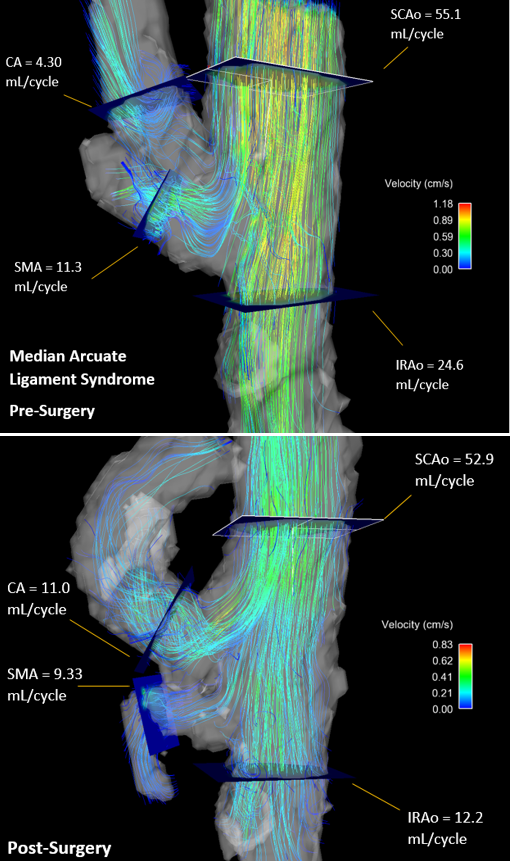
4D flow data were successfully obtained for all 52 flow scans. Figures 1-2 show representative streamline visualizations. The flow changes between pre and post meal measurements for patients and controls are shown in Figures 3-4. Notable observations with statistical significance include: flow increases in both groups in the SCAo (controls: 23.9%; patients: 10.4%), SMA(c:129.1%, p:35.6%), SMV(c:151.1%, p:81.7%), and PV(c:89.4%, p:46.7%) and a decrease in RRA flow (-14.5%) in patients. Cross comparing the flow difference between both groups showed a statistically significant difference in meal challenge responses, specifically, the ischemia group showed less change in flow after a meal in the SCAo, SMA, SMV, and PV (also Figure 3). The other vessels measured (IRAo, LRA, RRA, CA, and SV) did not show statistically significant meal response differences. Figure 5 shows results from a patient diagnosed with MALS, who was imaged before and after surgical intervention, showing dramatic changes in flow volumes after therapy.Discussion
The patient group showed consistently lower flow rates than the controls, possibly due to overall compromised cardiovascular health. These differences were significantly amplified in their stunted flow responses to a meal challenge, particularly in the SMA, SMV, and PV. This is most likely due to intrinsic pathology that is preventing the vessels from fulfilling the demand for increased blood flow to the abdomen.Conclusion
This study demonstrates the feasibility of using 4D flow MRI to non-invasively and comprehensively assess the functional response to a meal challenge in patients suspicious of possible mesenteric ischemia. Additionally, the comprehensive anatomical coverage of all mesenteric vessels can identify collateral pathways and further aid in diagnosis. In summary, this is a promising approach to quantitatively and qualitatively aid in the difficult diagnosis of mesenteric ischemia and studies with larger patient cohorts are warranted.Acknowledgements
We gratefully acknowledge research support from GE Healthcare.References
1. Wilkins LR, Stone JR. Chronic mesenteric ischemia. Tech Vasc Interv Radiol. 2015;18(1):31-37.
2. KC Li, Hopkins KL, Dalman RL CS. Simultaneous measurement of flow in the superior mesenteric vein and artery with cine phase-contrast MR imaging: value in diagnosis of chronic mesenteric ischemia—work in progress. Radiology. 1995;194(2):327-330.
3. Roldan-Alzate A, Frydrychowicz A, Said A, et al. Impaired regulation of portal venous flow in response to a meal challenge as quantified by 4D flow MRI. J Magn Reson Imaging. 2015;42(4):1009-1017.
4. Wieben O, Roldan-Alzate A, Reeder SB, et al. 4D Flow MRI for non-invasive assessment of Mesenteric Ischemia. ISMRM. 2013;(10):63.
5. Gu T, Korosec FR, Block WF, et al. PC VIPR: A high-speed 3D phase-contrast method for flow quantification and high-resolution angiography. Am J Neuroradiol. 2005;26(4):743-749.
6. Johnson KM, Lum DP, Turski PA, et al. Improved 3D Phase Contrast MRI with Off-resonance Corrected Dual Echo VIPR. Magn Reson Med. 2008;60(6):1329-1336.
7. Stalder AF, Russe MF, Frydrychowicz A, Bock J et al. Quantitative 2D and 3D phase contrast MRI: Optimized analysis of blood flow and vessel wall parameters. MRM. 2008;60(5):1218-1231.
Figures