2535
Computer aided cancer detection based on volumetric DCE-MRI analysis1Department of Biomedical Imaging and Image-guided Therapy, Medical University of Vienna, Vienna, Austria
Synopsis
While CAD is already routinely employed in conventional mammography, the data available on CAD cancer detection at MRI so far are limited and mostly include evaluation of lesion size, vascularization kinetics and tumor extent. Our data from two different approaches based on the percentage of voxel volume enhancement of either the ipsilateral breast alone or accounting for background parenchymal enhancement measured in the contralateral breast suggest both to be viable approaches for breast cancer detection with excellent reproducibility, that should be further developed.
INTRODUCTION
While computer aided detection (CAD) is already routinely employed in conventional mammography imaging, few data are available on CAD cancer detection at MRI1,2. Given the excellent diagnostic performance of breast MRI with sensitivities well above 95%, DCE-MRI of the breast is increasingly applied in routine breast imaging3-5. An automated approach pre-assessing the risk of malignancy would be most helpful in assisting inexperienced readers and could potentially improve breast-MRI workflow. Also, in clinical routine a variety of Gd-based contrast agents is applied, which differ in their physicochemical properties and importantly in their respective T1 and T2 relaxativities6,7. It stands to reason that CAD evaluation based on pixel-wise enhancement depends on the kind and dose of contrast agent administered. We therefore aimed to test whether CAD based on volumetric DCE-MRI analysis could predict the presence of malignancy and whether this assessment is influenced by contrast agent relaxativities.METHODS
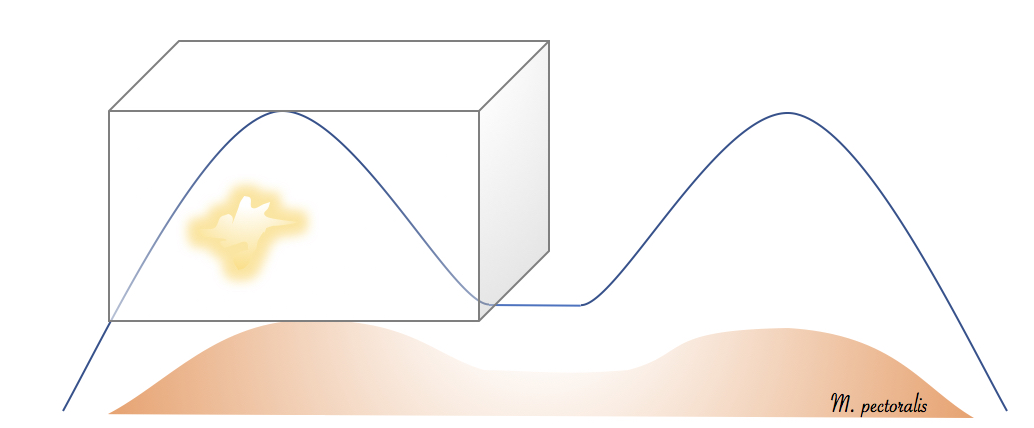
This retrospective IRB-approved study was carried out by two independent readers blinded to the histopathological outcome. It included 50 consecutive patients who underwent two subsequent breast MRI examinations for suspicious findings at conventional imaging with bodyweight‐adapted equimolar dosage of 0.1 mmol/kg contrast medium (0.2 ml/kg MultiHance, Bracco or 0.2 ml/kg Dotarem, Guerbet>24h apart; median 2+/-1.7days). All lesions had to be histopathologically verified. A fat saturated, view‐sharing 3D gradient echo sequence (TWIST, TR 6.23, TE 2.95, GRAPPA factor 3, spatial resolution 0.9×0.9×1.1, temporal resolution 28s, interpolated to 14s) was acquired in axial orientation on a 3T MRI scanner (TIMTrio, Siemens Healthcare) using a dedicated 16‐channel bilateral breast coil (Sentinelle, Invivo). Contrast agents were injected intravenously by an automated device (Spectris, Medrad) at a flow rate of 3 ml/s followed by a 15ml saline flush after a baseline scan. Pre-contrast, early and delayed postcontrast images were assessed using computer-assisted software (Brevis, Siemens Healthcare) (Figure)8. Diagnostic performance was statistically determined for percentage of ipsilateral voxel volume enhancement and for percentage of contralateral enhancing voxel volume subtracted from ipsilateral enhancing voxel volume after crosstabulation with the dichotomized histological outcome (benign/malignant). Bland-Altman plots and areas under the ROC curves with SPSS 22.0 (IBM, USA).RESULTS
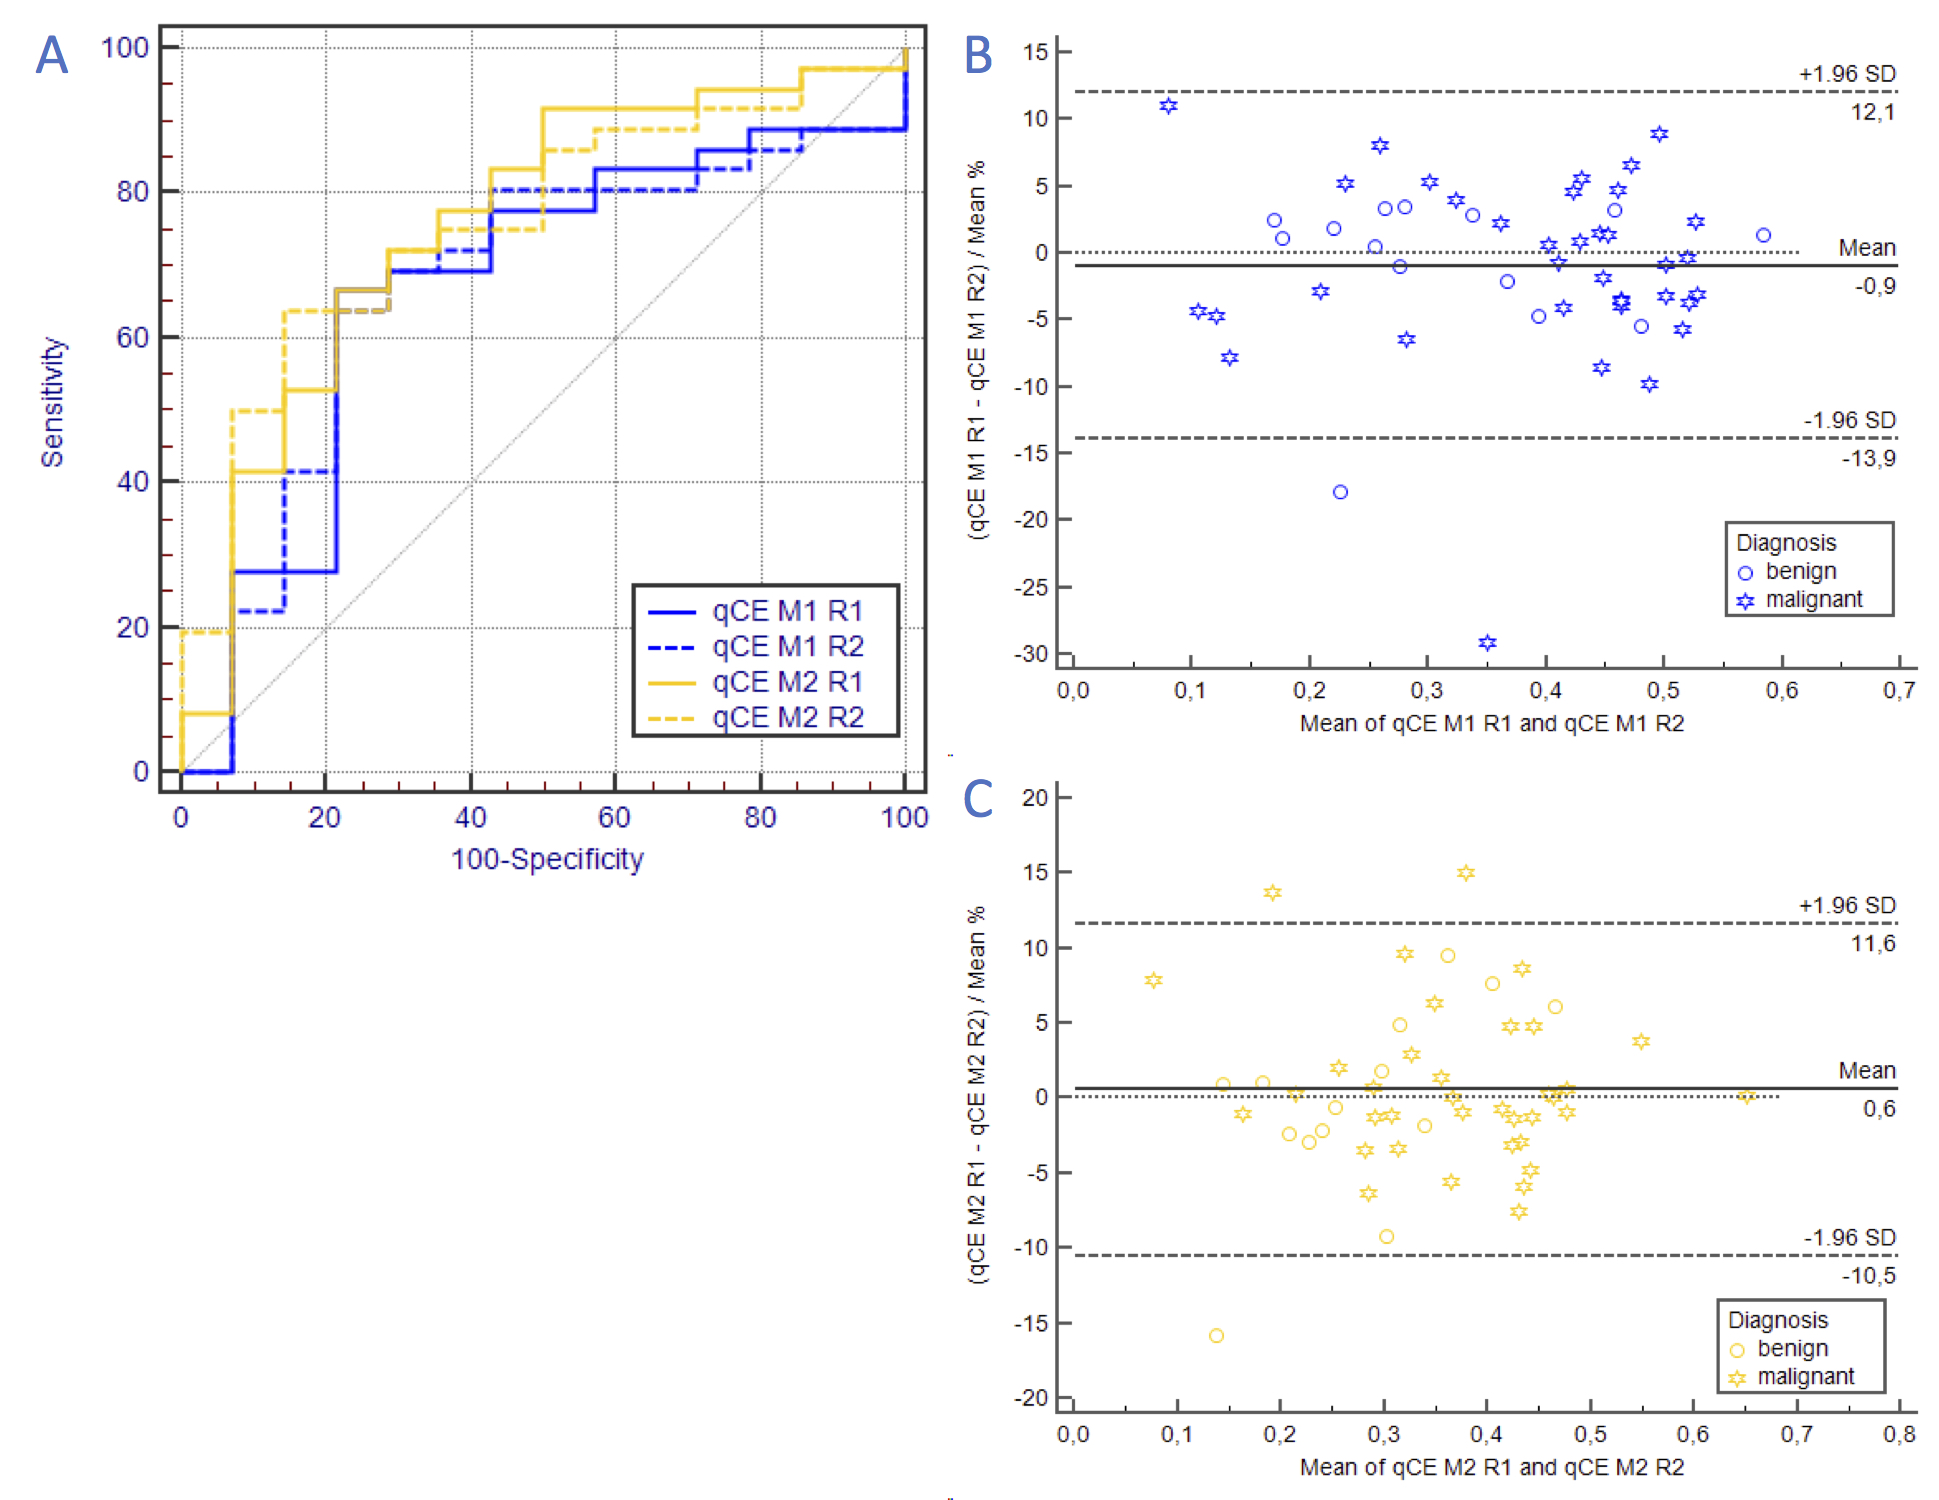
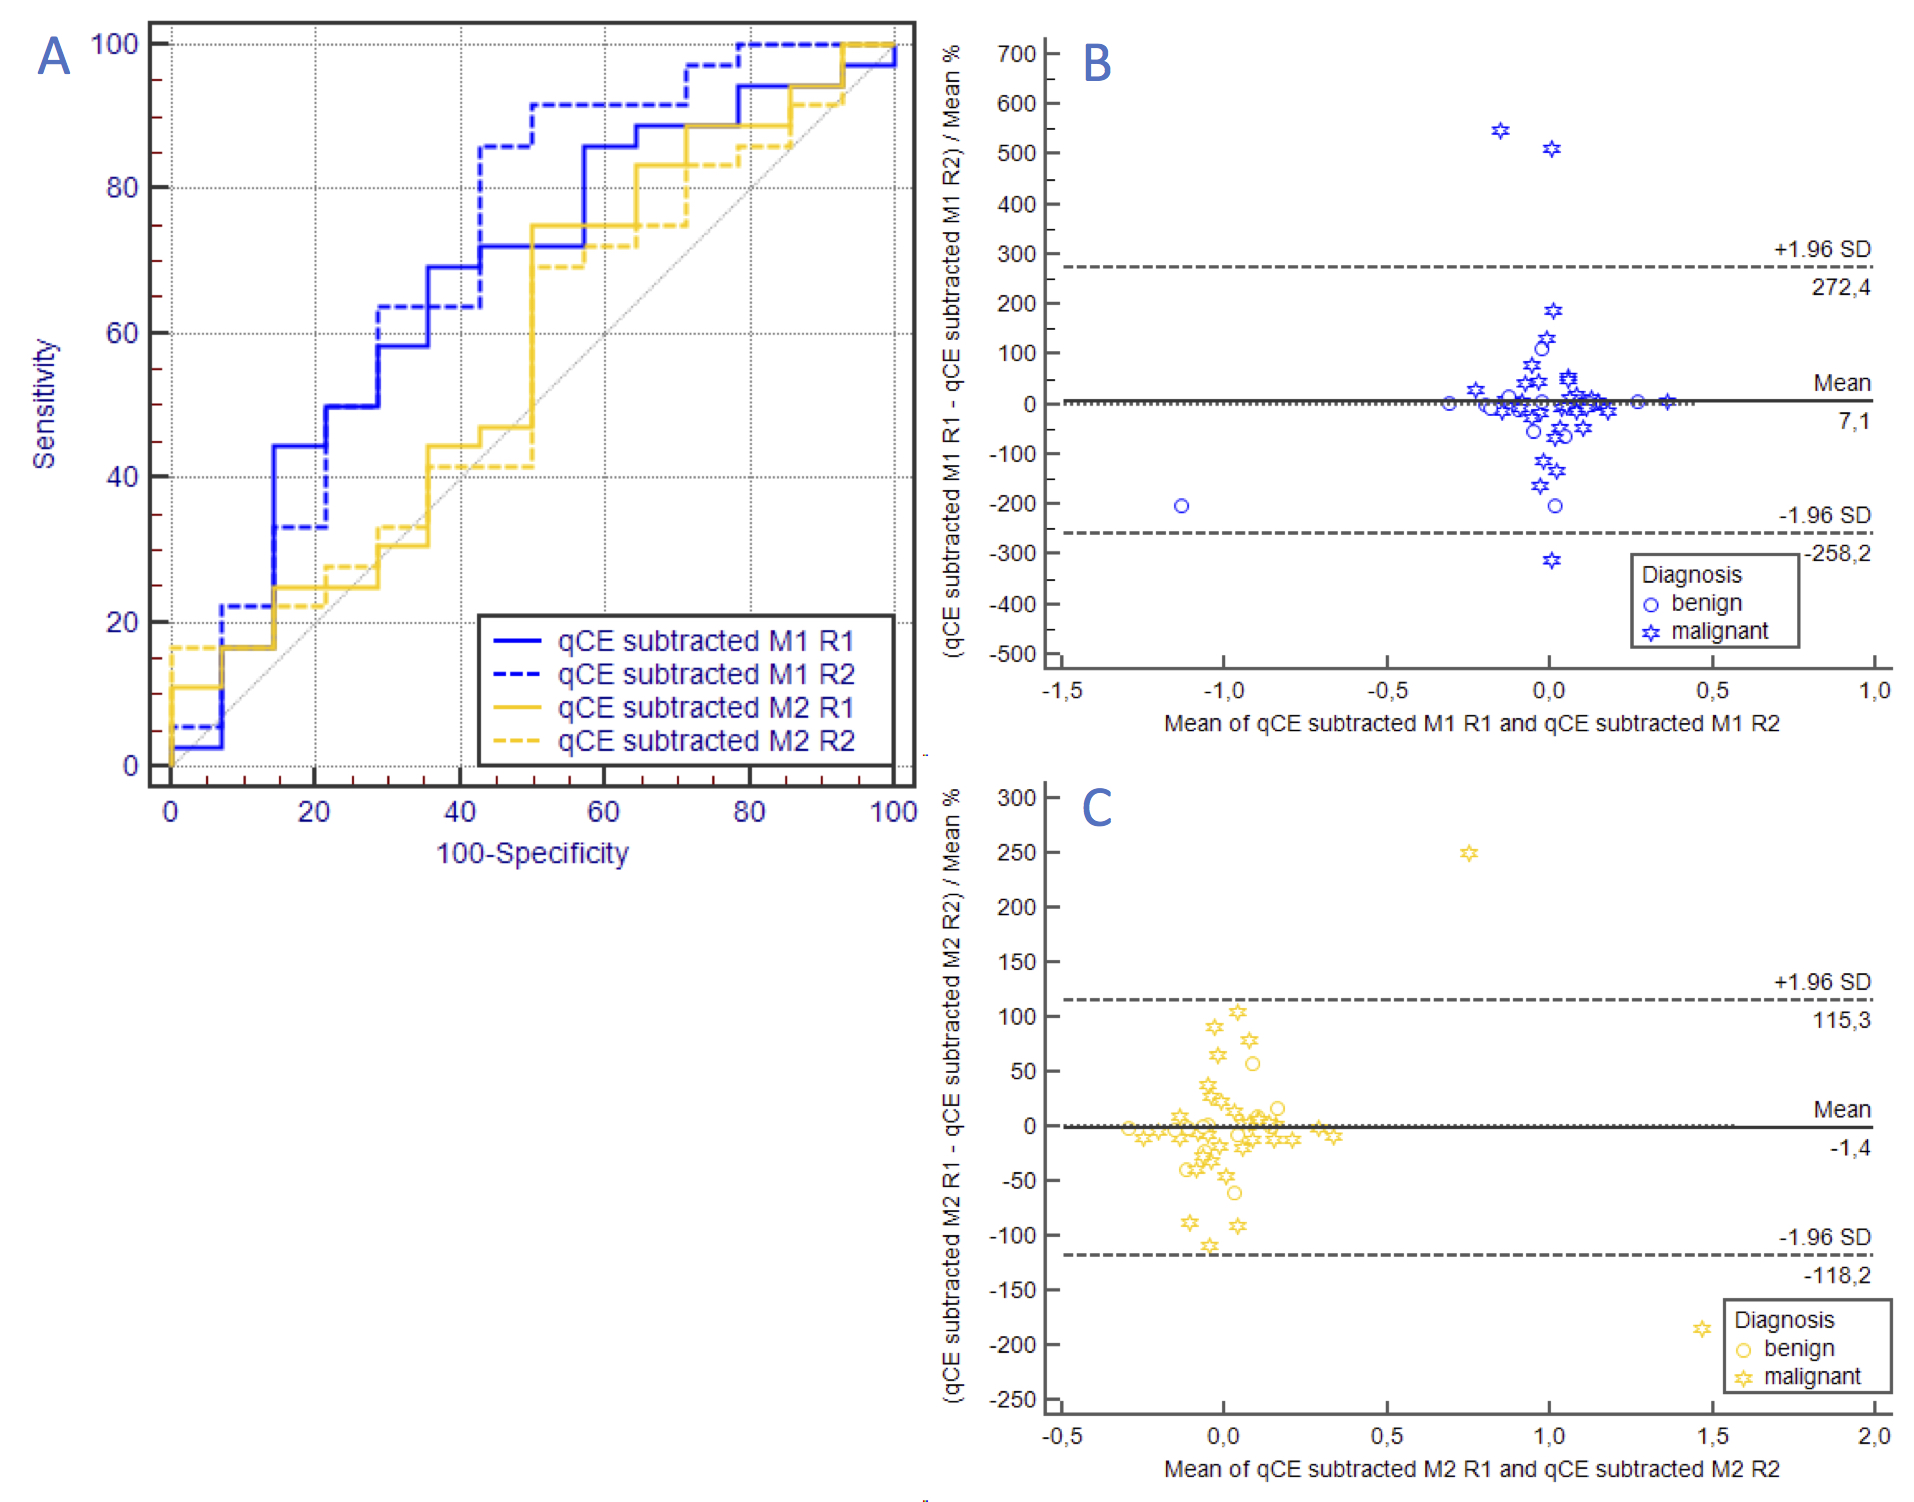
50 patients (mean patient age: 57.3 years (range 21-83.6)), harboring 50 lesions (36 malignant, 14 benign) were assessed. Ipsilateral enhancing voxel volume versus histological outcome results in an AUC of 0.669±0.09 (95%-CI:0.521–0.795) and 0.671±0.087 (95%-CI:0.523–0.797) for Multihance, reader 1 and 2, respectively and in an AUC of 0.758±0.079 (95%-CI:0.616–0.868) and 0.758±0.073 (95%-CI:0.616–0.868) for Dotarem, reader 1 and 2, respectively with excellent interreader agreement (Figure 2). Subtracted contralateral enhancing volume from ipsilateral enhancing voxel volume versus histological outcome results in an AUC of 0.669±0.088 (95%-CI:0.521–0.795) and 0.712±0.09 (95%-CI:0.567–0.831) for Multihance, reader 1 and 2, respectively and in an AUC of 0.575±0.094 (95%-CI:0.4428–0.714) and 0.556±0.09 (95%-CI:0.408–0.696) for Dotarem, reader 1 and 2, respectively and is highly reproducible (Figure 3).DISCUSSION
Results from this study indicate that simple CAD-based determination of enhancing voxel volumes could be a viable approach to identify exams harboring a malignant lesion. Both assessment methods, one analyzing only the ipsilateral breast (method 1) and the other accounting for BPE of the contralateral breast (method 2) yield similar performance values and excellent reproducibilty. To assess the potential influence of contrast agent relaxativities we compared Gd–BOPTA (MultiHance) and Gd–DOTA (Dotarem), which are on the high end and the low end in terms of relaxativity, respectively6,7. At equimolar dosages Dotarem exhibited a better performance (although not statistically significant) when basing the assessment on enhancing voxel volumes of the ipsilateral side alone which was reversed when the CAD approach accommodated the background parenchymal enhancement approximated by the enhancing voxel volumes of the contralateral side. We postulate that the higher relaxativity of Multihance lead to a higher background parenchymal enhancement/noise that effected a lower sensitivity when analyzing the ipsilateral side alone, while this higher signal constituted an advantage for method 2 where after subtraction of BPE there was still enough signal left to detect more subtle findings. Since both methods perform equally well, and method 2 necessitates a healthy contralateral breast, the more simple unilateral approach, based solely on enhancing voxel volumes, seems to be more apt for a potential clinical application.CONCLUSION
The findings from this pilot studies suggest that quantitatively assessed enhancing breast tissue as a percentage of the entire breast volume may serve as an indicator for breast cancer. However, before further developing either method, differences in contrast media should be accounted for.Acknowledgements
No acknowledgement found.References
1. Song SE, Seo BK, Cho KR, et al. Computer-aided detection (CAD) system for breast MRI in assessment of local tumor extent, nodal status, and multifocality of invasive breast cancers: preliminary study. Cancer Imaging. 2015;15:1.
2. Renz DM, Böttcher J, Diekmann F, et al. Detection and classification of contrast-enhancing masses by a fully automatic computer-assisted diagnosis system for breast MRI. J Magn Reson Imaging. 2012;35(5):1077–1088.
3. Bennani-Baiti B, Bennani-Baiti N, Baltzer PA. Diagnostic Performance of Breast Magnetic Resonance Imaging in Non-Calcified Equivocal Breast Findings: Results from a Systematic Review and Meta-Analysis. PLoS ONE. 2016;11(8):e0160346.
4. Houssami N, Ciatto S, Macaskill P, et al. Accuracy and surgical impact of magnetic resonance imaging in breast cancer staging: systematic review and meta-analysis in detection of multifocal and multicentric cancer. J Clin Oncol. 2008;26(19):3248–3258.
5. Warner E, Messersmith H, Causer P, Eisen A, Shumak R, Plewes D. Systematic review: using magnetic resonance imaging to screen women at high risk for breast cancer. Ann Intern Med. 2008;148(9):671–679.
6. Laurent S, Elst LV, Muller RN. Comparative study of the physicochemical properties of six clinical low molecular weight gadolinium contrast agents. Contrast Media Mol Imaging. 2006;1(3):128–137.
7. Rohrer M, Bauer H, Mintorovitch J, Requardt M, Weinmann H-J. Comparison of magnetic properties of MRI contrast media solutions at different magnetic field strengths. Invest Radiol. 2005;40(11):715–724.
8. Baltzer PAT, Renz DM, Kullnig PE, Gajda M, Camara O, Kaiser WA. Application of computer-aided diagnosis (CAD) in MR-mammography (MRM): do we really need whole lesion time curve distribution analysis? Acad Radiol. 2009;16(4):435–442.
Figures