2533
Improvement of ADC Precision in Left Liver Lobe by Weighted Averaging1Hitachi, Ltd. Healthcare Business Unit, Tokyo, Japan
Synopsis
The signal intensity in liver DWI was induced by the cardiac motion. A new post-processing method using weighted image averaging is evaluated to mitigate these signal loss of pixels. The proposed method suppressed the signal loss and the precision of ADC was improved.
Introduction
Diffusion weighted image (DWI) has high lesion-to-background contrast and is used for the lesion detection. Apparent diffusion coefficient (ADC) is used for the characterization of the lesion. However, the signal intensity in left liver lobe region is varied by the cardiac motion and therefore the precision of ADC is reduced [1]. It has been reported that the main cause of the signal loss was the respiratory motion or the pulsation motion [2, 3]. In general, these signal loss is reduced with cardiac gating [3] or compensated motion probing gradient (MPG) [4]. However, scan time becomes longer when cardiac gating is used, and the compensated MPG leads a limitation in TE or b-value. In this study, A new image averaging method that rejects the signal loss pixels was proposed to improve the signal intensity in DWI and precision of ADC in the left liver lobe region.Materials and Methods
Signal loss caused by delay timing
A 1.5T MRI scanner and 16 channel body coil were used for all imaging. A single shot DW-EPI sequence with the respiratory triggering was used. Main scan parameters were; TR/TE = 7500 ms/70 ms, Freq./Phase = 96/192, b-factor = 1000 s/mm2. Two healthy volunteers were scanned. This study was approved by the ethics committee of Hitachi group headquarters. The signal loss was evaluated in the point of the visualization of the liver region (Figure 1). To confirm the delay timing form the R-trigger (Figure 2), the cardiac pulse waveform was acquired simultaneously during DWI scan.
Image averaging method
Twelve sets of DWI were acquired with breath holding. Main scan parameters were; TR/TE = 4720 ms/68.5 ms, Freq./Phase = 96/128, b-factor = 1000 s/mm2. The three image weighted averaging methods were tested. Each pixel value in image was averaged using the following condition.
1) Averaging all pixel value of 12 data sets (AA)
2) Averaging pixel value which has over the median value of 12 data sets (AMM)
3) Selecting maximum pixel value from 12 data sets (Max)
The liver signal homogeneity was evaluated in visualization and the line profile. ADC map was calculated for each image weighted averaging method, and the mean ADC and the standard division (SD) in ADC were calculated from 10 ROIs in each region (Figure 5(b)).
Results and Discussion
Signal loss caused by delay timing
Figure 3 shows the relationship of delay timing and the number of the slice with signal loss. The signal loss occurred only in the delay timing is 100-300 ms and the signal loss didn’t occur in b=0. It is supposed that the signal loss of liver was induced by the cardiac motion with delay timing of 100-300 ms. If the signal loss pixels are included in the averaging process, the signal intensity of DWI is varied and ADC is elevated artificially [2]. These pixels should be rejected from the ADC calculation to improve the precision of ADC. It is supposed that signal loss doesn’t occur in over half image because the critical delay of signal loss (almost 200 ms) was shorter than R-R interval (almost 1000 ms).
Image averaging method
Figures 4(a-c) show the resulting images from each image weighted averaging method and (d) shows line profiles of them. Although AA method (figure 4(a) had high SNR, it had the shading in superior region (Figure 4(d)). In AMM (figure 4(b)), the shading was reduced (Figure 4(d)) and SNR of liver region was almost same as AA. The shading was minimized in Max case (figure 4(c, d)), but the SNR was reduced significantly.
Figure 5(a) shows ADC maps from each method. An artificial elevated ADC of AA (figure 5(a-1)) was reduced in AMM and Max (figure 5(a-2,3)). Figure 5(c) shows measured mean ADCs and SDs. Mean ADC and SD of AA in left superior lobe was bigger than other region and other method, and these stability depended on the distance from the heart. It is supposed that the reason of the elevated ADC is that left superior lobe is most shakable region by cardiac motion. Mean ADC and SD of AMM and Max in all regions were almost same value. Mean ADCs and SDs of the healthy volunteer in all regions would have almost same value, therefore it is supposed that the precision of ADC was improved in AMM or Max image. AMM is optimal in the point of the precision of ADC and SNR.
Conclusion
The signal loss was induced by the cardiac motion with delay timing of 100-300 ms. And the signal intensity of DWI and the precision of ADC in left liver lobe was improved by the proposed method.Acknowledgements
No acknowledgement found.References
1. Nasu K, Kuroki Y, Sekiguchi R, Kazama T, Nakajima H. Measurement of the apparent diffusion coefficient in the liver: is it a reliable index for hepatic disease diagnosis?. Radiat Med. 2006; 24:438–444.
2. Kwee TC, Takahara T, Niwa T, Ivancevic MK, Herigault G, Van Cauteren M, Luijten PR. Influence of cardiac motion on diffusion-weighted magnetic resonance imaging of the liver. MAGMA. 2009; 22:319–325.
3. Katsuhiro Nasu, et al. Measurement of the apparent diffusion coefficient in the liver: is it a reliable index for hepatic disease diagnosis?. Jpn J Radiol. 2006; 24(6):438–444.
4. Eric Aliotta, et al. Proc In 23th ISMRM, Motion Compensated Diffusion-Weighted MRI in the Liver with Convex Optimized Diffusion Encoding (CODE). 2015; 0728.
Figures
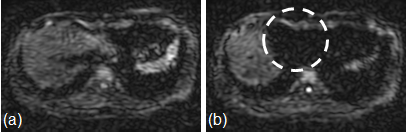
Figure 1 DW image (b=1000)
(a) without signal loss, (b) with signal loss

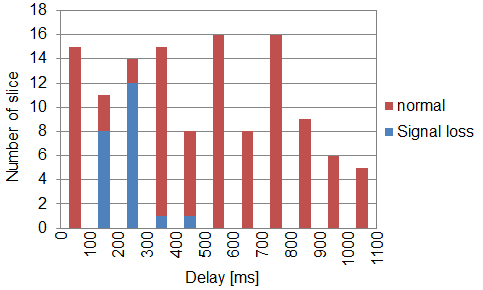
Figure 3 Delay - Number of slice with signal loss
The signal loss occurred in the delay = 100 - 300ms.
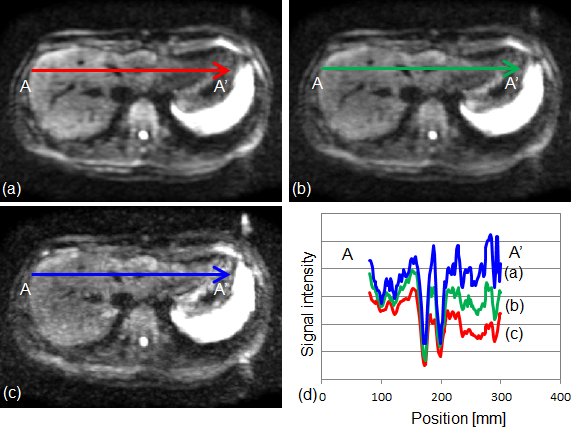
Figure 4 Averaged DW image (b=1000)
(a) Average of all 12 data (NSA = 12), (b) Average more than median (NSA = 6)
(c) Maximum (NSA = 1), (d) Line profile (A-A’)
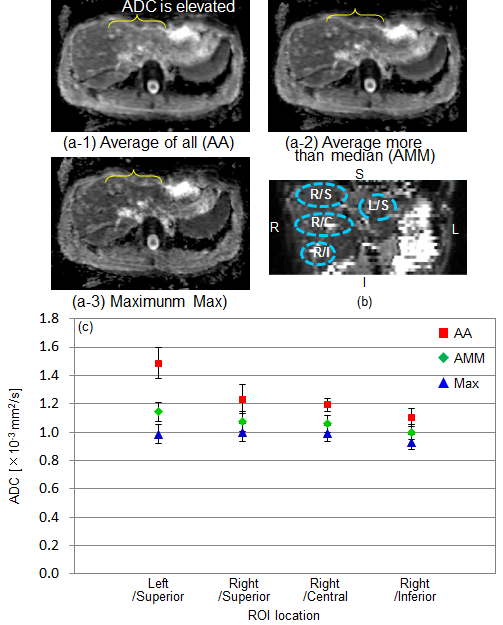
Figure 5 Precision of ADC
(a) ADC map, (b) Measurement region
(c) Mean ADC and SD in each region