2522
Detection of liver fibrosis from MRIusing histogram of strainsYasmine A. Safwat1, Rasha S. Hussein2, Ayman Khalifa3, Ahmed S. Ibrahim4, Ahmed Samir5, Heba Abdallah6, and Ahmed S Fahmy7
1Center for Informatics Science, Nile University, Cairo, Egypt, 2Radiodiagnosis, Ain Shams University, Cairo, Egypt, 3Biomedical Engineering Department, Helwan University, Cairo, Egypt, 4Radiodiagnosi, Ain Shams University, Cairo, Egypt, 5Tropical Department, Ain Shams University, Cairo, Egypt, 6Tropical Medicine Department, Ain Shams University, Cairo, Egypt, 7Biomedical Engineering Department, Cairo University, Cairo, Egypt
Synopsis
In this work, we present the results of a novel method for detecting liver fibrosis from tagged MRI images. The method is based on extracting a set of features representing the liver deformations induced by the heart motion. First, the tagged MRI images are analyzed to calculate the liver tissue strain induced by the heart motion. The histogram of the peak strain values at each point within the liver are used as feature vectors to classify normal from patients with liver fibrosis. Classification using support-vector-machines using data of 34 subject (15 normal, 19 patients) showed sensitivity and specificity of 89%, and 80% respectively.
INTRODUCTION
Liver fibrosis is the
accumulation of scar tissue caused by inflammation and cell death. Fibrotic
liver is characterized by increased stiffness of the liver tissues, a feature
that has been used by several methods to detect and stage liver fibrosis[1].
Recently, a number of
studies have shown that liver deformation induced by the heart motion can be
used to detect liver fibrosis. In these studies, the liver tissue deformation
was achieved by ECG-gated tagging-based MRI techniques [2]. For
example, Chung et al showed that there is a significant difference in the peak
strain and displacement values among normal and cirrhotic (late stage of
fibrosis) patients. In this work, we introduce a new set of features, namely,
the histogram of the peak strain (HOPS) values within the liver that can be
used to detect liver fibrosis. Results on 34 subjects showed potential of the
HOPS as an indicator of liver fibrosis disease.
Method and Materials
ECG-gated
tagged MRI was performed on 15 volunteers and 19 patients (with fibrosis stage
from F1 to F3 diagnosed by Fibroscan and/or liver biopsy). Sagittal
cross-sections (1-3 slices) were acquired with tag spacing=7mm, voxel size =1.18×1.18×8mm,
11-20 frame/cardiac cycle. Lagrangian strain tensors of all the points within
the liver were calculated using phase-based tracking methods. Then, at each
timeframe, the strain in the superior-inferior direction (major direction of
motion), P1(t), and the strain in the perpendicular direction, P2(t), were
computed. At each liver point, the peak tissue strain throughout the cardiac
cycle is calculated to yield PP1 and PP2. The histogram of the peak strains
within the liver is calculated for both directions to yield two feature vectors
HOPS1 and HOPS2. Both vectors are also concatenated to form one feature vector,
HOPS. Support Vector Machines classifier was used to classify the feature
vectors. A leave-one-out
cross-validation is used, by leaving one case as testing set and the remaining
cases as training set. The process is repeated until testing all datasets.
Results
Figures 1 and 2 show the peak strain maps (PP1
and PP2) in a volunteer and a patient. Not only the peak strain value differs
but also the distribution of the strain values. Table 1 summarizes the performance
of the classifier when using the histogram of only one strain direction (HOPS1
or HOPS2) or both directions (HOPS) as feature vectors. The table, shows that
the proposed method results in an accuracy of 85% when HOPS2 is used as a
feature vector.
conclusion
A new method for detecting liver fibrosis using
tagged MRI images was presented. The results show accuracy of 85% for patients
with moderate fibrosis (stages from F1 to F3).
[1] Cales P, Oberti F, Michalak S, et al. A
novel panel of blood markers to assess the degree of liver fibrosis. HEPATOLOGY.
2005; 42:1373-1381.
[2]
Chung S, Mannelli B, and Axel L. et al., “Liver stiffness
assessment by tagged MRI of cardiac induced liver motion,” Magn Reson Med.,
65(4), 2011.
Acknowledgements
No acknowledgement found.References
[1] Cales P, Oberti F, Michalak S, et al. A novel panel of blood markers to assess the degree of liver fibrosis. HEPATOLOGY. 2005; 42:1373-1381. [2] Chung S, Mannelli B, and Axel L. et al., “Liver stiffness assessment by tagged MRI of cardiac induced liver motion,” Magn Reson Med., 65(4), 2011Figures
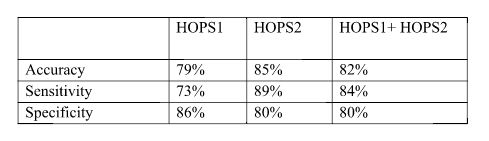
Table 1
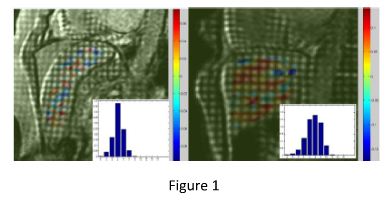
Fig 1
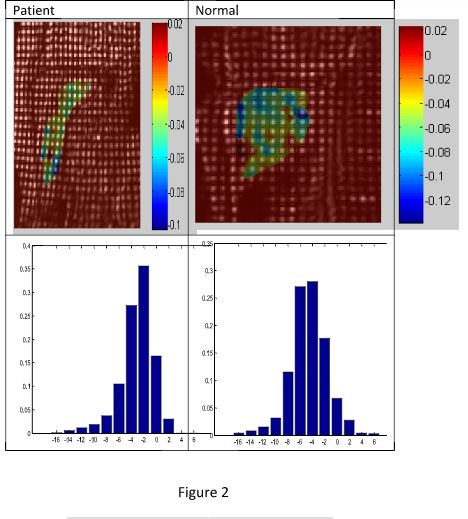
Fig2