2521
Automated contouring and ADC measurement of esophageal cancer with a fully convolutional network1Imaging Physics, MD Anderson Cancer Center, Houston, TX, United States, 2Radiation Oncology, MD Anderson Cancer Center, Houston, TX, United States, 3Diagnostic Radiology, MD Anderson Cancer Center, Houston, TX, United States
Synopsis
A Fully Convolutional Network (FCN) was developed and applied to the task of contouring esophageal tumors on diffusion weighted images. After proper training, tumor classification by the FCN demonstrated excellent agreement with tumor contours from an inter-reader agreement study in the validation images. The FCN was able to achieve correct tumor classification in most cases with respect to different tumor position and shapes, and in the presence of intratumoral esophageal lumen.
Introduction
Changes in apparent diffusion coefficients (ADC) of esophageal cancer under neoadjuvant chemoradiation have demonstrated utility in early assessment of treatment response1,2. However, ADC quantitation is directly dependent on tumor contouring, which is performed manually and can be labor intensive and inconsistent among different users. In this study, we report our initial implementation of a Fully Convolutional Network (FCN) for automated tumor contouring and our encouraging results in applying FCN to the task of contouring esophageal tumors on diffusion weighted images for early assessment of treatment response.Methods
Sixty patients with esophageal cancer were enrolled in a prospective study. During a standard treatment of 5-6 weeks of chemoradiation, patients underwent separate MR scans at baseline (before treatment), interim (after two weeks of treatment), and at first follow-up. All MR scans were acquired on a GE 3.0 T whole body scanner (MR750, GE Healthcare) with a 32-channel torso phased array coil. Each MR study contained a DWI series with the following scan parameters: b-values=0, 200, 800 s/mm2, FOV=46x46cm, slice thickness=4 mm, TR/TE=5000/70 ms, and matrix=96x96. Images from all b-values were fitted with a mono-exponential model to generate a quantitative ADC map. Volumetric contouring was completed by a single reader for all patients on b=200 s/mm2 images. For a subset of 10 patients, contouring was also performed by four additional readers.
Our FCN was developed within Tensorflow3, and was tasked with the classification of tumor and background. The network architecture was similar to that used by Shelhamer et al4, and consisted of 8 convolutional layers followed by three deconvolutional layers. The deconvolution layers were added to rescale convolution outputs back to the size of the original image to enable dense, pixel-by-pixel inference. The first 5 convolutional layers were initialized using weights and biases obtained from a VGGNet19, which was pre-trained on a subset of the ImageNet database5. The final three convolutional layers and the three deconvolution layers were initialized with random weights from a normalized distribution and with biases equal to 0. The following hyperparameter variants were tested: learning rate (10-3, 10-4, and 10-5), batch size (15 and 25), and dropout (0.5 and 0.85).
A training dataset of DWI images was generated from baseline, interim, and follow-up scans of the 50 patients contoured by the single reader. For all slices containing contoured tumor, matching training images (b=200s/mm2) and ROI maps were extracted, producing a total of 2153 training images. Pixel values were zero-centered and normalized by their standard deviation. Images and ROI maps were then cropped to include only the central 100x100 region of the image. In the same manner, validation sets were generated from the remaining 10 patients (n=155).
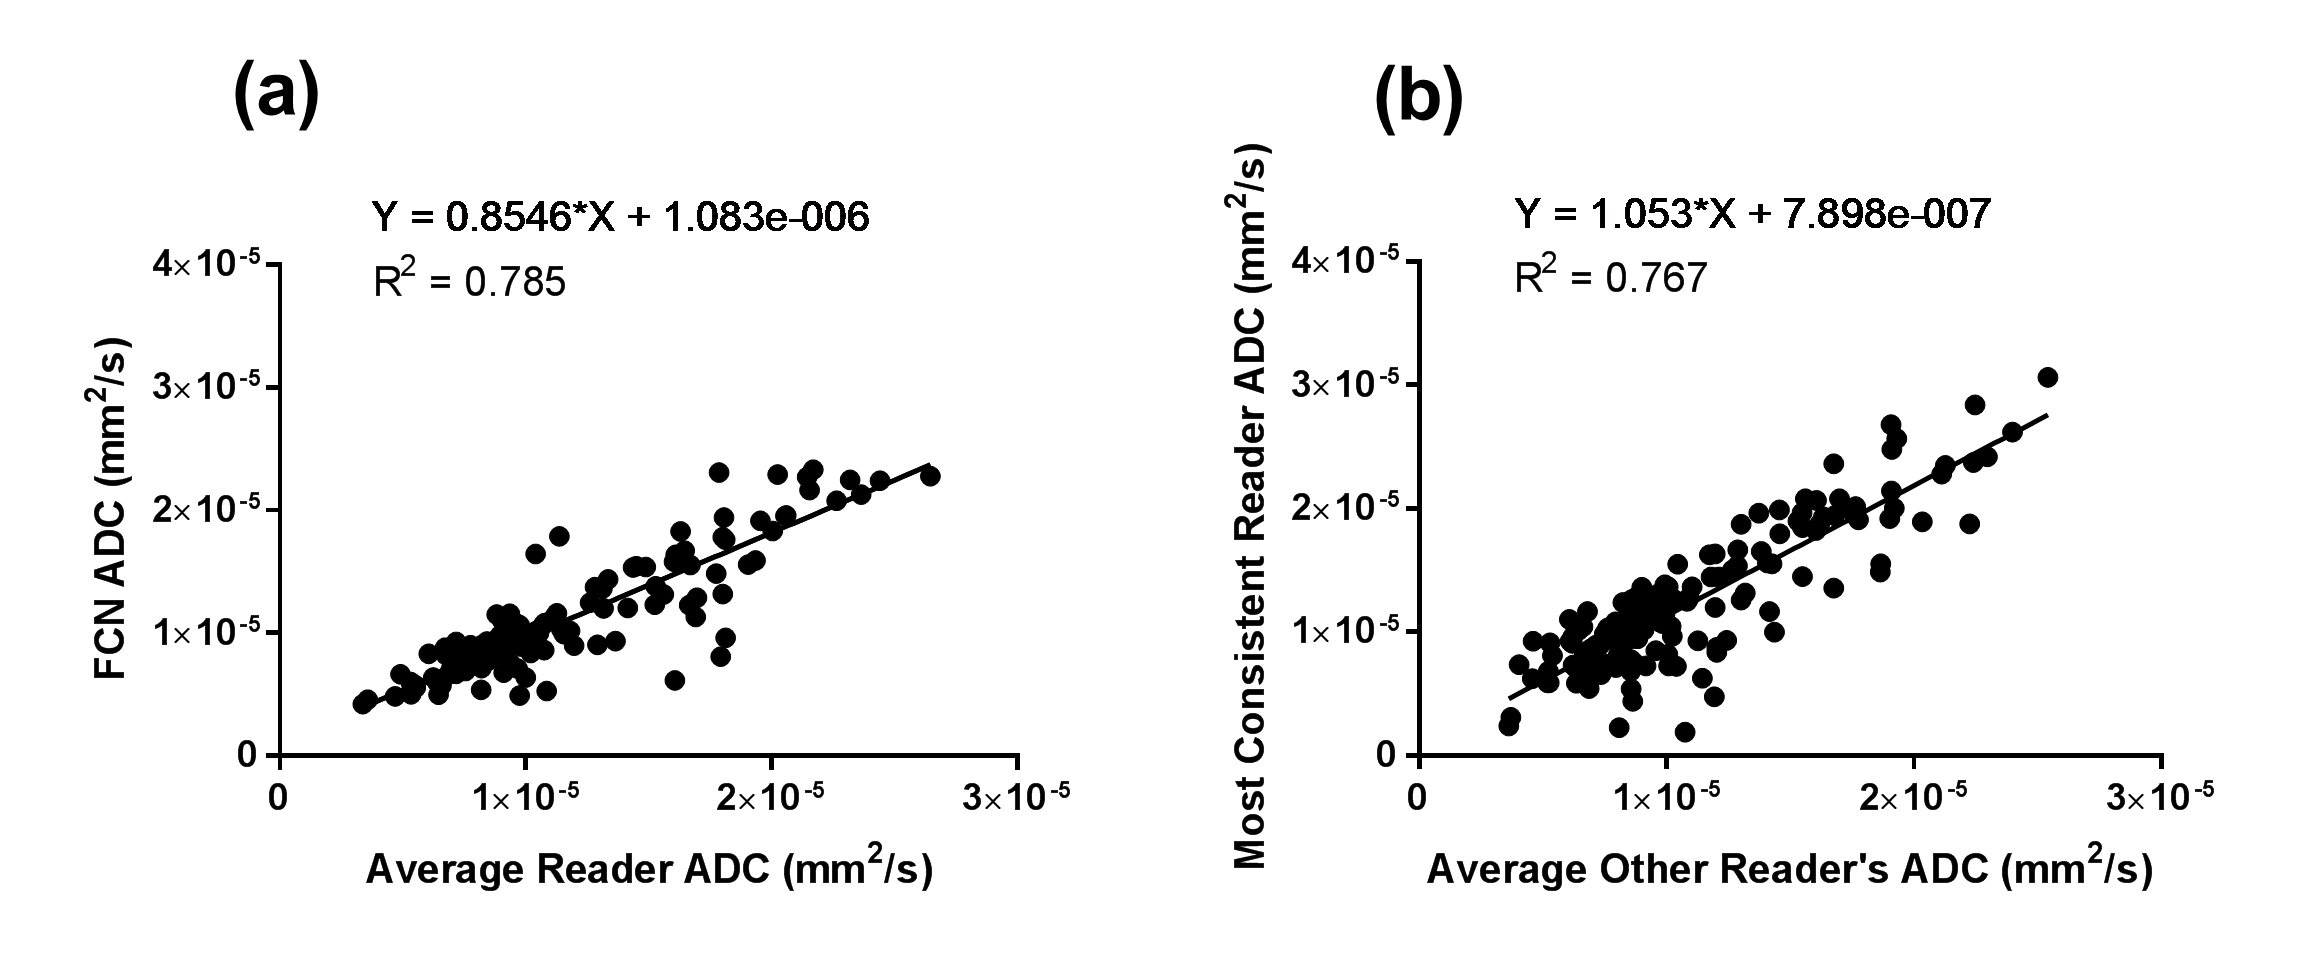
Pixel classifications by the FCN and by human readers were compared within the validation set. Average Dice Similarity Coefficient (DSC) between FCN classification and reader contours for individual slices was calculated . For comparison, average inter-reader DSC across individual slices was also calculated. For slices from baseline and interim scans, ADC measurements on each slice were computed and compared between average reader measurement and FCN with linear correlation. Linear correlations were also calculated comparing individual reader ADC to average ADC measurements by all other readers.
Results
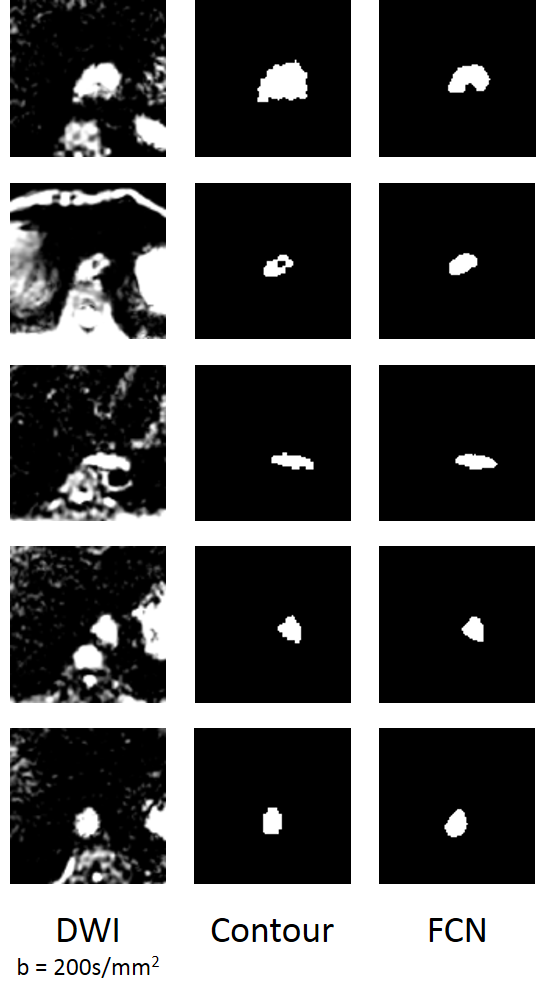
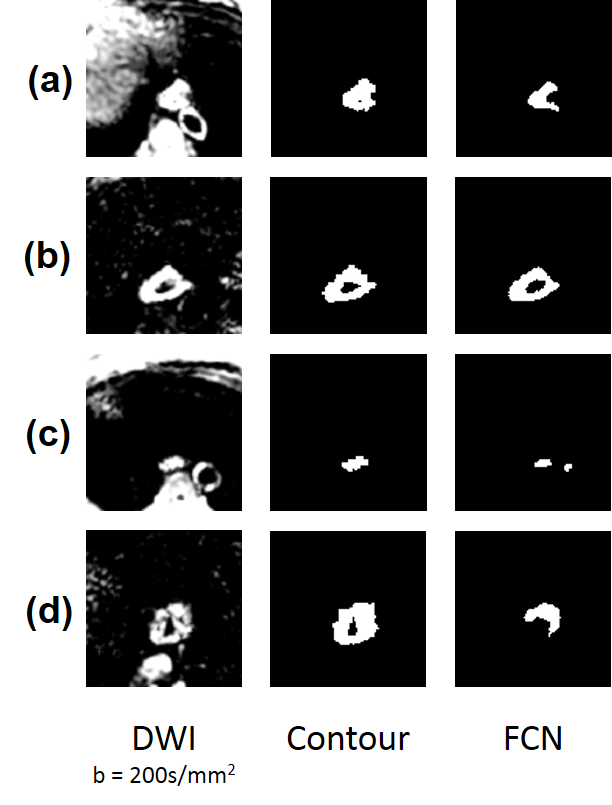
Optimal hyper-parameters were found to be the following: batch size = 15, learning rate = 10-4, and dropout = 0.5. Average DSC across all slices between FCN and all readers was 0.795. This was comparable to the inter-reader DSC of 0.805 across all slices. ADC measurements by the FCN and average reader measurement correlated strongly (R2= 0.785) (Fig. 1a). This correlation was greater than that of any human reader as compared to the average measurement of the other readers (R2max = 0.767) (Fig. 1b). The FCN classification was robust to different shapes (Fig. 2, Fig. 3a) and could exclude intratumoral lumen in many cases (Fig. 3b). In a small number of cases, nearby features such as lymph nodes and aorta were incorrectly identified as tumor by the FCN (Fig. 3c,d).Discussion
Our results demonstrate that an FCN can be used to perform the task of contouring esophageal tumors on DWI images. Despite the complex features in the images and a limited dataset, the FCN was able to match the performance of human readers in contouring tumors and measuring ADC. A full development and validation of our approach will help establish DWI and quantitative ADC as a useful imaging biomarker for early assessment of treatment response in esophageal cancer. Our approach may also be applicable to the measurement of ADC in other tumors or in other similar tasks of quantitative image analysis.Acknowledgements
No acknowledgement found.References
1. van Rossum PS, van Lier AL, van Vulpen M, et al. Diffusion-weighted magnetic resonance imaging for the prediction of pathologic response to neoadjuvant chemoradiotherapy in esophageal cancer. Radiothe Oncol. 2015;115(2):163-170.
2. Musall BC, Ma J, Carter BW, et al. Quantitative ADC as an early imaging biomarker of response to chemoradiation in esophageal cancer. Paper presented at: Proc. Intl. Soc. Mag. Reson. Med.2017; Honolulu, HI, USA.
3. Abadi M, Barham P, Chen J, et al. TensorFlow: a system for large-scale machine learning. Proceedings of the 12th USENIX conference on Operating Systems Design and Implementation; 2016; Savannah, GA, USA.
4. Shelhamer E, Long J, Darrell T. Fully Convolutional Networks for Semantic Segmentation. IEEE transactions on pattern analysis and machine intelligence. 2017;39(4):640-651.
5. Simonyan K, Zisserman A. Very Deep Convolutional Networks for Large-Scale Image Recognition. https://arxiv.org/abs/1409.1556. 2014.
Figures