2516
Evaluation of fibrosis models using 1H T1 mapping and 23Na T2*.Per Mose Nielsen1, Christian Østergaard Mariager2, Christoffer Mose Laustsen1, Marie Mose Mølmer2, and Rikke Nørregaard2
1MR Research Center, Clinical Institute, Århus N, Denmark, 2Clinical Institute, Århus N, Denmark
Synopsis
In this study we try to develop a renal IRI model which leads to fibrosis. Fibrosis markers indicate the best effect after 7 days of reperfusion. We also investigate the possibility of using 23Na T2* to evaluate fibrosis, this gave rise to a correlation with fibrosis markers only when normalizing to water transport from cortex to medulla.
Background
Renal ischemia/reperfusion injury (IRI) makes up 47% of all cases of acute kidney injury (AKI)1, and up to 1.9% of all hospitalized patients develop AKI2. AKI is an underestimated yet important factor leading to chronic kidney disease (CKD). Even after initial total recovery from AKI, some patients develop persistent deterioration of renal function. Therefore, the first aim of this study was to evaluate and establish an AKI model which can lead to fibrosis development. Currently, there is no clinical recognized non-invasive method to evaluate and quantify fibrosis in the kidney over time. The second aim is to establish a MRI sequence for fibrosis development. 1H T1 mapping has shown potential as a fibrosis marker, we therefore utilized a Look-Locker sequence for T1 mapping of fibrosis. Similar we wanted to investigate the utility of 23Na T2 mapping as fibrosis marker.Methods
Rats were subjected to 40 min of bilateral renal ischemia and reperfusion period was either 7 (200g n=6), 14 (250g n=5) or 21 days (310g n=5). As positive control 6 animals were subjected to unilateral ureteral obstruction (UUO). A group of 6 animals received sham surgery. The experiments were performed in a 9.4T MR system (Agilent) equipped with a dual tuned 23Na/1H volume rat coil. A 1H T2‐weighted Fast Spin Echo coronal and axial scan was acquired for an anatomical 1H scout. For T1-measurements, a single-slice segmented Look–Locker sequence with gradient-echo readout was used to acquire T1-weighted data. A dynamic contrast-enhanced (DCE) T2*-weighted sequence was performed using an axial 1H gradient-echo sequence, covering both kidneys in 1 slice. A single bolus of 50 µL of Dotarem was administered. Transport rate (Kcl) was calculated using the Baumann-Rudin (BR) model from cortex to inner medulla. We performed a 2D 23Na sodium chemical shift imaging (CSI) sequence for T2* 23Na acquisition. After MRI scan sessions, kidneys, urine and plasma were stored for further biochemical analyses.Results and discussion
Interestingly, we found an early elevation in fibrosis markers (fibronectin and αSMA) after 7 days of reperfusion. After 21 days both fibronectin and αSMA protein levels were nearly equal to sham levels (figure 1). This trend was also observed at the mRNA expression of fibronectin and αSMA. We do currently not know the exact reason to this early elevation, but histological examinations will also be performed on tissue slices for further investigation. 1H T1 and 23Na T2 initially showed no correlation to fibrosis (figure 2). We speculated this was caused by the very different pathological conditions with high variation in water content on the different models. By normalizing the cortex/medulla ratio to water transport, we found a correlation between fibrosis and the MR scans.Conclusion
In conclusion, our data showed highest expression of the fibrosis markers fibronectin and αSMA at 7 days after IRI which then drops to sham levels after 21 days. Fibrosis in UUO was highest after 7 days, as was expected. Uncorrected 1H T1 and 23Na T2 showed no correlation with fibrosis. Normalizing 1H T1 and 23Na T2 to the transport constant Kcl calculated using the BR-model from DCE-MRI, gave results similar to the fibrosis markers fibronectin and αSMA. Taken together, there is still a lot of investigation needed to establish a good CKD IRI model, and to establish a MRI sequence for fibrosis development.Acknowledgements
No acknowledgement found.References
1. Hoste, E. A. J. et al. Epidemiology of acute kidney injury in critically ill patients: the multinational AKI-EPI study. Intensive Care Med. 41, 1411–1423 (2015).
2. Bellomo, R., Kellum, J. A. & Ronco, C. Acute kidney injury. Lancet 380, 756–766 (2012).
Figures
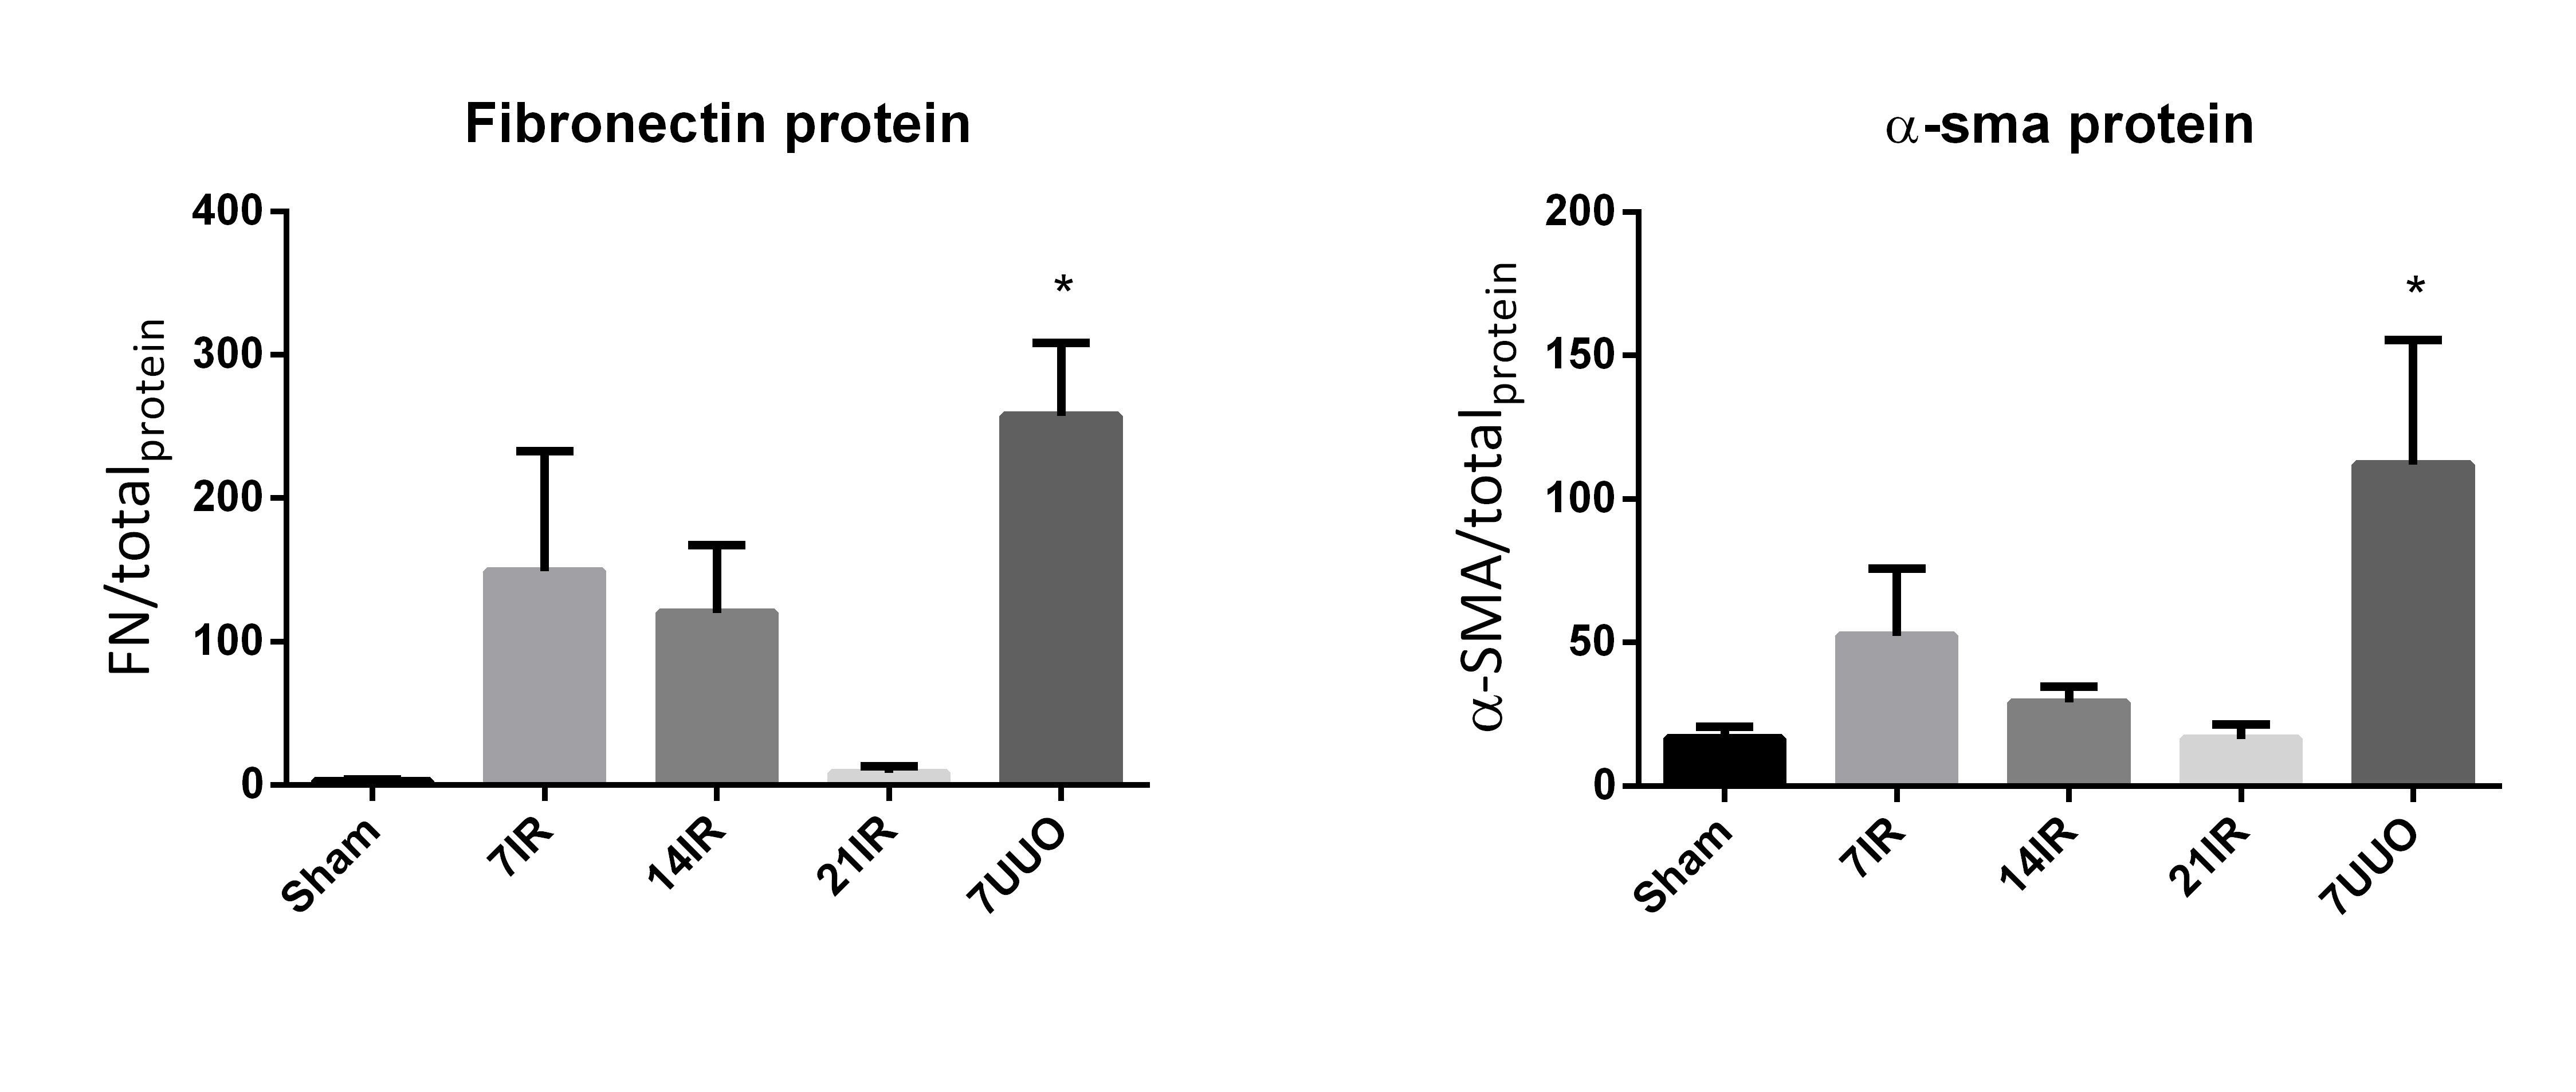
(left) Protein levels of Fibronectin, normalized to total protein in
sample. 7UUO p=0.005. (Right) Protein levels of αSMA, normalized to total protein in
sample. 7UUO p=0.03
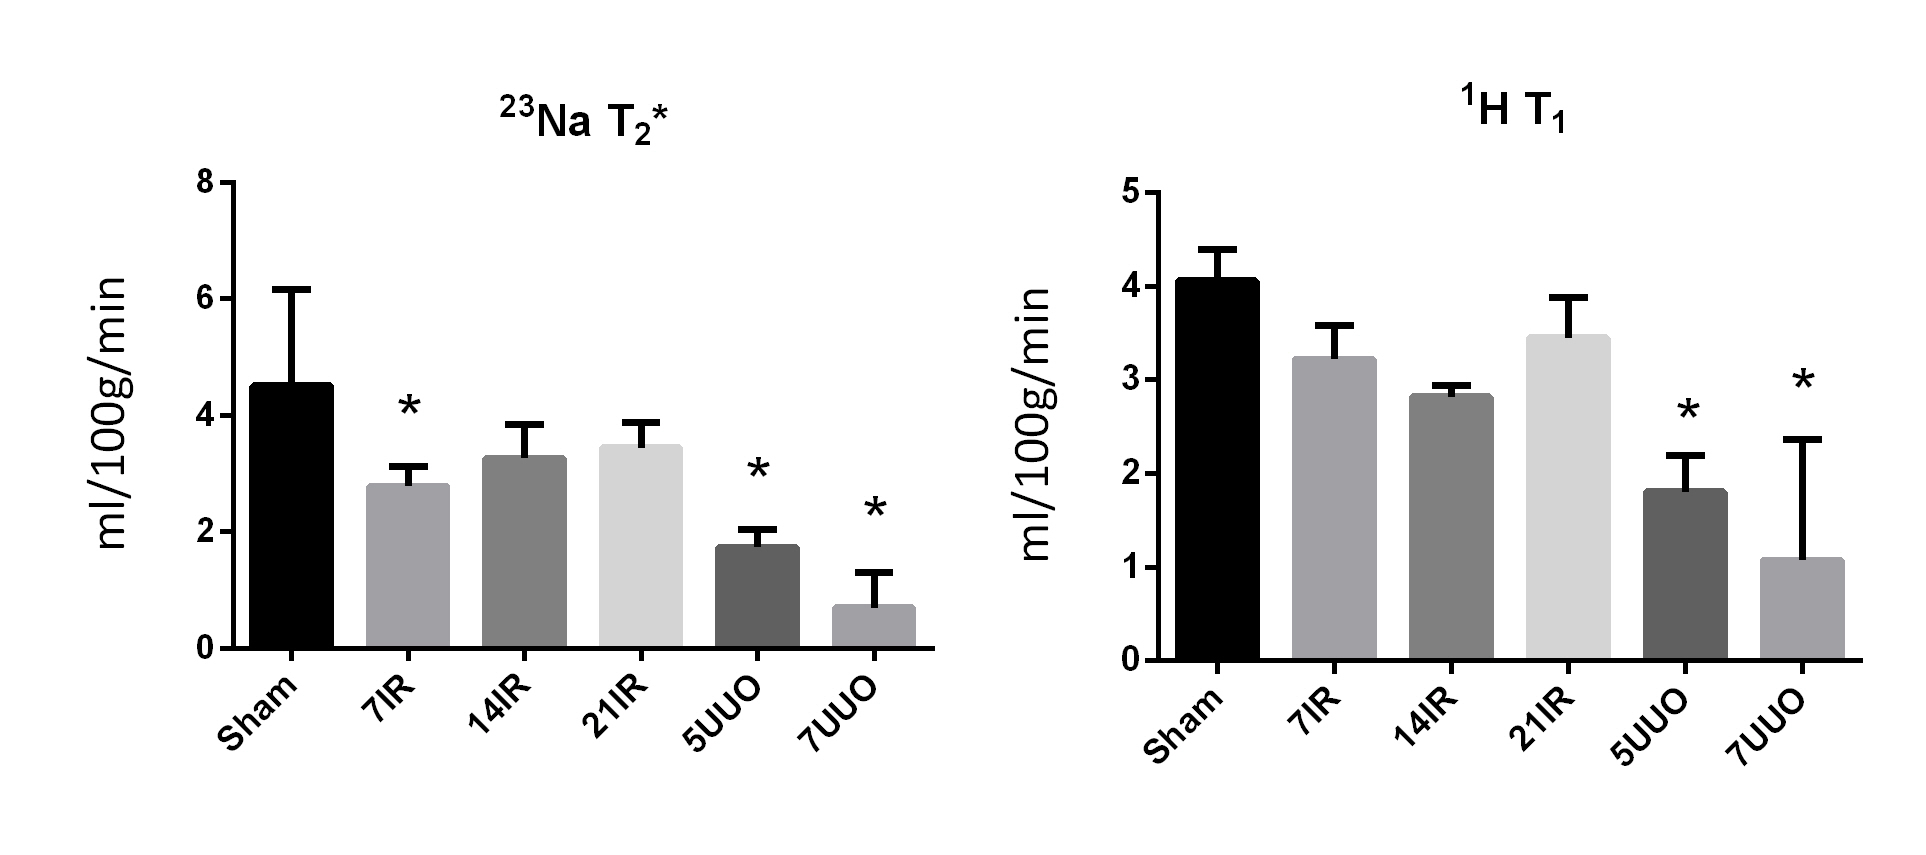
(left) Transport rate (Kcl) normalized to the 23Na
T2 ratios of cortex and medulla. 7IR p=0.04, 5UUO p<0.001, 7UUO p<0.001.
(Right) Transport rate (Kcl) normalized to the 1H T1 ratios of
cortex and medulla. 5UUO p<0.001, 7UUO p<0.001.