2513
Individual Time Series Analysis of p53 Knockout Medaka by in vivo Magnetic Resonance Microscopy1Human Health Sciences, Faculity of Medicine, Kyoto University, Kyoto, Japan, 2Human Health Sciences, Graduate School of Medicine, Kyoto University, Kyoto, Japan
Synopsis
Tumor suppressor gene p53 knockout medaka has been generated. The tumor spectrum of this medaka model, however, remains unknown. In this study, we performed individual time series analysis of p53 knockout medaka using a 14.1T MR microscopy. Extracting size change of kidney of the medaka model, we found early indications of disease and difference in phenotype due to location difference of point mutation in the p53 gene. Since p53 knockout medaka showed rather large variations in kidney slice, importance of individual time series analysis was confirmed.
Introduction
p53 is called as a tumor suppressor gene and p53 mutations are found in more than 50% of human cancer. Due to its importance, several p53 knockout animal models have been generated, such as mice1, zebrafish2, medaka fish3. In medaka models, p53 mutation shortened lifespan of medaka to about a year from about 2 years of wild type medaka without macroscopic tumors. However, knowledge of their tumor spectrum has been limited. Recently, in vivo Magnetic Resonance Microscopy was applied to follow disease progression of nonalcoholic fatty liver disease model medaka4. In this study, we applied Magnetic Resonance Microscopy to p53 knockout medaka to find early indications of disease. Especially, we focused on morphology of kidneys which had a hematopoietic function in medaka since majority of the medaka models showed weight loss and pale appearance at their final life stage.Method
Subjects:
We utilized two types of p53 knockout medaka, p53E241X/E241X strains (E), p53Y186X/Y186X strains (Y). These two types were different in locations of the point mutations. As a healthy controls, Kyoto-Cab strains (WT) were utilized.
Image Acquisition:
We visualized medaka by 14.1T Magnetic Resonance Microscopy two times per a fish leaving three or four weeks between consecutive imagings. The imaging parameters were: TR/TE=122.6/1.4276ms, FA=20°, a voxel size of 40μm×60μm×60μm, and FOV of 10mm×5.4mm×5.4mm.
Image Analysis:
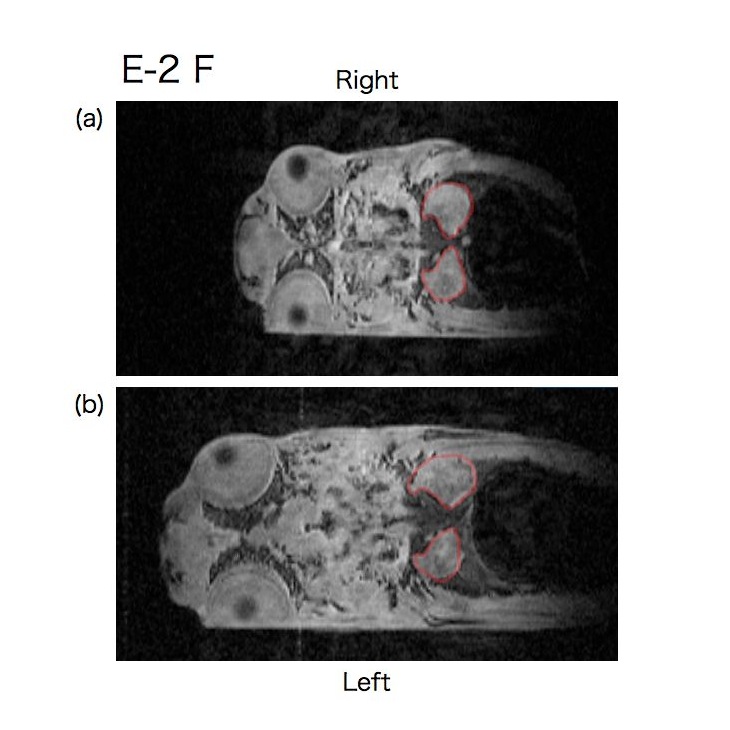
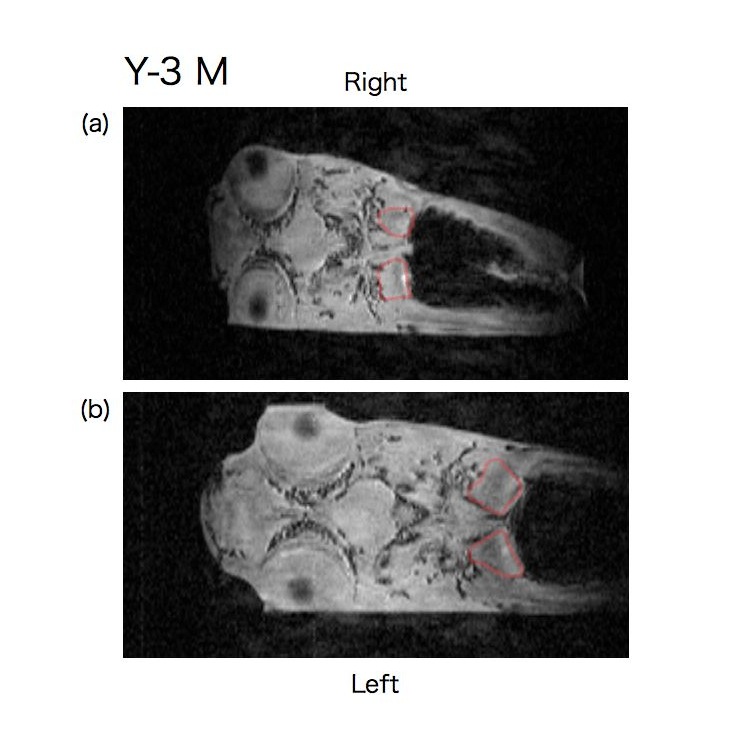
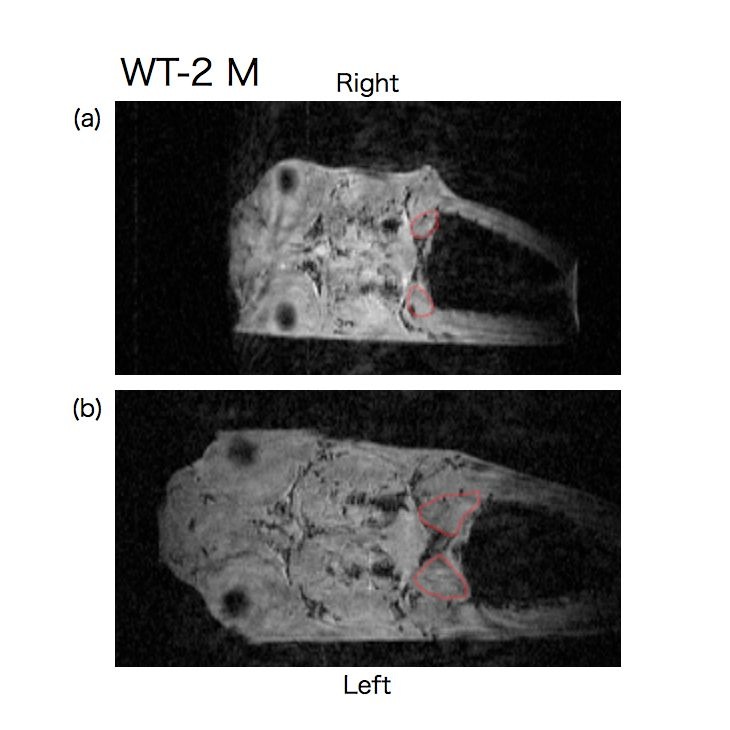
The size of 3D volume image of medaka was adjusted to have an isovoxel (40μm×40μm×40μm). From the adjusted 3D volume, a coronal slice that had largest cross sections of kidney (Fig. 1-3) was selected. In the selected coronal slice, the areas of the right and left kidney were manually segmented and used as sizes of the right and left kidney. All image analyses were done with ImageJ.
Result
Representative time series coronal slices of p53 knockout and wild type medaka are shown in Fig. 1-3. E-2 F medaka had larger size of kidney at the right side at age of 10 weeks (Fig. 1 (a)) and then the right kidney became much larger than the left kidneyat age of 14 weeks (Fig. 1 (b)). Y-3 M medaka had a similar size but different shape of kidney at age of 16 weeks (Fig. 2 (a)) and then the right kidney became much larger at age of 19 weeks (Fig. 2 (b)). WT-2 M medaka had small but nearly same size of kidney at both sides at age of 16 weeks (Fig. 3 (a)) and the kidney became larger and nearly the same size at both sides at age of 19 weeks (Fig. 3 (b)).
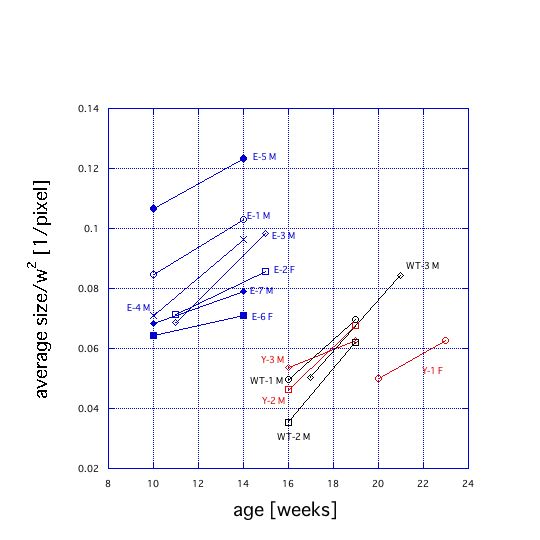
To compare the size change of kidney in different genotypes, we calculated the ratio of the average area to the square of the body width (w) (Fig. 4). Here the body width was defined as the length between centers of dark regions of eye balls. Although E medaka were younger than Y and WT medaka, E medaka had larger portion of kidney in the body area. In addition, variance of the ratio of E medaka was larger. On the other hand, Y medaka had a similar trend to WT medaka, though Y-1 F medaka showed a different trend.
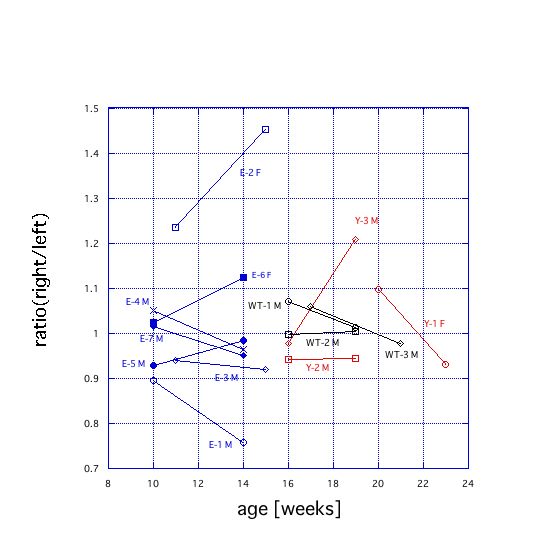
To quantify size asymmetry of kidneys, we calculated the ratio of the right to the left area of kidneys (Fig. 5). Although all WT medaka had about the same size of kidneys, some of E and Y medaka showed larger size asymmetry. Their deviations did not have the same direction. The asymmetry in E-1 M, E-2 F, and E-6 F developed with age.
Discussion
Some individuals of E medaka showed rather large portion of kidneys in the body area comparing to those of Y and WT medaka (Fig. 4). This shows that kidneys of E medaka start to swell at the early stage of life. Furthermore, swelling of kidney of E medaka tends to progress asymmetrically (Fig. 5). These findings lead to that early indications of disease were found by the time series analysis. Although one of Y medaka showed asymmetry in size of kidney, others showed a similar trend to WT medaka. Difference in a location of p53 point mutation is known to cause difference in malignancy of tumors5. The difference between E and Y medaka may be related to difference in the malignancy. The large variance of kidney in p53 knockout medaka demonstrated importance of individual time series analysis using the MR microscopy.
Conclusion
We found early indications of disease by individual time series analysis of p53 knockout medaka using the MR microscopy.Acknowledgements
The authors thank the National BioResource Project Medaka for supplying the medaka strains, M. Kinoshita (Kyoto University) for the Kyoto-cab strains, Y. Taniguchi (Kyorin University) for the p53 strains. This work was supported by JSPS KAKENHI Grant Numbers 26461825 and 17H04262. There are MTAs associated with p53 medaka, as provided by the National BioResource Project (NBRP).References
1. Donehower L A, Harvey M, Slagle B L, et al. Mice deficient for p53 are developmentally normal but susceptible to spontaneous tumours. Nature 1992; 356: 215-221.
2. Berghmans S, Murphey R D, Wienholds E, et al. tp53 mutant zebrafish develop malignant peripheral nerve sheath tumors. Proc. Natl. Acad. Sci. USA 2005; 102: 407-412.
3. Taniguchi T, Takeda S, Furutani-Seiki M, et al., Generation of medaka gene knockout models by target-selected mutagenesis. Genome Biol. 2006; 7: R116.
4. Ueno T, Suzuki H, Hiraishi M, et al. In vivo Magnetic Resonance Microscopy and Hypothermic Anesthesia of a Disease Model in Medaka. Sci. Rep. 2016; 6: 27188.
5. Lang G A, Iwakuma T, Suh Y-A, et al. Gain of Function of a p53 Hot Spot Mutation in a Mouse Model of Li-Fraumeni Syndrome. Cell 2004; 119: 861-872.
Figures