2512
Quantitative evaluation of gadolinium deposition after various gadolinium-based contrast agent injection in the rat abdominal organs .Hyewon Oh1, PanKi Kim2, ChanGyu Joo3, and YongEun Chung1
1Radiology, BK21 PLUS Project for Medical Science, Yonsei University College of Medicine, Seoul, Republic of Korea, 2Research Institute of Radiological Science, Severance Hospital, Yonsei University Health System, Seoul, Republic of Korea, 3Yonsei Biomedical Science Institute, Yonsei University College of Medicine, Seoul, Republic of Korea
Synopsis
Gadolinium-based Contrast agent (GBCA) is likely to deposit in the rat abdominal organs.
Purpose
The aim of this study was to investigate whether gadolinium is deposited in the abdominal organs depending on gadolinium-based contrast agents (GBCAs) types, administered doses, and time lapse after injection.Methods
In animal experiments, Spargue-Dawley Male rats were given a single or double dose intravenous injection of GBCA (Gadobutrol, Gadodiamide and Gadoxetic acid disodium). Rats were sacrificed 1, 4, and 12 weeks after GBCA injection and remained gadolinium (Gd) deposition were evaluated in the liver, spleen, kidney, paraspinal muscle and bone by ICP-MS. Furthermore, deferosamine was administered just after GBCA injection in separate rat groups to investigate the effect of commercially available chelation drug for preventing Gd deposition. A series of T1 weighted images was acquired with multiple spin echo sequence, and T1 map was calculated from variable repetition time in control and chelating groups for the non-invasive assessment of Gd deposition in the abdominal organs in 9.4T MR (Bruker Biospec).Results
Compared to single dose injection group, Gd was more deposited in all tissues and all types of GBCA in double dose injection group after 1 week of GBCA injection (Fig 1). After 4 and 12 weeks, deposited Gd was excreted slowly. But the relatively large amount of Gadodiamide was remained even after 12 weeks and it remained the most in the kidney, followed by spleen/bone and liver/paraspinal muscle (Fig 2). Comparing the differences between control and chelating group, there were no differences in deposited Gd. On T1 relaxometry, T1 value was shortened 1 weeks and recovered 4 weeks after GBCA administration. There was no significant change in T1 value between the control and chelating groups (Fig 3).Discussion and Conclusion
Our study experiments indicated GBCAs are partly deposited in the abdominal organ as well as brain. Although deposited Gd was released over time, but some remained until 12 weeks after injection. Furthermore, macrocyclic and ionic-linear GBCA was less deposited compared to non-ionic linear GBCA, but they also deposited and remained even 12 weeks after administration. One of the commercialized chelating agents, deferoxamine could not prevent Gd deposition.Acknowledgements
NoneReferences
[1] Tomonori Kanda, Hiroshi Oba, Keiky Toyoda et al. Brain gadolinium deposition after administration of gadolinium-based contrast agents. Japanese journal of Radiology. 2016; vol34, Issue1, 3-9
[2] Silvio aime phD, peter Caravan PhD et al. Biodistribution of gadolinium-based contrast agents, including gadolinium deposition. JMRI. 2009; vol30, Issue6, 1259-1267
[3] Murata, Nozomu MD,PhD ; Gonzelez-Cuyar, Luis F. MD; Murata, Kiyoko MD, PhD et al. Investigate Radiology. 2016; vol51,Issue7 447-453
Figures
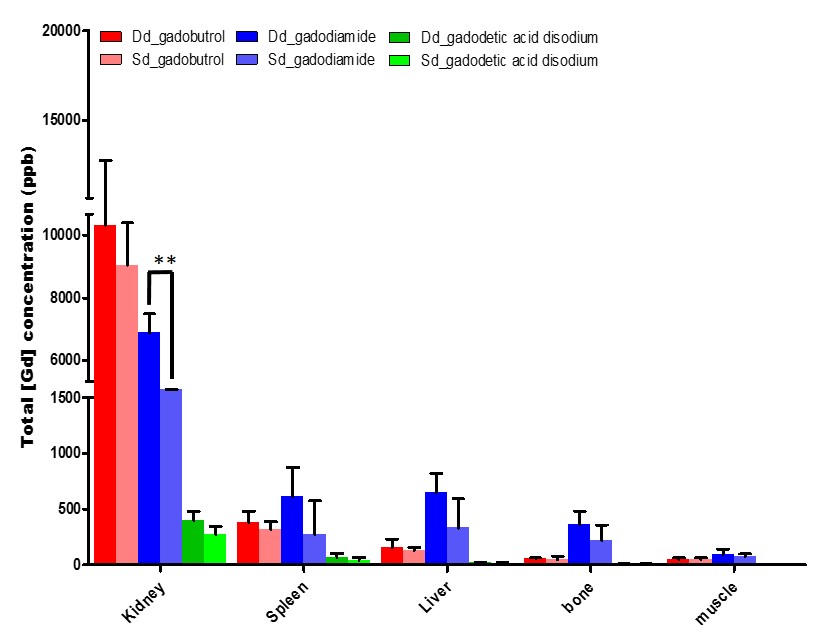
Figure1.Total Gd3+ concentration depending on the dose
GBCAs by ICP-MS. The tissues were sacrificed 1week after intravenous one times.
gadobutrol (A) gadodiamide (B) gadoxetic acid disodium. Except for kidney of
gadodiamide, all sample appears no significance. *P<0.05, Dd: double dose, Sd: single dose
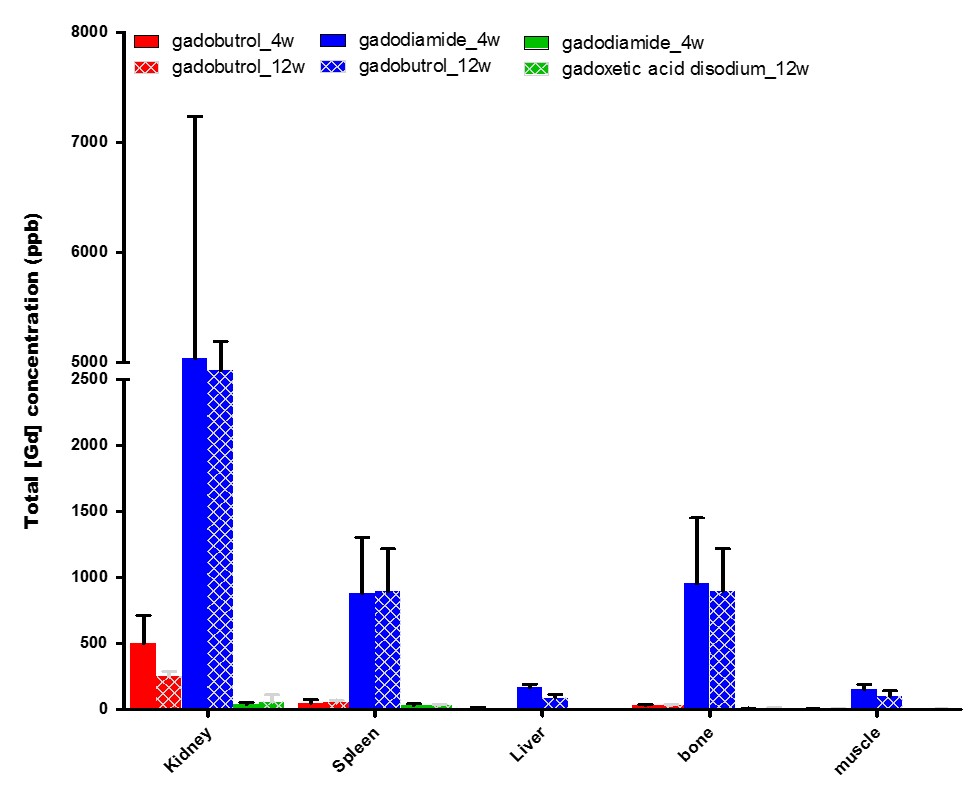
Figure2.Total GD3+ concentration measured by ICP-MS
with the difference in sacrificed period. The tissue were sacrificed 4, 12week after intravenous four times. gadobutrol (A) gadodiamide (B) gadoxetic
acid disodium (C).

Figure3.Comparing total GD3+
concentration with contrast agents and chelation by ICP-MS (A). Changes in T1 relaxation of GBCA group and
chelation group by MRI (B-D). MR1 is decreased and then MR2 becomes
equal to MR0 in Kidney. The tissues were
sacrificed 4week after Intravenous four times. MR0: Before Intravenous GBCA , MR1: after intravenous
GBCA, MR2: before sacrifice. Color bar
: GBCAs gray bar: GBCAs+ chelation in
MRI