2511
ADC quantification of lipids with high b-value stimulated echo-prepared diffusion-weighted 2D single shot TSE1Department of Diagnostic and Interventional Radiology, Technical University of Munich, Munich, Germany, 2Philips Healthcare, Hamburg, Germany
Synopsis
The prevalence of the metabolic syndrome is rapidly growing over the past decade. Fat plays a central role in the incidence and the progression of the metabolic syndrome and despite the successful clinical translation of quantitative fat MRI biomarkers into applications, current MRI biomarkers cannot answer questions about fat cell microstructure in different fat depots. This work proposes an acquisition imaging method that probes the diffusion properties of lipids, compares the proposed method to single-voxel diffusion-weighted MRS in vivo in the tibia bone marrow and investigates in vivo the dependency of ADC quantification on voxel size in gluteal fat.
Purpose
The prevalence of the metabolic syndrome is rapidly growing. The cluster of conditions, including obesity and insulin resistance1 increases by two-fold the risk for cardiovascular disease2 and by five-fold the risk for type 2 diabetes3. Emerging MR fat biomarkers, measuring adipose tissue volume and fat content, have shown promising results in monitoring lifestyle interventions and drug therapies4, but current techniques cannot answer questions about fat microstructure5. Diffusion-weighted (DW) MR is a powerful tool for gaining microstructural information. To measure the small diffusion coefficient of fat6 strong diffusion encoding and long diffusion times are required. This brings up technical issues related to eddy currents7 and increased sensitivity to macroscopic motion8. Single-voxel DW-MR spectroscopy (DW-MRS) was successfully applied to investigate lipid diffusion properties6 and recently applied to probe lipid diffusion restriction effects9. However, DW-MRS can only measure ADC averaged over a region and therefore lipid DWI is highly desirable in heterogeneous fatty tissue. In addition, DWI allows smaller voxels and could reduce the sensitivity of DW-MRS to intra-voxel dephasing in the presence of motion. Single-shot DW-EPI has been previously employed to map lipid ADC with limitations such as sensitivity to off-resonance and chemical shift artifacts10. The present work proposes a novel method that probes lipid diffusion properties with high b-value stimulated-echo prepared DW 2D single shot TSE (STE-DW TSE), compares the proposed method to DW-MRS in vivo in bone marrow and investigates in vivo the dependency of ADC quantification on voxel size in the gluteal fat depot.Methods
Pulse sequence:
The sequence is composed of a STE-DW magnetization preparation consisting of four 90° RF pulses and mono-polar diffusion sensitizing gradients, followed by a 2D single shot TSE readout (Figure 1). To eliminate eddy-current-induced phase errors, magnitude stabilizing gradients following Alsop’s method11 were introduced in the preparation and readout12.
In vivo measurements:
The tibia bone marrow was examined in a healthy subject and validated with DW-MRS. Additionally, the gluteal subcutaneous fat was scanned in 5 healthy volunteers (male/female = 4/1, mean age = 29.4). All measurements were performed on a 3T scanner (Ingenia, Philips, Best, The Netherlands). Common sequence parameters were: in-plane resolution = 2x2 mm2, TSE factor = 140, TR/TE/TMPrep/TEPrep = 1500/11/250/68ms and b-values = 100/10000/20000/40000/60000s/mm2. Tibia measurements were performed using an 8-channel extremity coil with a FOV = 140x140x2mm3 and scan time = 39s. In the gluteal fat the 12-channel posterior coil was utilized with FOV = 140x420mm2, slice thickness = 20/10/2mm, respiratory triggering, SENSE = 1.5 and scan time = ~2min. The DW-MRS sequence matched the STE-DW module, VOI = 10mm isotropic and utilized bipolar DW gradients to eliminate eddy-currents13.
Post-processing:
STE-DW TSE images were magnitude-averaged and ADC values were calculated voxel-by-voxel with mono-exponential fitting. The DW spectra were zero-order phased, apodized, frequency aligned and eddy-current corrected. Peak area quantification was performed considering eight fat peaks10.
Results
Figure 2 shows the signal decay in bone marrow observed with imaging (2b) and spectroscopy (2d). The calculated ADC agreed within 2% relative error. Figure 3 shows representative ADC maps in the gluteal fat in a healthy volunteer for different slice thicknesses. Signal decay curves measured with STE-DW TSE in the gluteal fat are shown in Figure 4. ADC values are decreasing from to from 2.78*10-5mm2/s to 1.83*10-5mm2/s when the slice thickness is decreased from 20mm to 2mm. The summary of volunteer study as the mean ADC versus slice thickness is shown in Figure 5. In both Figure 4 and 5 decreasing ADC values and a convergence towards a homogeneous ADC value is observed with decreasing voxel size.Discussion and Conclusion
STE-DW TSE and DW-MRS were shown to yield comparable ADC values in bone marrow indicating that the DW sequences agree in regions with negligible motion. In the gluteal fat, a potential source for the elevated ADC values, observed in certain regions at larger slice thicknesses, is intra-voxel dephasing caused by residual respiratory motion or table vibrations from the strong diffusion gradients. Reducing the voxel size was found to mitigate this effect and led to a more robust ADC quantification.
To the best of the authors’ knowledge, this is the first time that lipid diffusion properties are reported using DWI in a region affected by macroscopic motion. In conclusion, the proposed STE-DW TSE sequence was found capable of measuring lipid ADC within the gluteal fat, which reveals fat microstructural information and could therefore serve as a potential biomarker in the metabolic syndrome. The robustness of the ADC quantification at higher resolutions and the applicability in measuring diffusion restriction effects within adipocytes needs to be evaluated in future studies.
Acknowledgements
The present work was supported by the European Research Council (grant agreement No 677661, ProFatMRI) and Philips Healthcare.References
1 Grundy SM, et al., Circulation 109:433-438, 2004.2 Dekker JM, et al., Circulation 112:666-673, 2005.
3 Alberti KG, et al., Circulation 120:1640-1645, 2009.
4 Machann J, et al., Radiology 257:353-363, 2010
5 Hu HH, et al., NMR Biomed 26:1609-1629, 2013
6 Lehnert A, et al., Magn Reson Imaging 22:39-46, 2004
7 Reese TG, et al., Magn Reson Med 49:177-182, 2003
8 Anderson AW, et al., Magn Reson Med 32:379-387, 1994
9 Weidlich D, et al, Proceedings ISMRM 2017, p 1227
10 Steidle G, et al., Magn Reson Med Apr;65(4):1118-24
11 Alsop DC, Magn Reson Med 1997 Oct;38(4):527-33
12 Van et al., Quant Imaging Med Surg. 2017 Apr; 7(2): 238–250.
13 Ruschke et al, Magn. Reson. Med. 2016, 75: 32–41
Figures
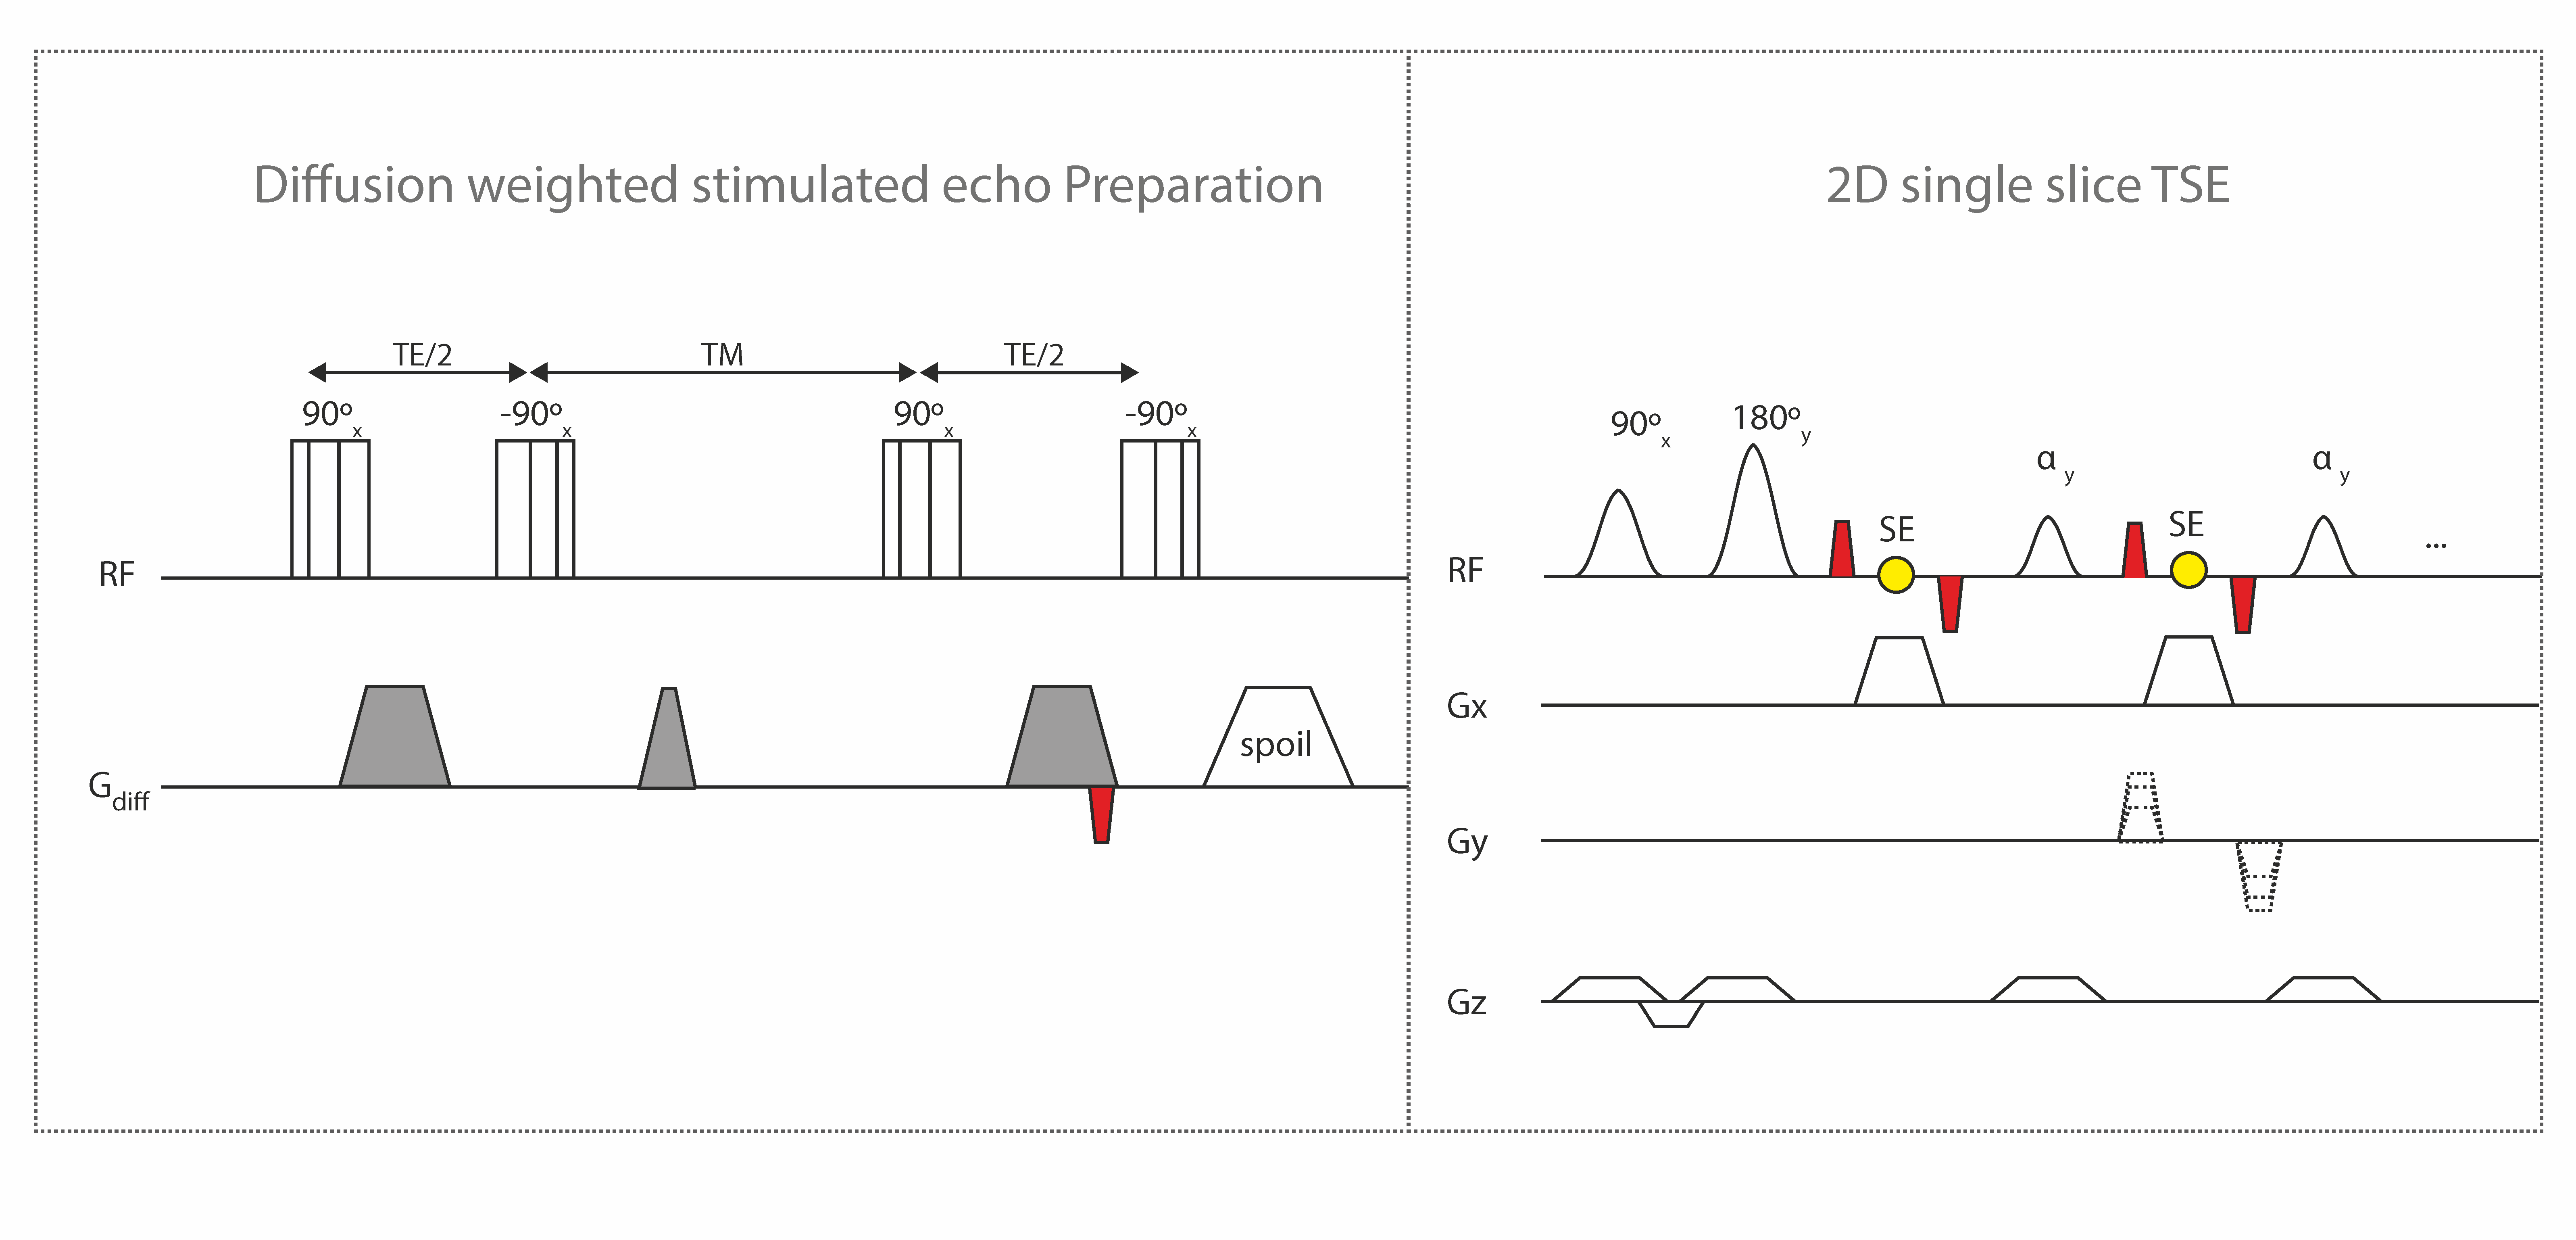
Figure 1:
Sequence diagram of the proposed STE-DW single shot 2D TSE. The diffusion weighted STE-DW magnetization preparation consists of four composite 90° RF pulses, mono-polar diffusion sensitizing gradients and a spoiler gradient during the mixing time. To eliminate motion-induced phase errors an additional pair of de-/rephasing gradients (indicated in red) denoted as magnitude stabilizers are introduced before the last tip-up pulse. Magnitude stabilizers are performed immediately before and after every spin echo formation. A slice-selective 2D single shot TSE with constant flip angle of 50° served as readout.
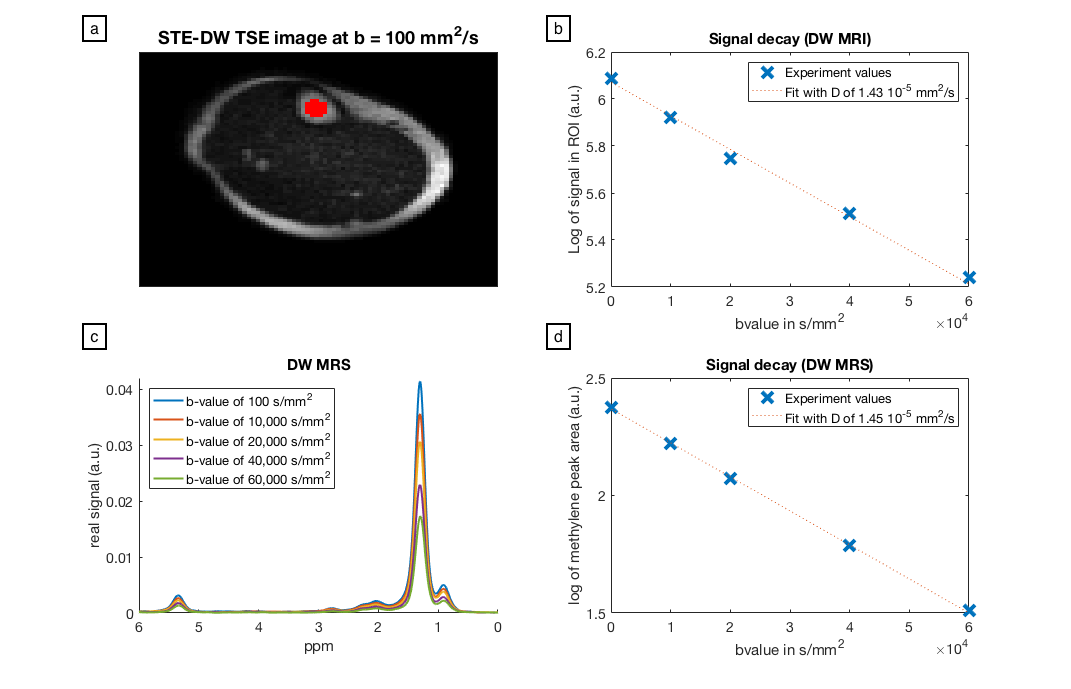
Figure 2:
Comparison of STE-DW TSE and DW-STEAM in the tibia bone marrow of a healthy volunteer. (a) b = 100 mm2/s STE-DWTSE image with the corresponding ROI; (c) DW spectra acquired in the same location; (b) and (d) signal decay obtained by STE-DW TSE and DW-STEAM, respectively. Corresponding fit details are specified in each plot.
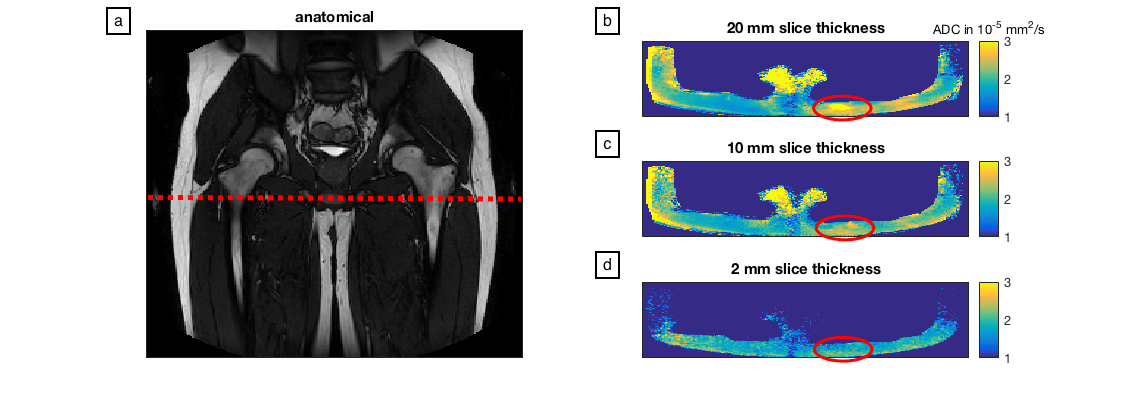
Figure 3:
ADC maps for different slice thicknesses in the subcutaneous fat of the hip region. (a) Anatomical image in one healthy volunteer with the location of the acquired 2D slice; (b), (c) and (d) ADC maps obtained by the STE-DW TSE sequence with a slice thickness of 20 mm, 10 mm and 2 mm, respectively. Absolute ADC values measured in the region indicated by the red ellipse are observed to decrease as well as to appear more homogeneous with decreasing slice thickness.
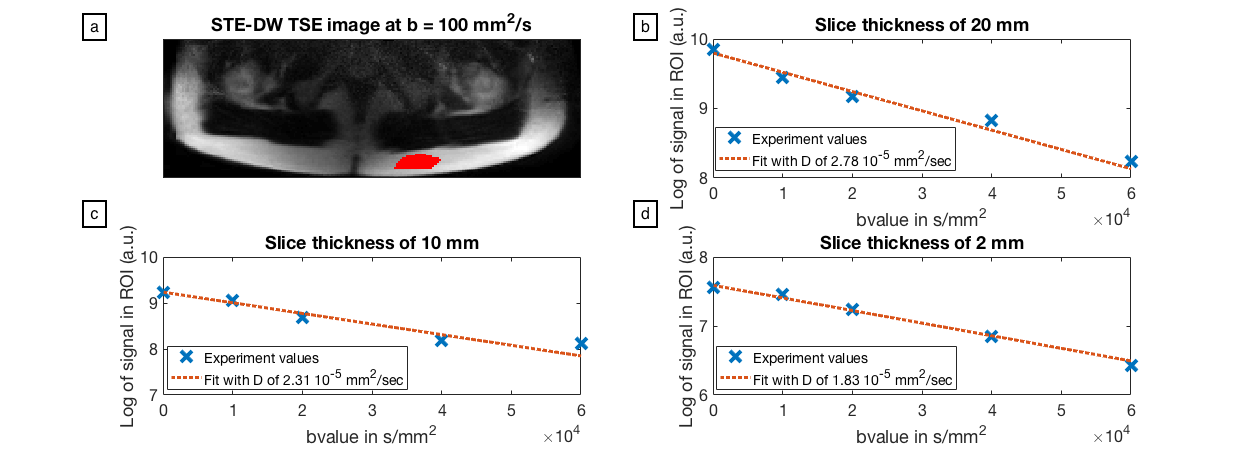
Figure 4:
Signal decay curves for different slice thicknesses in a defined ROI within a subcutaneous fat depot. (a) ROI location in the STE-DW TSE image (b = 100 mm2/s); (b), (c) and (d) signal decay curves and the corresponding calculated apparent diffusion coefficients for a slice thickness of 20 mm, 10 mm and 2 mm, respectively. The measured apparent diffusion coefficient is observed to decrease with decreasing slice thickness.
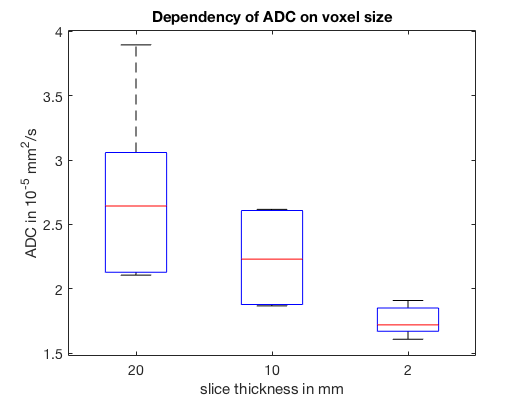
Figure 5:
Mean ADC acquired with DW-STE TSE and measured in ROIs localized within the subcutaneous gluteal fat depot (location indicated in Figure 3 and 4) in five healthy volunteers. ADC measurements carried out with varying slice thicknesses of 20 mm, 10 mm and 2 mm, respectively, indicate a reduced dispersion and mean of the extracted ADC with decreasing voxel size. ADC values acquired with 2 mm slice thickness are significantly reduced compared to a slice thickness of 10 mm (p=0.026) and 20 mm (p=0.022).