2510
Novel model of alcoholic hepatitis and alcoholic steatohepatitis using C57BL/6N mice and magnetic resonance imaging/spectroscopy1Asan Medical Center, Seoul, Republic of Korea, 2Gangneung Asan Hospital, Gangneung, Republic of Korea, 3Hongcheon Institute of Medical Herb, Hongcheon, Republic of Korea
Synopsis
Alcoholic liver disease is classified into two subgroups: alcoholic hepatitis (AH) and alcoholic steatohepatitis (ASH). These differ in most characteristics, including clinicopathologic features and treatment. However, animal models of AH and ASH are not well established. Noninvasive monitoring is essential for evaluating chronic diseases such as AH and ASH. Magnetic resonance imaging and spectroscopy (MRI/S) have recently gained considerable attention as noninvasive monitoring tools for chronic liver disease. The aim of this study, therefore, was to develop a comprehensive animal model of AH and ASH that can be monitored noninvasively using MRI/S.
Introduction
Chronic alcohol consumption is the main cause of liver injury and hepatic steatosis which leads to an alcoholic liver disease (ALD)1-3. The major metabolism leading the liver injury to alcoholic fatty liver is known as cellular injury, inflammation and generation of oxygen radicals. Alcoholic liver disease (ALD) is classified into two subgroups; alcoholic hepatitis (AH) and alcoholic steatohepatitis (ASH)4. They differ in most characteristics including clinicopathologic features, treatment and prognosis. Since the mechanism of cellular injury and clinicalpathologic features differ between AH and ASH, the treatment should be also different according to their condition, i.e. personalized treatment. The aim of this study, therefore, was to develop a comprehensive animal model of AH and ASH that can be monitored noninvasively using MRI/S.Methods
Animal model: Male C57BL/6N mice were divided into three dietary groups (n = 8 per group): the control group, fed a modified Lieber–DeCarli control liquid diet; the “ethanol+maltose group,” fed a modified Lieber–DeCarli ethanol liquid diet with the addition of maltose dextrin; and the “ethanol only group,” fed the modified Lieber–DeCarli ethanol diet without the addition of maltose dextrin. After an adjustment period, the control group mice were fed a diet with an intake limit (Fig. 1).
Monitoring: The mice were monitored daily for up to 21 days, recording their body weight, food intake, and survival.
Measurement of hepatic lipid accumulation: Magnetic resonance imaging/spectroscopy (MRI/MRS) studies were conducted using a horizontal 9.4-T magnet (Agilent, Inc.) at 5, 12, and 19 days, with all the procedures for MR scanning completed within half an hour. For the MRI, we calculated fat fraction factors using two proton density images (fat-saturated and unsaturated). For the MRS, a point-resolved spectroscopy (PRESS) sequence was used to localize the volumes of interest (VOIs) with the following parameters: TR/TE = 3000/19 ms, average = 8, complex data points = 2048, and spectral width = 4000 Hz. The VOI (size 3.0 × 3.0 × 3.0 mm) was localized on the liver, avoiding the portal vein. The fat signal fraction (η) was calculated for the region of interest. The water/fat ratio was also evaluated1.
Histologic evaluation: All animals were euthanized at day 21. The extracted livers were perfused with PBS, weighed, and separated into three roughly equal parts. Two parts were fixed in 10% paraformaldehyde solution and embedded in paraffin for H&E staining, and one part was fixed in 4% paraformaldehyde solution and cryopreserved in 30% sucrose for staining with Oil Red O (Sigma) and CYP2E1 (Abcam) (2). The stained images were analyzed using a microscope (Zeiss, Germany).
Statistical analysis: Comparisons of the serial fat signal fractions by MRI and fat fraction factors by MRS were evaluated by repeated measures analysis of variance (ANOVA). Comparisons of body weight, liver weight, CYP2E1-staining level and the Oil Red O stained area were evaluated by one-way ANOVA with the least significant difference post hoc test. The data were analyzed using commercially available software (SPSS, version 21.0 for Windows, IBM Corp., Armonk, NY).
Results
There were no deaths in any group (Fig. 1A, 1B). To evaluate the degree of hepatic steatosis, we analyzed the liver’s lipid/water ratio by evaluating the fat fraction factor by MRS and the fat signal fraction by MRI. The fat fraction factors of the control and ethanol only groups remained constant, whereas that of the ethanol+maltose group showed a tendency to increase over time. Similar trends were observed in the analysis of the fat signal fraction by MRI. The MRS and MRI analyses confirmed a moderate degree of hepatic steatosis in the ethanol group (Fig. 3). Similar results were observed in the H&E and Oil Red O analysis. There were significantly more lipid droplets in the ethanol+maltose group than in the other groups, and ethanol metabolism detected by CYP2E1 was more enhanced in the ethanol+maltose group (Fig. 4).Discussion
In this study, ASH was represented by the ethanol+maltose group’s diet and AH by the ethanol only diet. The lipid/water ratio was successfully evaluated by MRI/S. There was a significant increase of lipids in the ethanol+maltose group but not in the ethanol only group. The MRI/S results correlated with the H&E and Oil Red O results. These findings suggest that MRI/S can be an effective tool for the evaluation of animal models of ASH and AH.Conclusion
We assume the metabolism of the liver injury might differ between AH and ASH. From this perspective, we have established an animal model which can evaluate the liver injury and fat accumulation caused by alcohol which represents AH and ASH.Acknowledgements
This study was supported by C-BiND of Asan Medical Center and Hongcheon Institute of Medical Herb.References
1. Beier, J.I., et al., Fibrin accumulation plays a critical role in the sensitization to lipopolysaccharide-induced liver injury caused by ethanol in mice. Hepatology, 2009. 49(5): p. 1545-53.
2. Gao, B., Hepatoprotective and anti-inflammatory cytokines in alcoholic liver disease. J Gastroenterol Hepatol, 2012. 27 Suppl 2: p. 89-93.
3. Louvet, A. and P. Mathurin, Alcoholic liver disease: mechanisms of injury and targeted treatment. Nat Rev Gastroenterol Hepatol, 2015. 12(4): p. 231-42.
4. Lanthier, N. and P. Starkel, Treatment of severe alcoholic hepatitis: past, present and future. Eur J Clin Invest, 2017. 47(7): p. 531-539.
Figures
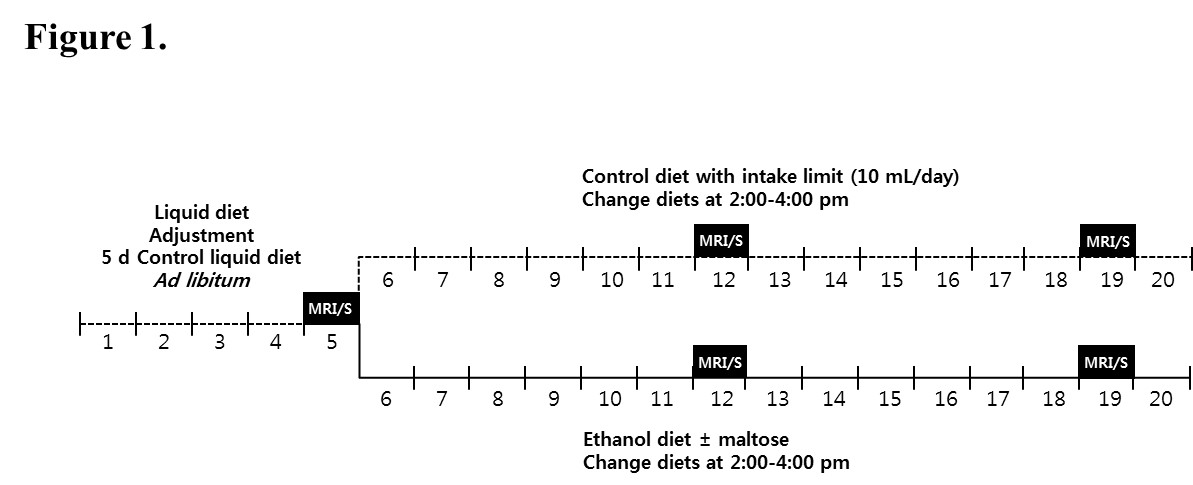
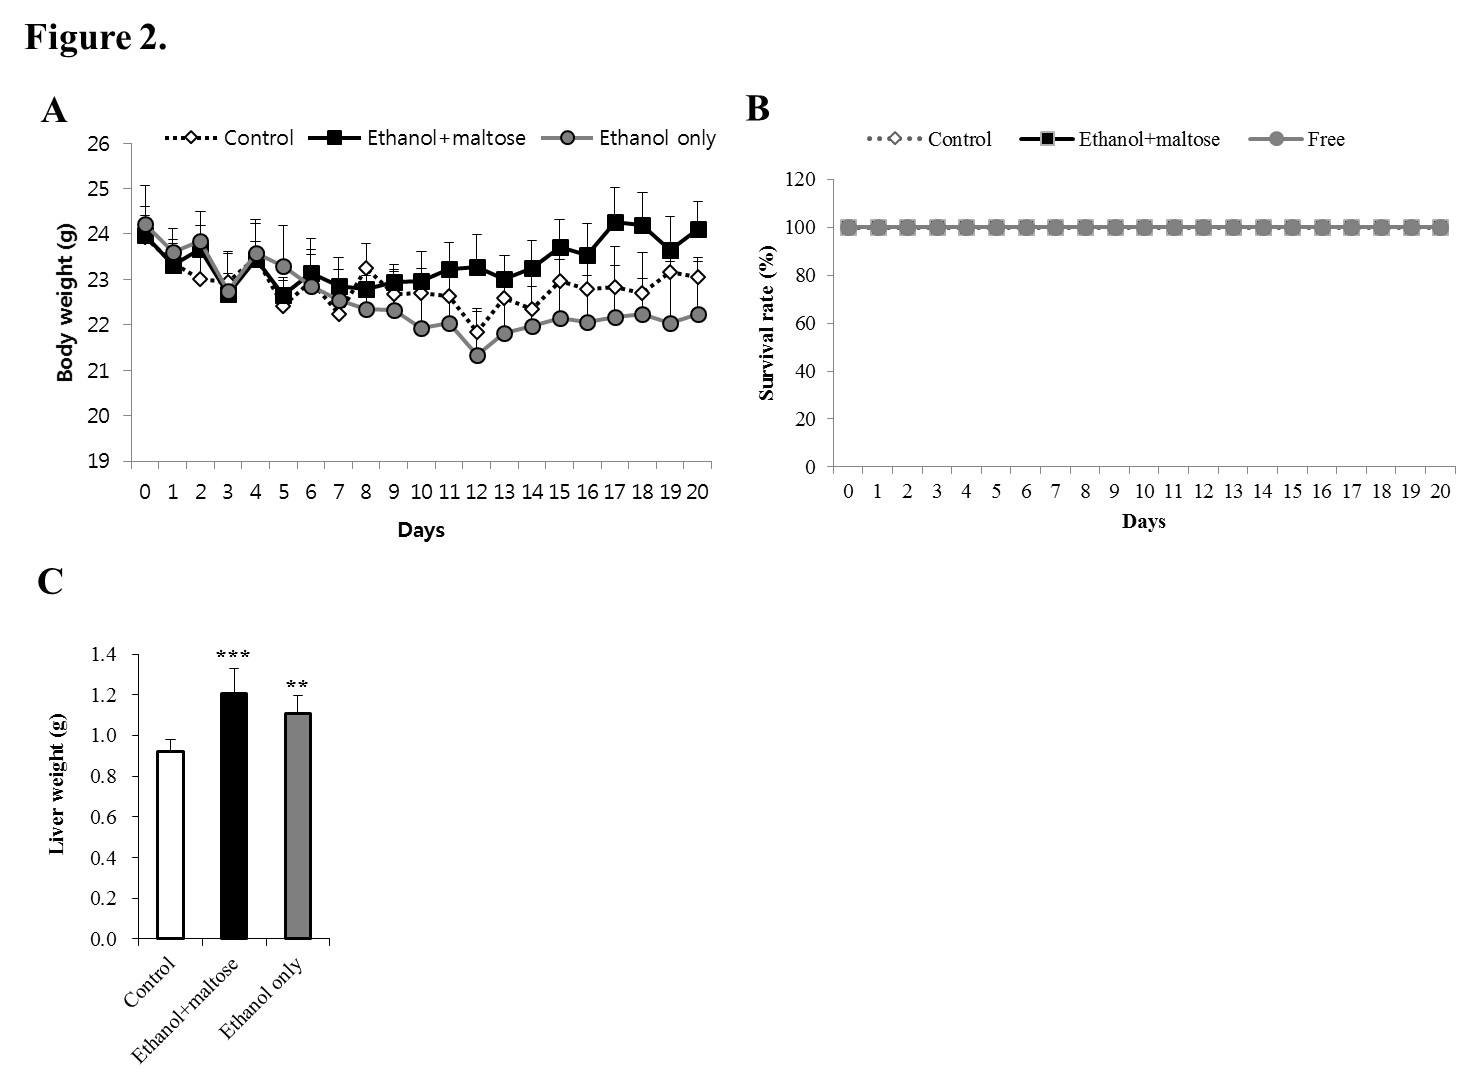
Figure 2. Monitoring during the experiment period and liver weight after the experiment.
(A) Survival rates of the three groups.
(B) Body weight for the three groups (ethanol+maltose group, *p < 0.05).
(C) Liver weight (***p < 0.001).
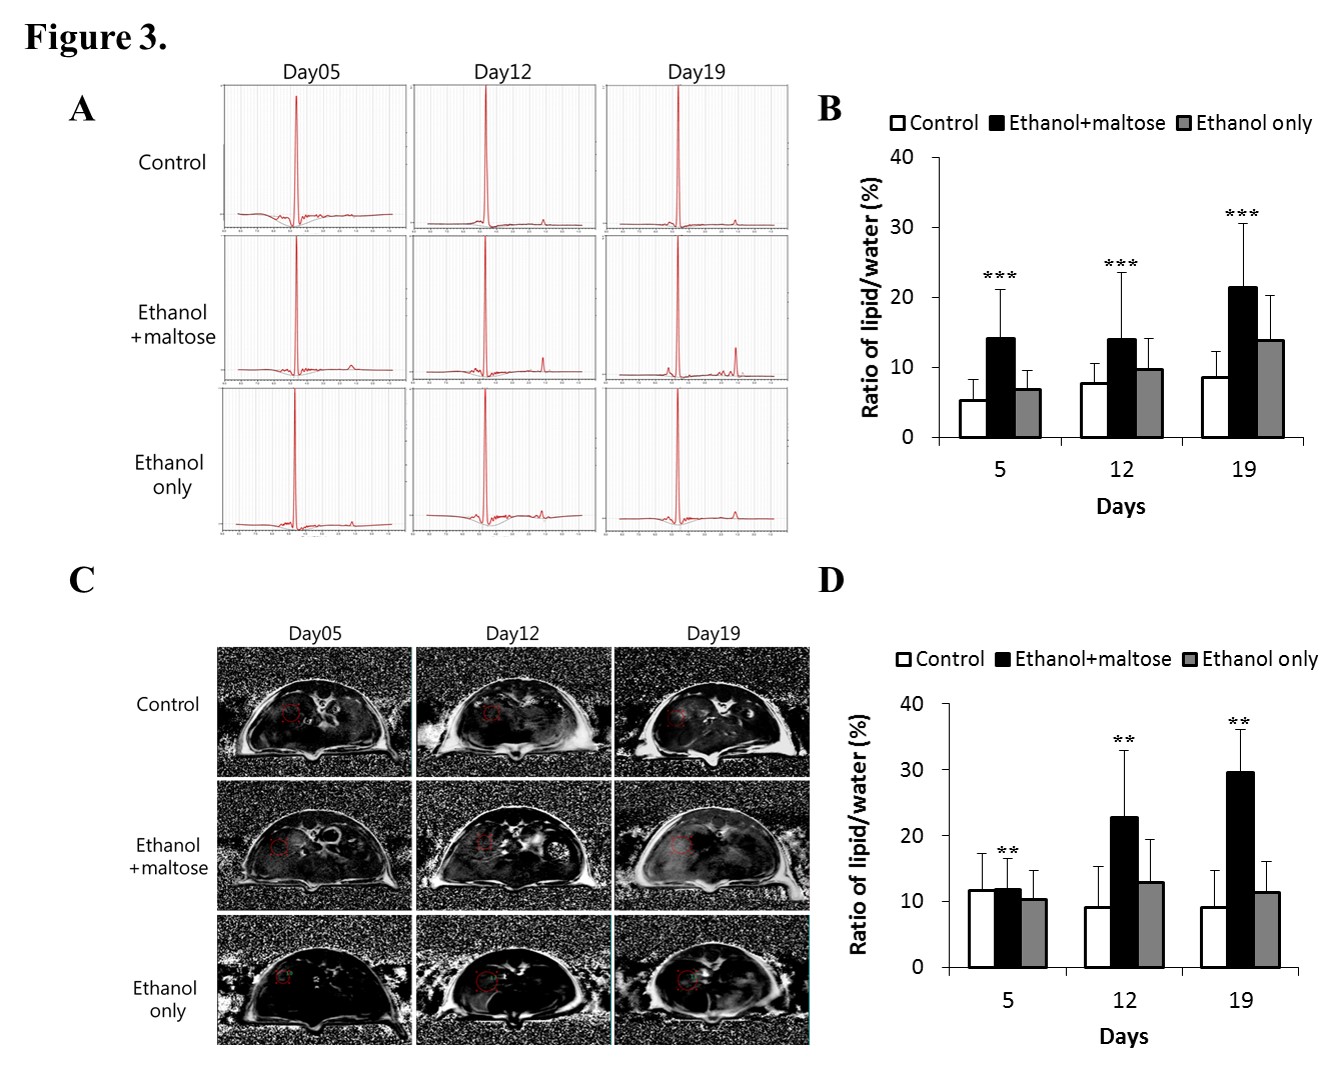
Figure 3. Measurements of fat signal fractions and fat fraction factors by MRI/S.
(A) Representative MRI image.
(B) Analysis of the fat signal fractions of each group over the experiment period (***p < 0.001).
(C) Representative MRS images.
(D) Analysis of fat fraction factors of each group over the experiment period (**p < 0.01).
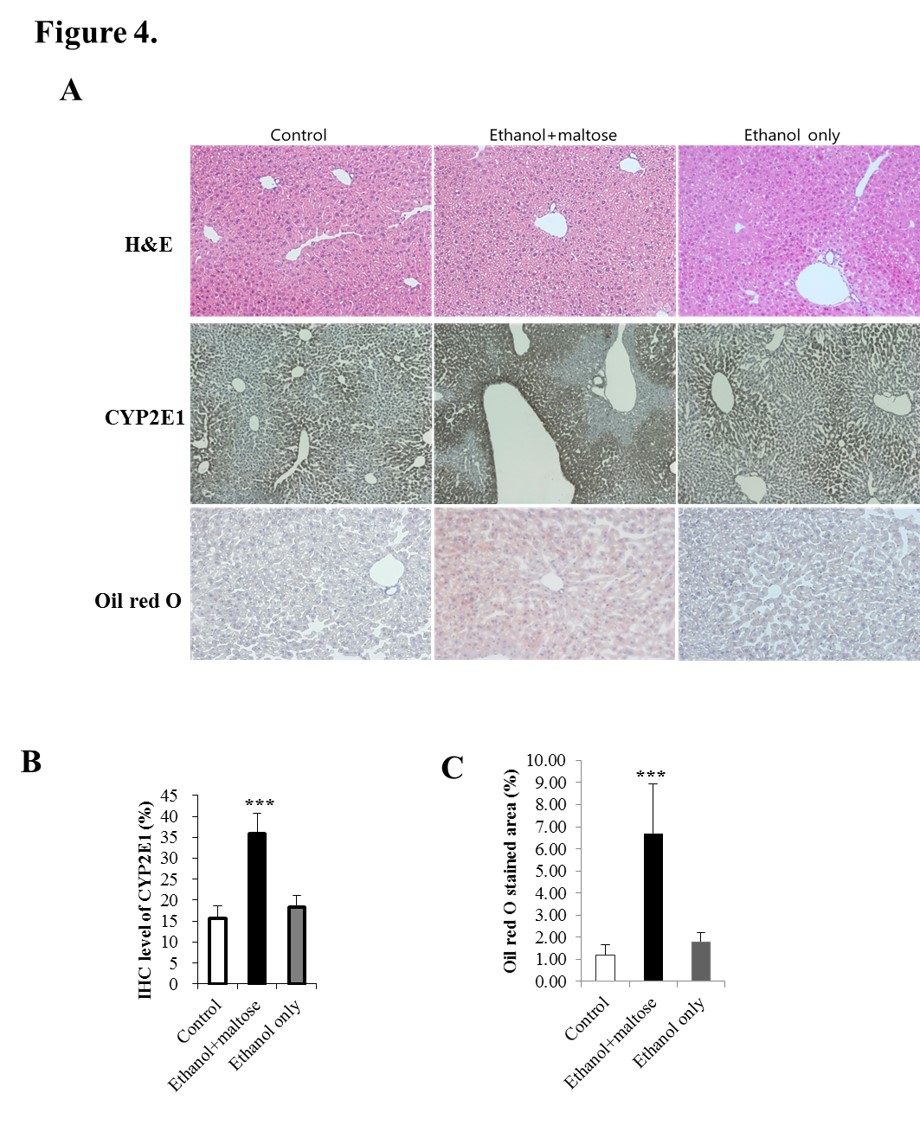
Figure 4. Histologic analysis.
(A) Representative images of liver samples attained with H&E, CYP2E1, and Oil Red O.
(B) Quantitative analysis of the CYP2E1 level (*p < 0.05, ***p < 0.001).
(C) Quantitative analysis of the Oil Red O stained area.