2509
Using water-fat MRI to detect remodeling of adipose tissue1Biology, Western University, London, ON, Canada, 2Medical Biophysics, Western University, London, ON, Canada
Synopsis
Hibernating mammals use brown adipose tissue (BAT) as a primary source of heat production for arousal from torpor. In hibernators, both white adipose tissue (WAT) and BAT volumes increase in autumn even when temperatures are warm, unlike non-hibernators which require cold exposure for BAT growth. Differentiation of WAT from BAT between depots in close proximity can be achieved using IDEAL water-fat MRI. Hibernating mammals exposed to constant warm environments showed drastic molecular changes to their BAT depots that could ultimately be detected my MRI, proving IDEAL’s versatility and specificity.
Target Audience
This abstract is targeted to those interested in MRI of brown adipose tissue.Introduction
In mammals, brown adipose tissue (BAT) cells have a high mitochondrial density but a low capacity for synthesizing ATP. These specialized BAT mitochondria express uncoupling protein 1 (UCP1) which allows heat production when BAT is stimulated by sympathetic nerves. In contrast, white adipose tissue (WAT) cells contain fewer mitochondria, a single lipid droplet, and serves primarily in energy storage. In non-hibernating mammals, proliferation of BAT requires extensive acclimation to cold environmental temperatures. This is not the case in hibernating mammals, whose BAT depots increase in volume during autumn without temperature cues1. BAT in the chest of animals held at constant warm show a mix of high and low PDFF, unlike animals exposed to environmental temperature changes. It is hypothesized that the non-uniform BAT depot found in the warm exposed animals is due to a heterogeneous mix of WAT and BAT cells.Purpose
To determine if the non-uniform BAT depot seen in the PDFF images is consistent with molecular assays of UCP1 quantity and mitochondrial abundance.Method
Four male 13-lined ground squirrels (Ictidomys tridecemlineatus) were housed at 25°C, with a constant photoperiod of 12h light/12h dark for an entire year. The squirrels were scanned using a 3T MRI scanner (Discovery MR750, GE Healthcare, Waukesha, WI, USA) and a 32-coil cardiac array under a protocol approved by the institution’s Animal Use Subcommittee. Prior to imaging, animals were anaesthetized using isoflurane and 100% oxygen. Quantitative IDEAL data was acquired with TR/∆TE/# echoes/flip angle = 7.96ms/0.856ms/6/4 and voxel dimensions = 0.9mm isotropic. Water-only, fat only and PDFF images were reconstructed with correction for T2* decay and fat spectral complexity.
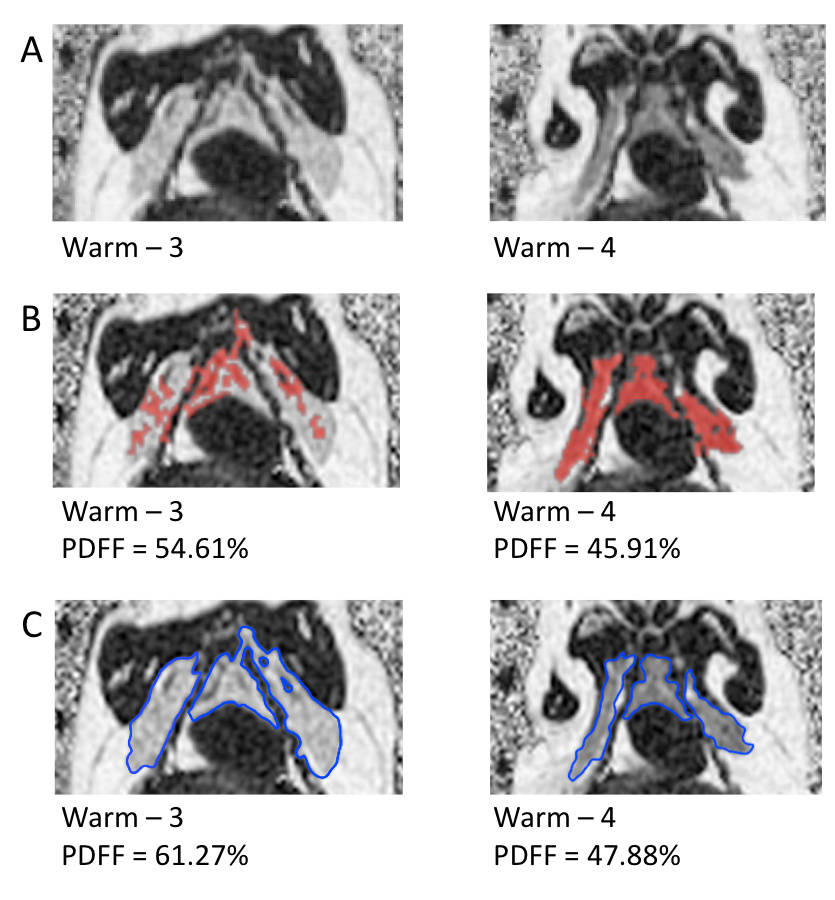
BAT has a lower PDFF than WAT2 allowing for identification of both tissues separately. PDFF images acquired after animals had been held for 1 year at constant 25°C and 12L/12D were used for semi-automatic segmentation of BAT and manual segmentation. Both methods were used because 2 of the 4 animals showed non-uniform PDFFs within the BAT depot that were beyond the set semi-automated segmentation threshold (30-70% PDFF). The semi-automated segmentation used the “2D growing region” tool of Osirix (Pixmeo, Geneva, Switzerland).
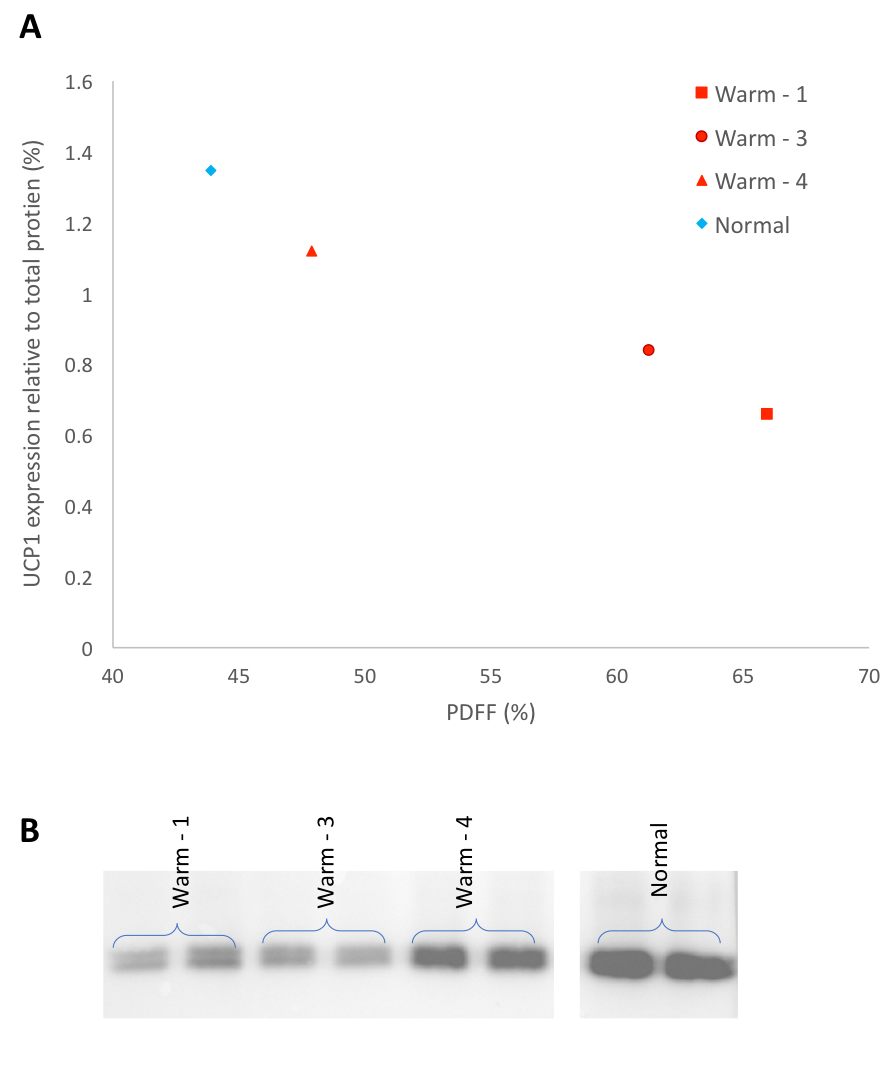
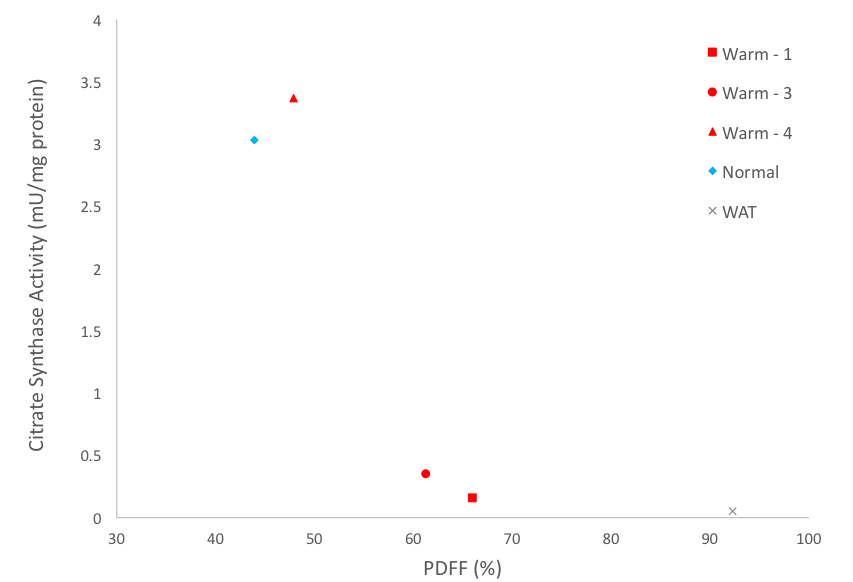
Animals were sacrificed after the 1 year scan, and thorax BAT was dissected and stored at -80°C. Western blot analysis was performed to determine the protein quantity of UCP1 (primary-antibody (abcam ab10983) with rabbit anti-goat secondary) and standardized to total protein. Citrate synthase activity, a validated biomarker for mitochondrial abundance3,4, was measured on the same samples. Correlations were done to compare citrate synthase activity and UCP1 amount to PDFF from warm held animals. An animal allowed to hibernate normally, from a previous experiment was used as a control (temperature decreased to 5°C during winter months).
Results
Figure 1 shows representative PDFF of warm held animals analyzed using semi-automated segmentation (B) and analyzed using manual segmentation (C). The BAT PDFF in 2 of the 4 animals (W2 and W4) was uniform and typical of values seen in animals that hibernated in the cold during the winter. On the other hand, the remaining 2 animals had areas within expected BAT having PDFF values typical of WAT and therefore not detected by the semi-automated segmentation. Figure 2 shows a strong positive correlation between UCP1 content and PDFF of the BAT depots. The drop in UCP1 as PDFF increases also corresponds with a decrease in citrate synthase activity, so that the BAT from these animals does not differ significantly from WAT (Figure 3).Discussion
The non-uniformity that is seen in PDFF images of animals housed in warm conditions is reflected at a molecular level. The significant change in PDFF between semi-automated and manual segmentation showed that there is an increase in PDFF of the BAT depot beyond expected parameters. The increase in PDFF indicates remodeling of the BAT depot consistent with an increase of WAT cells. The decrease in UCP1 and citrate synthase activity also indicate that there is less BAT in those animals. Our results, verified with molecular techniques, show that warm exposure changes BAT and that water-fat MRI is sensitive enough to detect these changes. It is not known why this phenomenon is seen in 2 of the 4 animals housed in the same constant warm conditions. Further experiments will be done to determine if the increased PDFF is due to WAT and/or beiging of WAT by gene analysis.Conclusion
This water-fat MRI study shows, for the first time, that changes in PDFF of adipose tissue correlate with molecular changes in adipose tissue in warm acclimated hibernating mammals.Acknowledgements
The authors acknowledge support from NSERC.References
1. MacCannell, A., Sinclair, K., Friesen-Waldner, L., McKenzie, C. A. & Staples, J. F. Water–fat MRI in a hibernator reveals seasonal growth of white and brown adipose tissue without cold exposure. J. Comp. Physiol. B 187, 759–767 (2017).
2. Hu, H. H., Smith, D. L., Nayak, K. S., Goran, M. I. & Nagy, T. R. Identification of Brown Adipose Tissue in Mice with Fat-Water IDEAL-MRI. J. Magn. Reson. Imaging JMRI 31, 1195–1202 (2010).
3. Boushel, R. et al. Patients with type 2 diabetes have normal mitochondrial function in skeletal muscle. Diabetologia 50, 790–796 (2007).
4. Mogensen, M., Bagger, M., Pedersen, P. K., Fernström, M. & Sahlin, K. Cycling efficiency in humans is related to low UCP3 content and to type I fibres but not to mitochondrial efficiency. J. Physiol. 571, 669–681 (2006).
Figures