2508
2-phase Dixon technique to assay dermal white adipose tissue loss as potential early diagnostic biomarker of scleroderma using genetic Fra-2 mice1Radiology, Feinberg School of Medicine, Northwestern University, Chicago, IL, United States, 2Division of Rheumatology, Feinberg School of Medicine, Northwestern University, Chicago, IL, United States, 3Pathology, Neurology, Neurosurgery and Regenerative Medicine, Cedars Sinai Medical Center, Los Angeles, CA, United States
Synopsis
Scleroderma is an autoimmune disease leading to fibrosis resulting in stiff skin, formation of ulcers, joint contractures and ultimately functional incapacity. Loss of dermal white adipose tissue (dWAT) was observed ex-vivo prior to the development of fibrosis. In this study we demostrated the feasibility of employing CSE MRI Dixon technique to detect and quantify in-vivo dWAT thickness using a genetic Fra-2 fibrosis mice model. The proposed non-invasive diagnostic method to evaluate or predict skin fibrosis would greatly improve clinicians’ ability to track progression and response to treatment and also provide a tool to investigate pathogenesis in animal models.
Introduction
Scleroderma is an autoimmune disease leading to fibrosis resulting in stiff skin, formation of ulcers, joint contractures and ultimately functional incapacity[1]. An ex-vivo study by Marangoni et al. (2015) reported loss of dermal white adipose tissue (dWAT) prior to the development of fibrosis[2], suggesting this feature as a potential early stage biomarker. Current accepted clinical diagnostic standards rely on subjective manual assessment of skin condition. Development of a non-invasive diagnostic method to evaluate or predict skin fibrosis would greatly improve clinicians’ ability to track progression and response to treatment and also provide a tool to investigate pathogenesis in animal models. Chemical shift encoded (CSE) Dixon imaging techniques was successfully employed to detect non-invasively adipose tissue and measure thickness of skin WAT[3]. In this study we explore feasibility of employing CSE methods to detect and quantify in-vivo dWAT thickness using a genetic Fra-2 fibrosis mice model[4].Methods
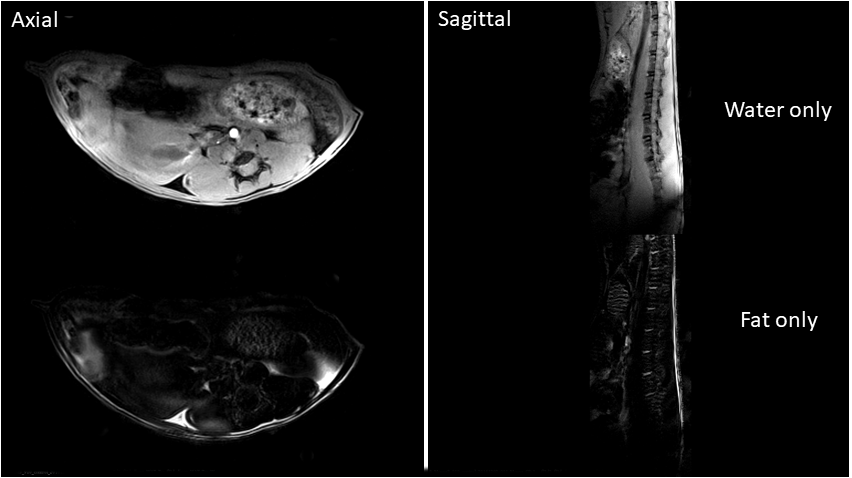
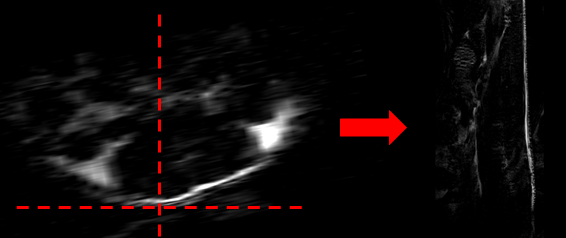
All experimental procedures involving animals complied with Northwestern’s IACUC guidelines. Two transgenic Fra-2+ mice and one Fra- (WT) control mouse were imaged two times (at 14 and 16 weeks of age). MRI was done on Bruker 7T ClinScan MRI scanner using a four-channel receive coil and volume body-coil for transmission. The MRI protocol included a sagittal two-point CSE 3D FLASH sequence (TA=1 m 45 s, TR=12 ms, TE1/TE2= 2/3.5 ms, flip angle=15, matrix=156x384, voxel size = 0.1x0.1 mm2, slice thickness=0.8 mm, slice number 40, number of averages=1) and a transversal one (TA=1 m 34 s, TR=12 ms, TE1/TE2= 2/3.5 ms, flip angle=15, matrix=384x192, voxel size = 0.1x0.1 mm2, slice thickness=0.8 mm, slice number = 30, number of averages=1). Parameters were optimized to obtain in-phase(ip)/opposition-of-phase(op) water/fat images. The water-only and fat-only images were computed automatically by the MRI scanner console (fig.1). Particular care was taken when placing the mouse on the MRI scanner animal cradle to enable acquisition of comparable images from session to session. Careful positioning of the mice body and detection coil allowed selection of a field of view FOV (i.e. MR slices position and orientation) parallel to the mouse’s spinal cord, facilitating post-acquisition image processing. Each sagittal fat-only image was processed using 3DSlicer (vs 4.6.2) using the following pipeline: 1) the slice closest to the perfect line perpendicular to the mouse back skin was selected (fig.2); 2) image contrast was modified to enhance the visibility of fat tissue; 3) fat layer thickness was measured using the ruler tool in 8 sample points across the length of the slice; 4) mean and standard deviation was computed for each image. The sagittal fat-only image acquired at spatial resolution 0.1x0.1x0.8 mm3 did not enable differentiation between dWAT and subcutaneous adipose tissue (sWAT), hence we considered the thickness layer measurement as a sum of the two layers.Results
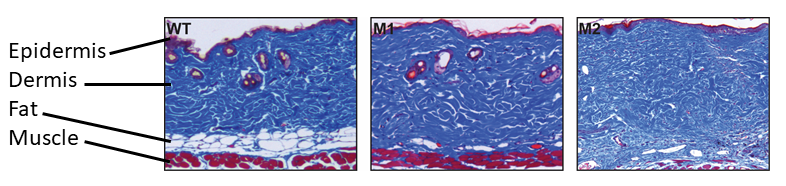
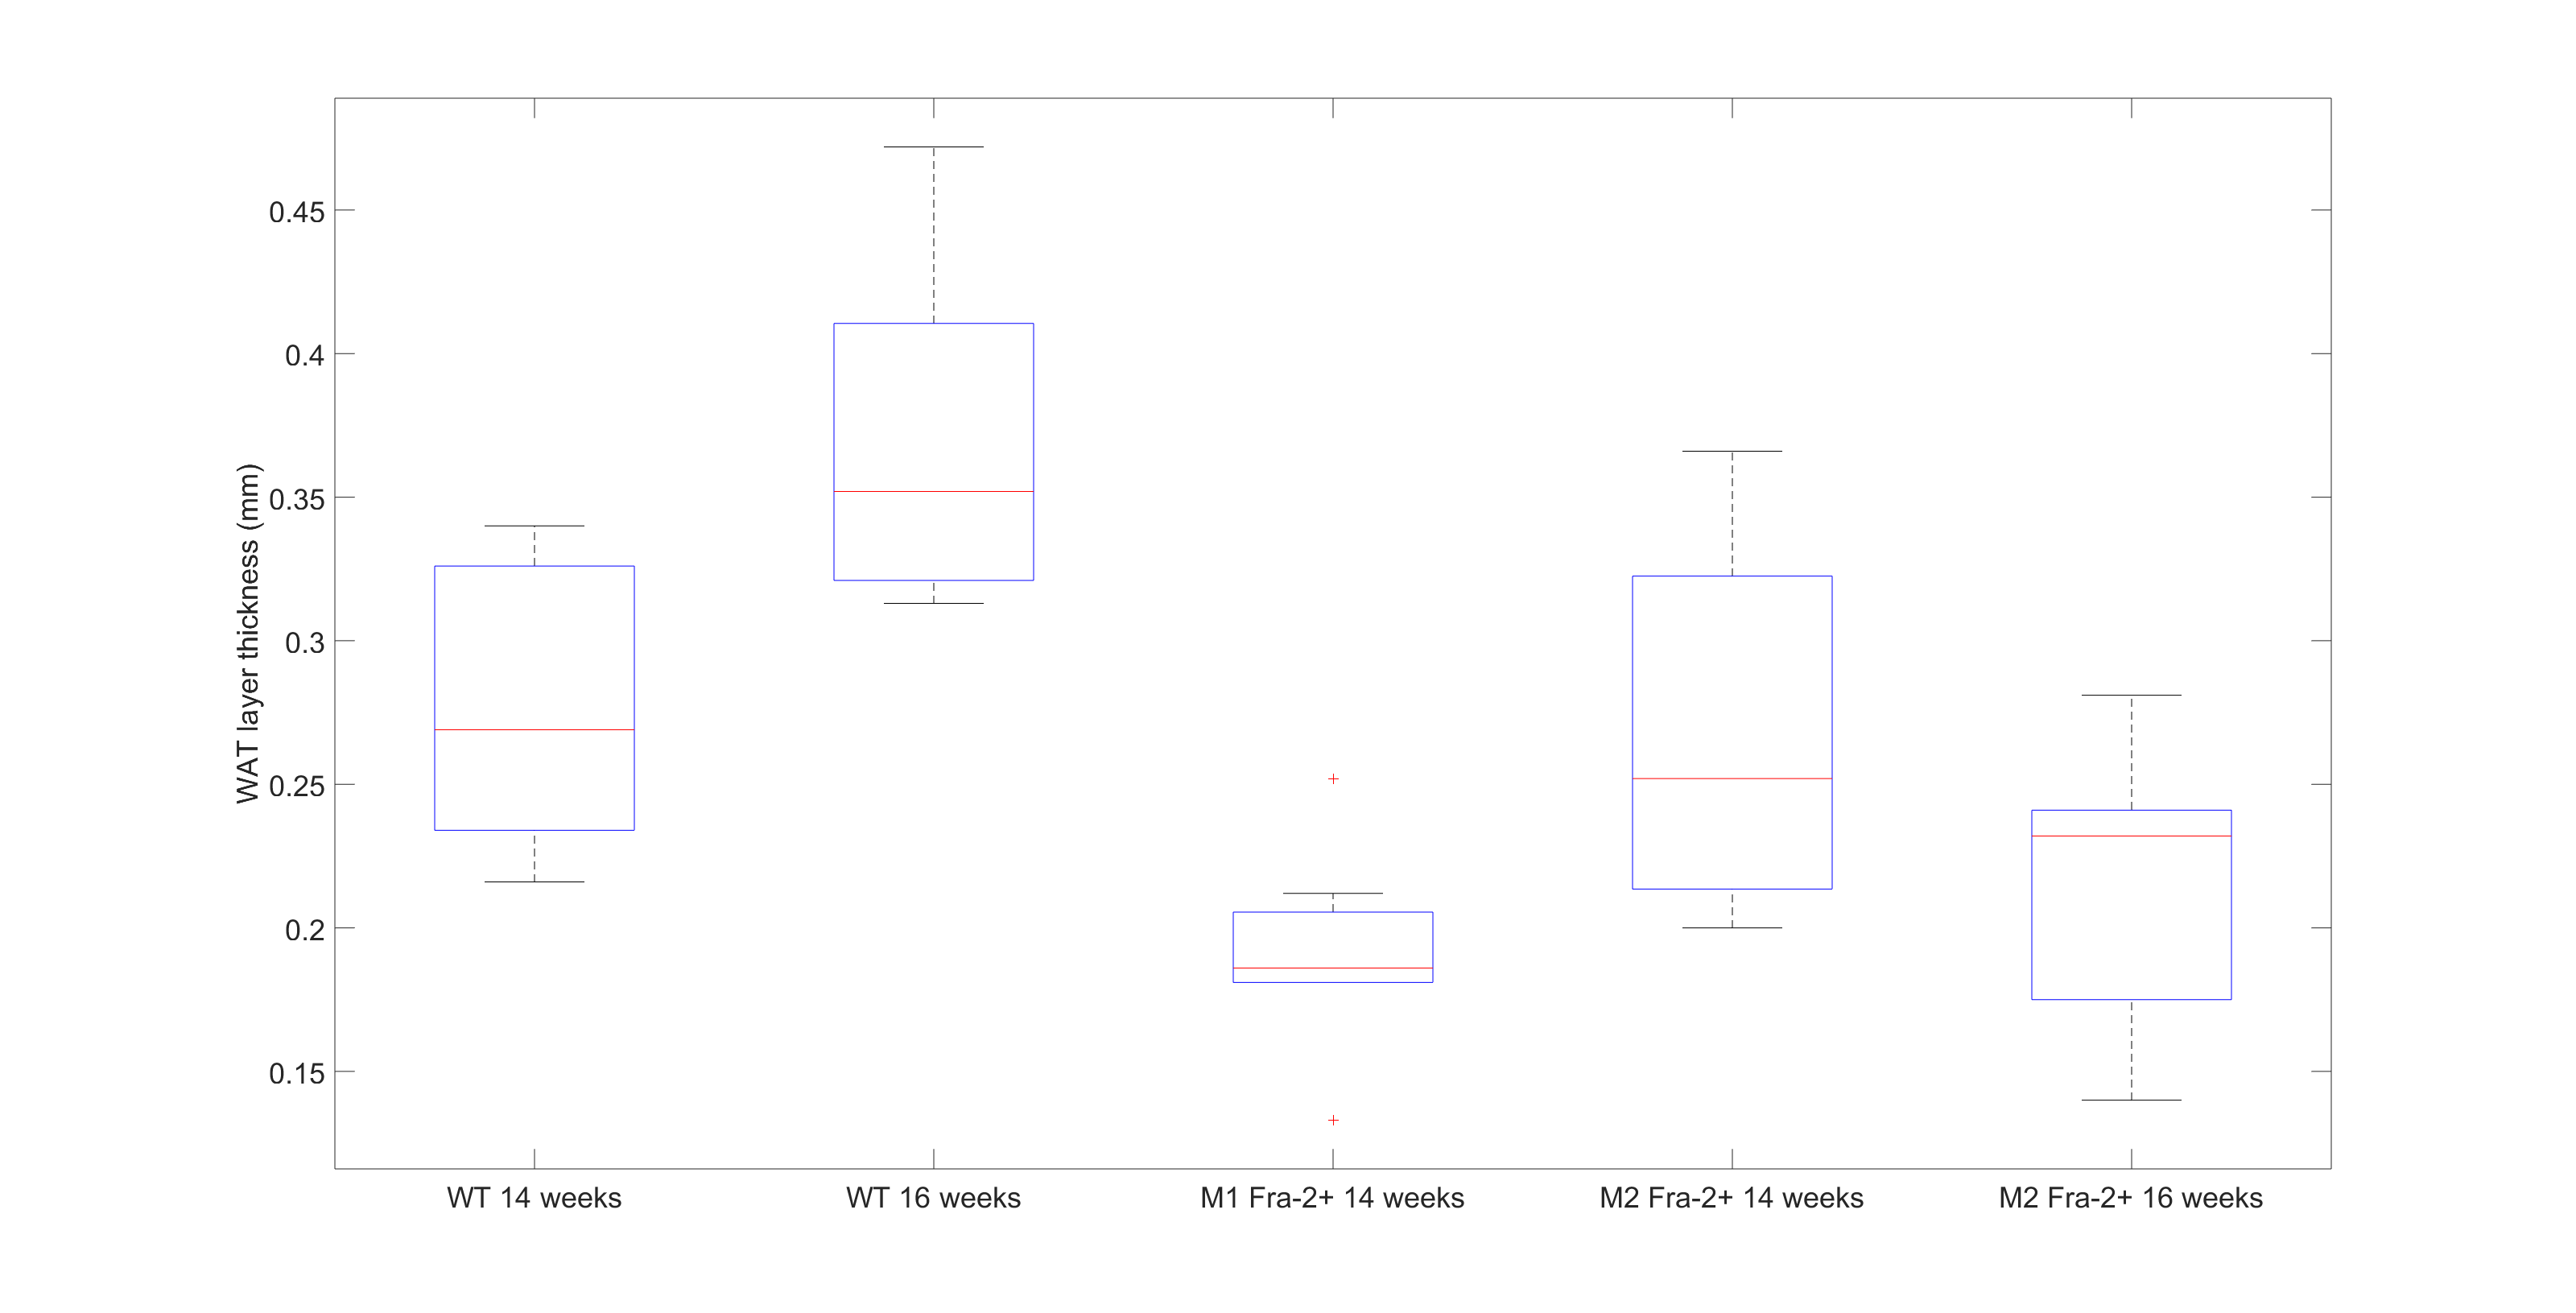
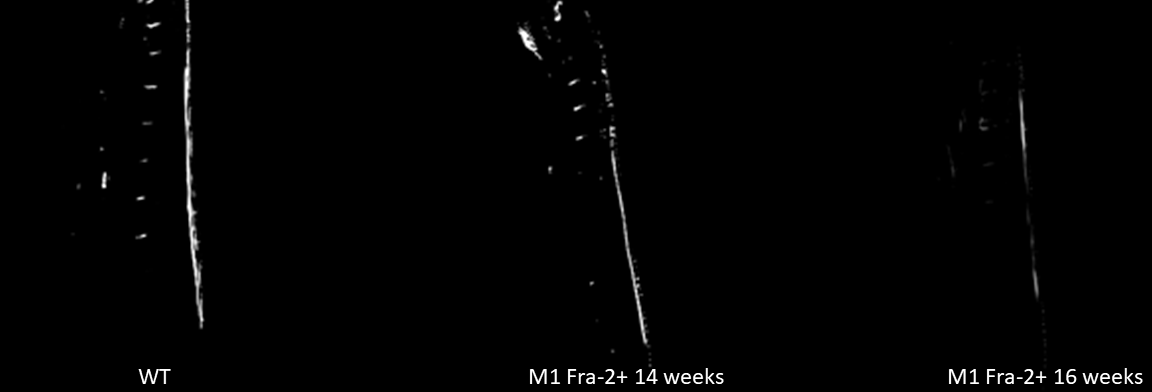
Ex-vivo histological assays confirmed loss of dermal adipose tissue (see Fig. 3). The plot in fig.4 shows a comparison between skin adipose tissue thickness values of Fra-2+ and WT control mice. We observed a thinner adipose layer in the Fra-2+ mice at 14 weeks time point (0.19 +/_ 0.03 mm and 0.26 +/- 0.06 mm) as compared to the WT mouse (0.28 +/- 0.05 mm). At 16 weeks the fat layer increased in the WT (0.37 +/_ 0.06 mm) and decreased in mouse 2 Fra-2+ (0.21 +/_ 0.05 mm). In mouse 1 Fra-2+ fat layer thickness measurement was impossible because of severe loss of adipose tissue (i.e. no detectable layer to measure(fig.5).Discussion and Conclusion
This pilot study indicates that 3D CSE two-point FLASH technique is a powerful tool to detect and follow alterations of dermal adipose layers as scleroderma disease progresses. Coupling these methods with high resolution scans of the different dermal layers can provide investigators with a unique window into progression of the disease without the need to sacrifice the animals. Since these sequences are available commercially on clinical scanners this approach could be successfully translated to a clinical setting offering clinicians a tool for early diagnosis of the disease, evaluate progression and response to treatment. One challenge for quantitative use of these methods lies in the fact that normal dermal layer thickness varies across the body and is altered in relation to how the body is positioned (i.e supine vs prone, on pillow vs table). To avoid bias in the skin adipose thickness assessment MRI acquisitions require reproducible placement of patient in scanner and accurate positioning of MRI FOV for each scan. Work is in progress to “map” regional variability of adipose layer thickness in normal mice to be used as a-priori reference when conducting quantitative studies on disease models.Acknowledgements
Supported by grants from the National Institutes of Health (AR-064925, AR-042309 and AR-049025, R03-AR066343 and K26-OD010945) and the Scleroderma Foundation. Imaging was performed at the Northwestern University Center for Advanced Microscopy and tissue histology was performed at The Mouse Histology and Phenotyping lab (both supported by NCI CCSG P30 CA060553).References
1. Allanore, Yannick, Robert Simms, Oliver Distler, Maria Trojanowska, Janet Pope, Christopher P. Denton, and John Varga. "Systemic sclerosis." Nature Reviews Disease Primers 1 (2015): 15002.
2. Marangoni, Roberta Goncalves, Benjamin D. Korman, Jun Wei, Tammara A. Wood, Lauren V. Graham, Michael L. Whitfield, Philipp E. Scherer, Warren G. Tourtellotte, and John Varga. "Myofibroblasts in Murine Cutaneous Fibrosis Originate From Adiponectin‐Positive Intradermal Progenitors." Arthritis & Rheumatology 67, no. 4 (2015): 1062-1073.
3. Kasza, Ildiko, Diego Hernando, Alejandro Roldán-Alzate, Caroline M. Alexander, and Scott B. Reeder. "Thermogenic profiling using magnetic resonance imaging of dermal and other adipose tissues." JCI insight 1, no. 13 (2016).
4. Eferl, Robert, Peter Hasselblatt, Martina Rath, Helmut Popper, Rainer Zenz, Vukoslav Komnenovic, Maria-Helena Idarraga, Lukas Kenner, and Erwin F. Wagner. "Development of pulmonary fibrosis through a pathway involving the transcription factor Fra-2/AP-1." Proceedings of the National Academy of Sciences 105, no. 30 (2008): 10525-10530.
Figures