2507
The Associations between Water-Fat MRI Measurements of Brown Adipose Tissue and Abdominal Adiposity and Glucose Metabolism in Children and Adolescents1Department of Radiology, Uppsala University, Uppsala, Sweden, 2Department of Information Technology, Uppsala University, Uppsala, Sweden, 3Department of Women’s and Children’s Health, Uppsala University, Uppsala, Sweden, 4Children Obesity Clinic, Uppsala University Hospital, Uppsala, Sweden, 5Department of Medical Cell Biology, Uppsala University, Uppsala, Sweden, 6Department of Paediatrics, Paracelsus Medical University, Salzburg, Austria, 7Obesity Research Unit, Paracelsus Medical University, Salzburg, Austria, 8Department of Radiology, Paracelsus Medical University, Salzburg, Austria, 9Antaros Medical, BioVenture Hub, Mölndal, Sweden
Synopsis
Investigating the role of brown fat (BAT) in child/adolescent metabolism and obesity is important for elucidating its potential as an antiobesity/antidiabetes therapeutic target. This study presents associations between MRI estimates of BAT (by cervical-supraclavicular adipose tissue fat fraction and T2*) and abdominal adiposity and glucose metabolism parameters in children/adolescents. Associations between the BAT estimates and adiposity were observed, supporting previous indications of decreasing BAT amounts with increasing adiposity. Additional associations between the BAT estimates and important glucose metabolism parameters may reflect a role for BAT in glucose and energy metabolism and potentially a link to development of type 2 diabetes.
Introduction
The human brown adipose tissue (BAT) is a potential therapeutic target for obesity and diabetes owing to its capability of burning energy for thermogenesis.1 Cervical-supraclavicular adipose tissue fat fraction (FF) and T2*, quantified from water-fat MRI, can be used as MRI estimates of BAT. A lower FF and T2* indicate a higher content of BAT, arising from differences in water, triglyceride and iron content between BAT and white adipose tissue.2,3 Supraclavicular FF and T2* are observed to be positively associated to adiposity in children,2,4 supporting PET/CT findings of lower BAT activity with higher BMI in children and adults.5,6 Human BAT is a highly insulin-sensitive tissue7 and the supraclavicular FF, estimated from MRS, is observed to be negatively correlated to insulin sensitivity in type 2 diabetic (T2D) and prediabetic adults8. Studies of glucose and energy metabolism in children are warranted for elucidating the potential role of BAT in development of obesity and related T2D during young years. This study aimed at investigating the associations between MRI estimates of human BAT and abdominal adiposity and glucose metabolism in normal and overweight/obese children and adolescents.Methods
Subjects (n=143, males/females: 71/72, age: 14.3±2.2 years, weight: 87.9±23.9 kg, height: 166.5±10.4 cm; mean±standard deviation) within the European cohort study Beta-cell function in juvenile diabetes and obesity (Beta-JUDO, 2012-2016) were recruited at two research sites (Uppsala and Salzburg). At both sites, overweight/obese subjects (n=126) were recruited at obesity specialist clinics. Normal weight subjects (n=17) were recruited from schools in Uppsala.
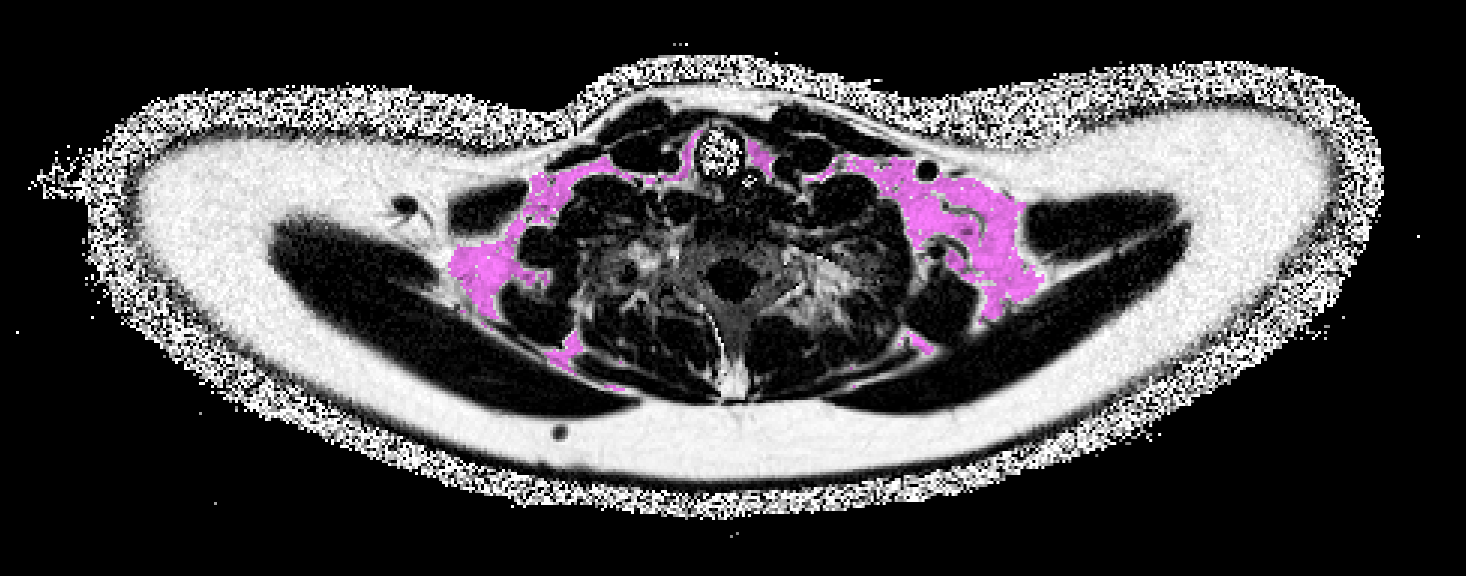
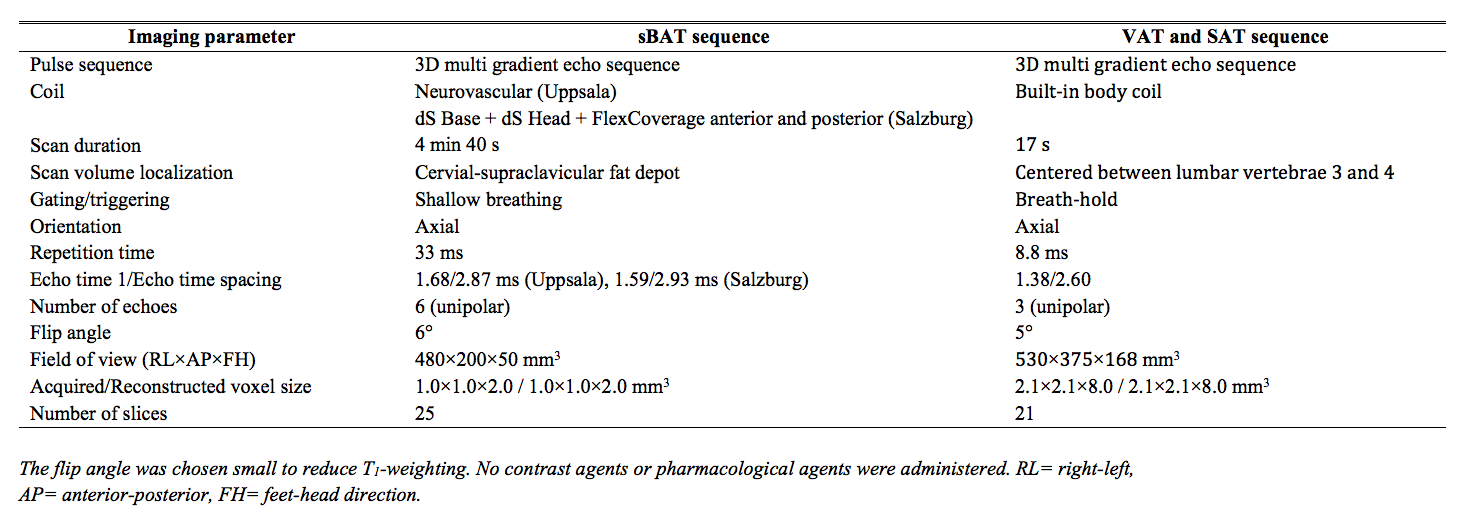
Imaging was performed on clinical whole-body 1.5T MR systems (Uppsala: Philips Achieva, Salzburg: Philips Ingenia, Philips Healthcare, The Netherlands). The MRI estimates of BAT were represented by cervical-supraclavicular adipose tissue (here denoted suspected BAT, sBAT) FF and T2*, obtained from water-fat MRI (imaging parameters in Table 1). Adiposity was estimated by volumes of abdominal visceral and subcutaneous adipose tissue (VATvol and SATvol, respectively) obtained from water-fat MRI (imaging parameters in Table 1). Previously described methods were used for water-fat reconstruction of the sBAT9 and abdominal10 image data. sBAT was automatically segmented using a modified version of a previously presented method (example in Figure 1).11 Segmentations of VATvol and SATvol were accomplished according to the following steps: Background voxels were removed using a manually set threshold. Foreground voxels with FF≥50% were considered as adipose tissue. SATvol was automatically separated by in-house software, using a previously described filtering technique.12 From the residual adipose tissue, fat surrounding the vertebrae was automatically removed and the remaining part was considered as VATvol.
For evaluating the glucose metabolism, the subjects underwent an oral glucose tolerance test (OGTT). Using the blood glucose and insulin levels obtained during OGTT, the following glucose metabolism parameters were calculated: 2h blood glucose, Matsuda Index13, homeostatic model assessment of insulin resistance (HOMA-IR)14 and oral disposition index (DIO)15. Associations of sBAT FF and T2* with adiposity and glucose metabolism were analyzed using simple and multiple linear regression with adjustment for multiple factors: sex, age, site and regarding glucose metabolism also for adiposity.
Results
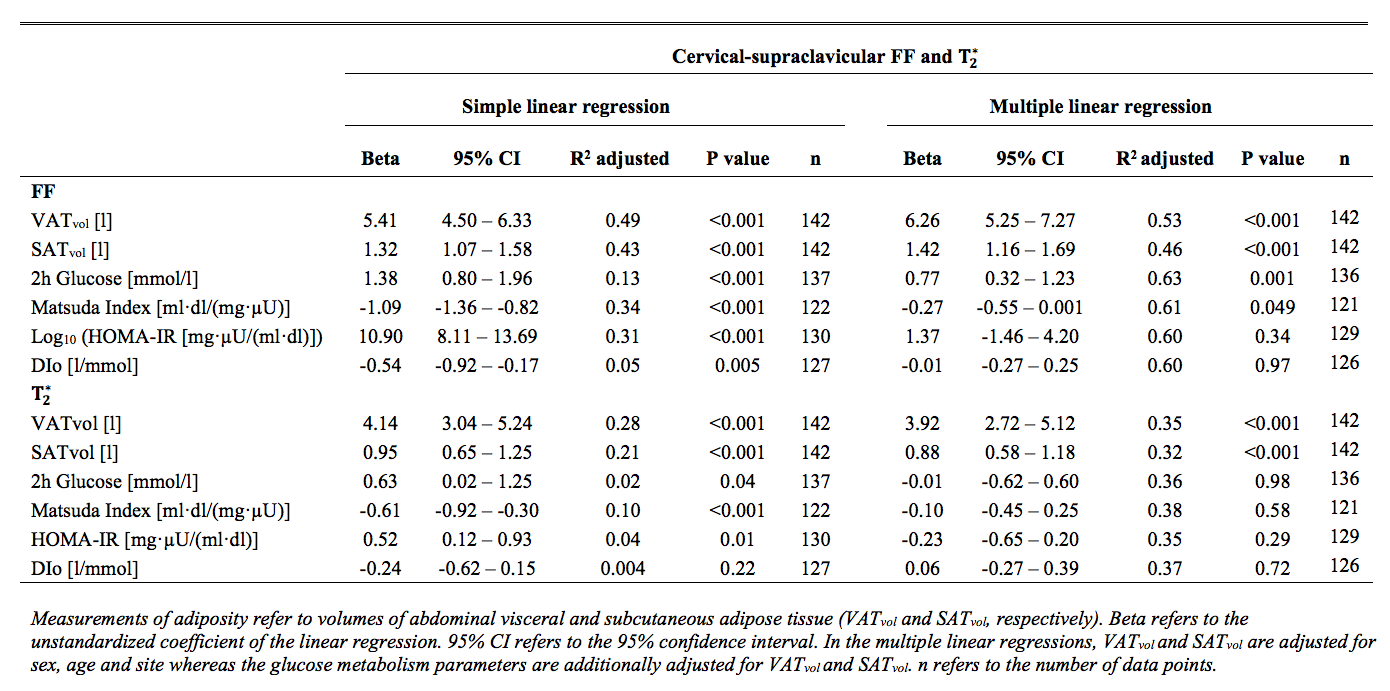
The associations of sBAT FF and T2* with adiposity and glucose metabolism are presented in Table 2. From simple linear regression, correlations of FF and T2* with abdominal adiposity were obtained, with stronger correlations for VATvol than SATvol. These relationships persisted also after adjustment for sex, age and site (P<0.001). From simple linear regression, sBAT FF and T2* correlated positively with 2h glucose and HOMA-IR whereas negatively with Matsuda Index. In addition, sBAT FF but not T2* correlated negatively with DIO. When adjusting for age, sex, site and adiposity, only the associations between sBAT FF and 2h glucose (P=0.001) and Matsuda Index (P=0.049) persisted.Discussion
The positive correlations of sBAT FF and T2* with adiposity support and reinforce similar relationships previously observed in children and adolescents,2,4 by this time using a larger cohort and supplementary adjustments in the linear regressions. Moreover, sBAT FF but not T2* was observed to correlate with 2h glucose and Matsuda Index also after adjustment for sex, age and adiposity. Considering 2h glucose and Matsuda Index as important diagnostic and research tools for diabetes, these results indicate a direct link between BAT and glucose metabolism and contribute to the current knowledge of the functional role of BAT.Conclusion
The associations between the MRI estimates of BAT and adiposity support earlier indications of higher BAT amounts in lean as compared to overweight and obese children and adolescents. The additional associations with 2h glucose and Matsuda Index may reflect a role for BAT in glucose and energy metabolism that potentially could influence the risk of developing T2D.Acknowledgements
The research leading to these results received its funding from the European Community's Seventh Framework Programme under grant agreement no. 279153 and from the Swedish Research Council under grant agreement 2016-01040.References
1. Cypess AM, Kahn CR. Brown fat as a therapy for obesity and diabetes. Curr Opin Endocrinol Diabetes Obes. 2010;17(2):143-149.
2. Hu HH, Yin L, Aggabao PC, Perkins TG, Chia JM, Gilsanz V. Comparison of brown and white adipose tissues in infants and children with chemical-shift-encoded water-fat MRI. J Magn Reson Imaging. 2013;38(4):885-896.
3. Gifford A, Towse TF, Walker RC, Avison MJ, Welch EB. Characterizing active and inactive brown adipose tissue in adult humans using PET-CT and MR imaging. Am J Physiol Endocrinol Metab. 2016;311(1):E95-E104.
4. Deng J, Schoeneman SE, Zhang H, et al. MRI characterization of brown adipose tissue in obese and normal-weight children. Pediatr Radiol. 2015;45(11):1682-1689.
5. Pfannenberg C, Werner MK, Ripkens S, et al. Impact of age on the relationships of brown adipose tissue with sex and adiposity in humans. Diabetes. 2010;59(7):1789-1793.
6. Vijgen GH, Bouvy ND, Teule GJ, Brans B, Schrauwen P, van Marken Lichtenbelt WD. Brown adipose tissue in morbidly obese subjects. PLoS One. 2011;6(2):e17247.
7. Orava J, Nuutila P, Lidell ME, et al. Different metabolic responses of human brown adipose tissue to activation by cold and insulin. Cell Metab. 2011;14(2):272-279.
8. Koksharova E, Ustyuzhanin D, Philippov Y, et al. The Relationship Between Brown Adipose Tissue Content in Supraclavicular Fat Depots and Insulin Sensitivity in Patients with Type 2 Diabetes Mellitus and Prediabetes. Diabetes Technol Ther. 2017;19(2):96-102.
9. Berglund J, Kullberg J. Three-dimensional water/fat separation and T2* estimation based on whole-image optimization--application in breathhold liver imaging at 1.5 T. Magn Reson Med. 2012;67(6):1684-1693.
10. Berglund J, Johansson L, Ahlström H, Kullberg J. Three-point Dixon method enables whole-body water and fat imaging of obese subjects. Magn Reson Med. 2010;63(6):1659-1668.
11. Lundström E, Strand R, Forslund A, et al. Automated segmentation of human cervical-supraclavicular adipose tissue in magnetic resonance images. Sci Rep. 2017;7(1):3064.
12. Kullberg J, Hedström A, Brandberg J, et al. Automated analysis of liver fat, muscle and adipose tissue distribution from CT suitable for large-scale studies. Sci Rep. 2017;7(1):10425.
13. Matsuda M, DeFronzo RA. Insulin sensitivity indices obtained from oral glucose tolerance testing: comparison with the euglycemic insulin clamp. Diabetes Care. 1999;22(9):1462-1470.
14. Matthews DR, Hosker JP, Rudenski AS, Naylor BA, Treacher DF, Turner RC. Homeostasis model assessment: insulin resistance and beta-cell function from fasting plasma glucose and insulin concentrations in man. Diabetologia. 1985;28(7):412-419.
15. Utzschneider KM, Prigeon RL, Faulenbach MV, et al. Oral disposition index predicts the development of future diabetes above and beyond fasting and 2-h glucose levels. Diabetes Care. 2009;32(2):335-341.
Figures