2506
In Vivo Diffusion Magnetic Resonance Spectroscopy of Brown and White Adipose tissues1Laboratory of Molecular Imaging, Singapore Bioimaging Consortium, Agency for Science Technology and Research (A*STAR), Singapore, Singapore, 2Singapore Institute of Clinical Sciences, Agency for Science, Technology and Research (A*STAR), Singapore, Singapore, 3Clinical Nutrition Research Centre, Agency for Science, Technology and Research (A*STAR), Singapore, Singapore, 4Department of Endocrinology, Tan Tock Seng Hospital, Singapore, Singapore
Synopsis
There is a large interest in understanding the biophysical properties of BAT, WAT, and beige adipose tissues for evaluating its potential to improve whole body metabolism. Diffusion properties of tissues provide information on microstructure, anisotropy, and pathology. In the presence of cellular and sub-cellular barriers, and heterogeneity the lipid diffusion is restricted. Water diffusion has been well characterized in several organs. Fat diffusion has not been studied due to the hardware limitations. In this study, we have implemented diffusion-weighted spectroscopy for investigating in-vivo diffusion properties of BAT and WAT.
Introduction
Recent studies have established adipose tissue as a dynamic organ playing an important role in metabolic health. Brown adipose tissue (BAT) and white adipose tissue (WAT) play opposite roles in energy metabolism[1]. There is a large interest in understanding the biophysical properties of BAT, WAT, and beige adipose tissues for evaluating its potential to improve whole body metabolism. Diffusion properties of tissues provide information on microstructure, anisotropy, and pathology. In the presence of cellular and sub-cellular barriers, and heterogeneity the lipid diffusion is prone to restrict in biological tissues[2,3,4]. Water diffusion has been well characterized in several organs[5]. Fat diffusion has not been studied due to the hardware limitations[6,7]. Fat composition including saturated, monounsaturated, and polyunsaturated triglycerides play an important role in altering the metabolic properties of adipose tissues. Recently, ex-vivo NMR studies demonstrated the restricted behaviour of fat molecules in BAT[4]. In this study, we have implemented diffusion-weighted spectroscopy for investigating in-vivo diffusion properties of BAT and WAT.Material and Methods
All MR experiments were performed using a 9.4T Bruker BioSpec (Bruker, Germany) equipped with a maximum of 667.9 mT/m gradient system and ParaVision 6.0.1 operating software. A 72-mm inner diameter transmits /receive volume coil and a 20-mm diameter receive-only surface coil was utilized for all the experiments. A stimulated-echo acquisition mode (STEAM)-based sequence was implemented by adding a pair of unipolar diffusion gradients during the two TE/2 intervals[2]. The pre-emphasis of the gradient system was carefully adjusted to exhibit minimum eddy currents.
Phantom Measurements
The gradient strength was calibrated with water phantom at ~21 °C. A total of 12 spectra were acquired with TR/TE/TM = 3000/ 10.6/ 10 ms, 32 averages, and diffusion parameters δ/Δ =23.3/ 2.5 ms with a maximum b value of 1908 s/mm2 for the water phantom. The sequence was first tested using phantoms of oleic acid and butanol with mean chain length of 18 and 4, respectively, and molecular weight of 282 and 74 g/mol[7]. Diffusion spectra were acquired with TR/TE/TM/δ/Δ = 4000 /30 /25.5/10 /40.5 ms, 32 averages and 4000/ 50/ 75.5/ 10 /100.5 ms, 32 averages for butanol and oleic acid respectively. The maximum b value for oleic acid and butanol were ~40000 and ~4000 s/mm2.
In-vivo Measurements
All the animal experiments and procedures were conducted according to the animal protocols approved by the local IACUC. Eight male Wistar rats (InVivos, Singapore) aged 9-12 weeks (~280 – 340 g) fed with regular chow diet were utilized. T1-weighted 2D and 3D anatomical images were acquired to localize the interscapular BAT and gonadal WAT. Diffusion experiments were performed within the BAT and WAT with a voxel size of ~2 × 2 × 2 mm3. Spectra were acquired with TR/TE/TM/δ/Δ = 3000/ 30/ 25.5/ 40.5/ 10 ms, 32 averages. A total of 12 spectra were acquired increasing gradient strength (0% to 65%), which corresponded to the maximum b values of ~70615 s/mm2. To investigate the restriction behaviour of fat molecules, spectra were acquired with short and long diffusion time Δ = 40 and 250 ms. Data Analysis All resonances were assigned with reference to the water signal. The signal decay was quantified using the Stejskal–Tanner equation. A customized Levenberg–Marquardt nonlinear least squares algorithm-based fitting routine was used to compute the peak areas by Gaussian modelling. Prior to peak integration, the individual free induction data were automatically processed for the removal of bad averages and alignment of the phase and frequency[8]. The apparent diffusion coefficient (ADC) was estimated for variable ∆ values by least-square curve fitting of the signal decay[4].
Results
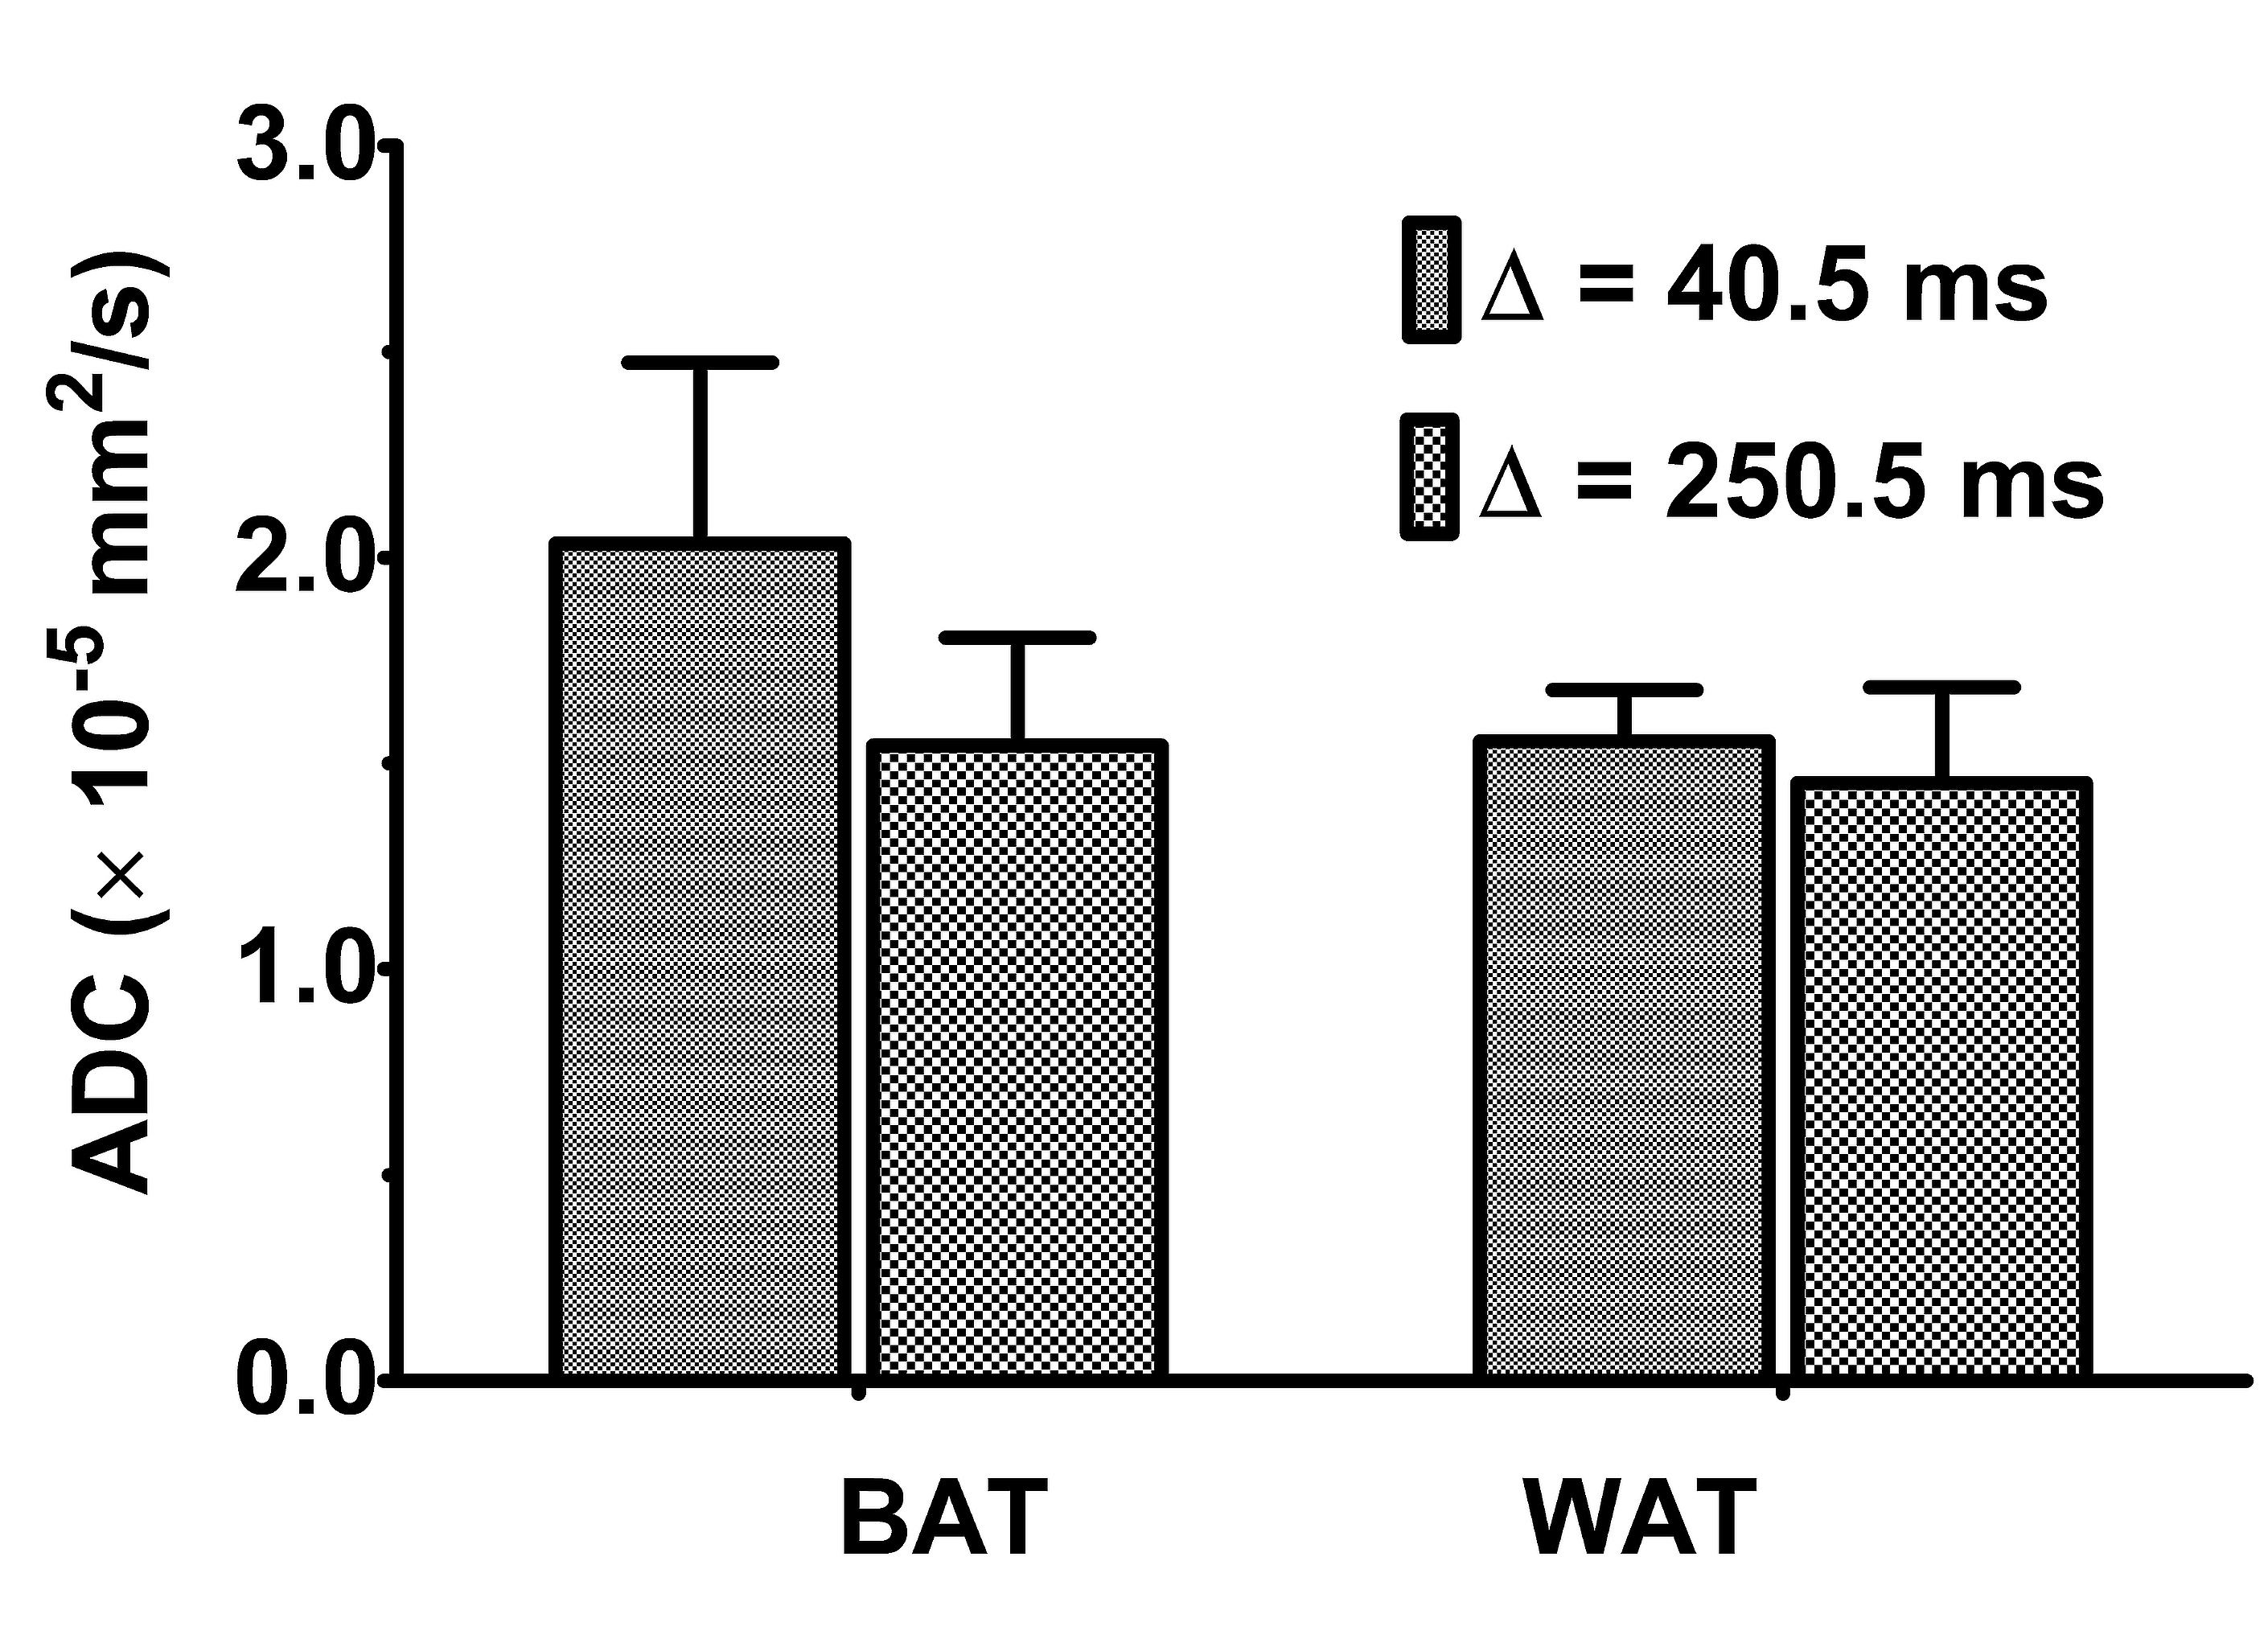
The gradients were calibrated with water phantom, and the ADC of 2.13 × 10⁻³ mm2/s was estimated at 21º C. Diffusion signal decay curves for butanol and oleic acid are shown in Figure 1. Butanol and oleic acid exhibited mono- exponential diffusion decay with ADC values 26 × 10-5 and 2.54 × 10⁻⁵ mm2/s respectively. Figure 2 shows the anatomical location and spectrum from BAT and WAT. The water peak is seen in the BAT spectrum, whereas WAT tissues show minimal water. Figure 3 shows a representative diffusion-weighted signal decay curves with mono-exponential fit of the n-methylene resonance. Figure 4 shows the box plot of the ADC for BAT and WAT with a significant difference. Figure 5 shows the restricted behaviour of fat molecules within BAT with a significant reduction of ADC with increasing diffusion time.Discussion and Conclusions
We have implemented diffusion-weighted MRS for investigation of fat molecules. For the first time, we have demonstrated diffusion properties of BAT and WAT in-vivo. The fat molecules diffused faster in BAT compared to WAT. The diffusion of fat molecules within BAT showed restricted behavior which is in agreement with earlier ex-vivo work[4].Acknowledgements
No acknowledgement found.References
- Cinti S. Between brown and white: novel aspects of adipocyte differentiation. Ann Medicine 2011; 43(2), 104-115.
- Cao P, et al. Diffusion magnetic resonance monitors intramyocellular lipid droplet size in vivo. Magn Reson Med 2015; 73(1):59-69.
- Brandejsky V, et al. Restricted or severely hindered diffusion of intramyocellular lipids in human skeletal muscle shown by in vivo proton MR spectroscopy. Magn Reson Med 2012; 67(2):310-6.
- Verma S, et al. Differentiating brown and white adipose tissues by high-resolution diffusion NMR. J Lipid Res 2017; 58(1), 289–298.
- Chilla GS, et al. Diffusion weighted magnetic resonance imaging and its recent trend-a survey. Quant Imaging Med Surg 2015; 5:407–22.
- Cao P, et al. In vivo diffusion MRS investigation of non‐water molecules in biological tissues. NMR Biomed 2017; 30(3).
- Steidle G, et al. Quantitative diffusion imaging of adipose tissue in the human lower leg at 1.5T. Magn Reson Med 2011; 65(4), 1118–1124.
- Simpson R, et al. Advanced processing and simulation of MRS data using the FID appliance (FID‐A). Mag Reson Med 2017; 77(1), 23–33.
Figures