2504
Identification and Characterization of Brown and White Adipose Tissue Depots in Rats by 3D Whole Body Imaging1Laboratory of Molecular Imaging, Singapore Bioimaging Consortium, Singapore, Singapore, 2Siemens Healthcare Pte. Ltd, SINGAPORE, Singapore
Synopsis
Excess body adiposity results in obesity and metabolic dysfunction. Identification and characterization of various white, brown and browning adipose tissues and the possibility of reversing pre-diabetic pathology is of current clinical interest for combating obesity and diabetes. In this study, we have identified and characterized various brown and white fat depots by whole body imaging in rats using a Siemens 3T Skyra system.
Purpose
To identify and characterize various BAT, WAT, Beige fat depots by 3D whole body fat fraction ImagingIntroduction
Imbalance in lipid accumulation and expenditure results in obesity1. Fat storage occurs in white adipose tissue (WAT) and energy expenditure by fat oxidation occurs in brown adipose tissue (BAT). Other type of fat known as beige (brown in white), occurs in certain WAT depots2. The WAT can undergo browning process in response to stimuli that induce and enhance the expression of thermogenesis. 3D whole body imaging permits investigation of various fat depots in the body with increased signal to noise and improved resolution3. 3D imaging avoids signal leakage between neighbouring slices due to imperfect slice profiles leading to better resolution in the third-space dimension. Functional differences among various fat depots can be investigated with an intervention that induces the browning process.Methods
Experimental procedures were in compliance and approved by institutional animal care and use committee. Male Wister rats of ~9 months old were fed with chow diet (CD) and randomized into Group 1(Gp1): Saline and Group 2 (Gp2): β3 agonist treatment groups. Both groups of animals were maintained on CD for 9 months of age, Gp2 animals were treated with β3 agonist at 0.1 mg/Kg body weight and Gp1 animals were treated with equal volume of saline for 5 days. Whole body MR imaging was performed using 3T Siemens Skyra Scanner with a transmit/ receive extremity coil (Siemens Healthcare, syngo VE11C). Anatomical imaging was performed by high resolution gradient-echo 3D T1 weighted imaging with TR/TE; 6.2/2.46 ms, FOV; 126 × 192 mm, matrix size; 252 × 384, slices; 128, thickness; 0.5 mm. A 3D multi-echo (6 echoes) volume-interpolated breath-hold examination (VIBE) Dixon sequence was utilized for water and fat images with repetition time TR; 11 ms, TE’s (1.10, 2.63, 4.1, 5.57, 7.04 and 8.51 ms); FA 40, FOV; 126 mm × 192 mm, matrix size; 126 × 192, slices; 128, thickness; 1 mm. Multi-echo complex data were fit using Levenberg-Marquardt non-linear fitting using the seven-peak fat model prior to get water and fat images4. Based on the abdominal anatomical structures, visceral fat depots were manually segmented in multiple slices of co-registered high resolution T1 weighted and FF maps using ITK-SNAP5. ROI’s from various fat depots were verified by two researchers. Binary mask was generated by the rolling ball background subtraction algorithm followed by ipercentile based automatic thresholding method. Morphological operation (erode and dilation) was performed to remove the extra unwanted regions and to fill the holes inside the initial mask using ImageJ6. The final mask was applied to FF and T1 to exclude the unwanted region and background.
Results and Discussion
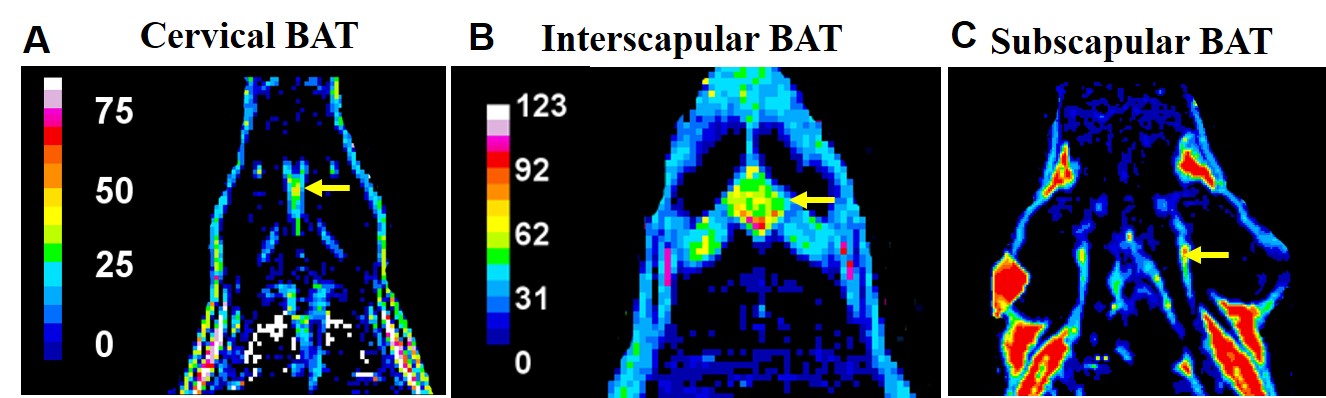
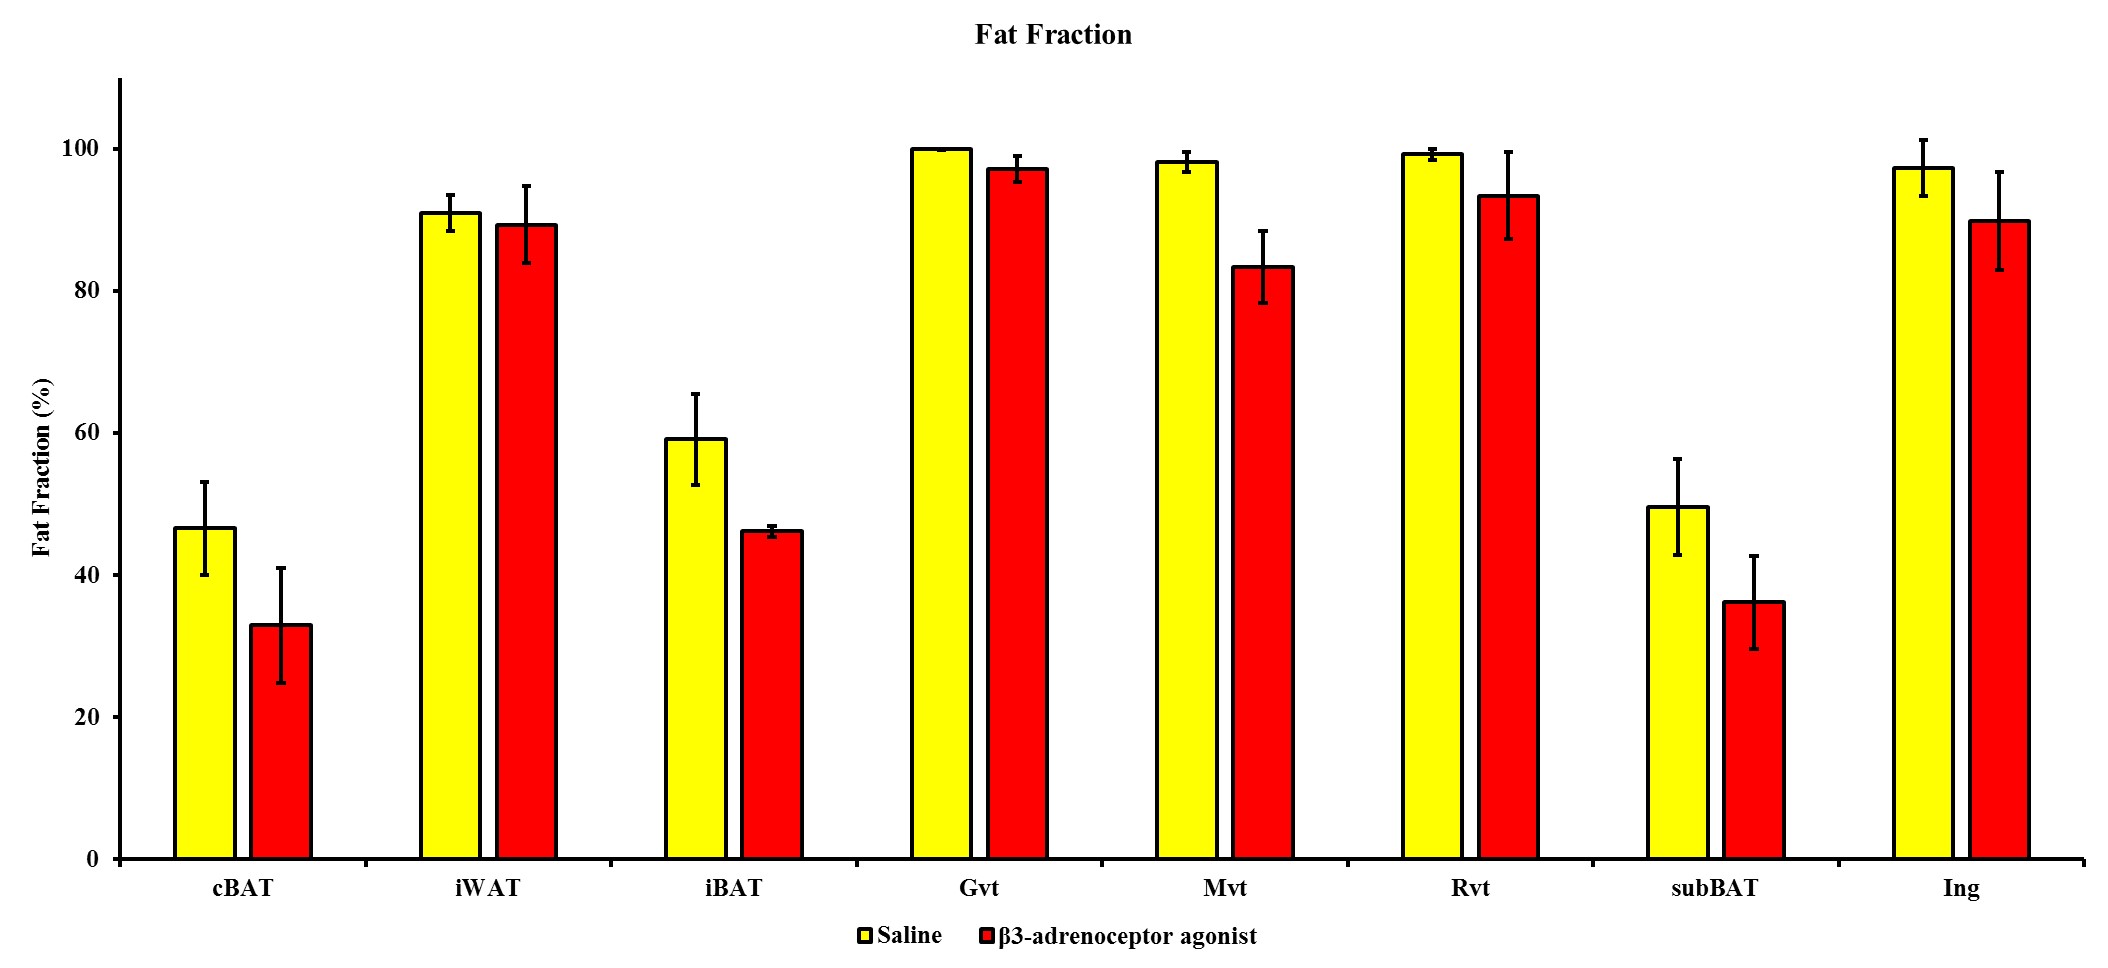
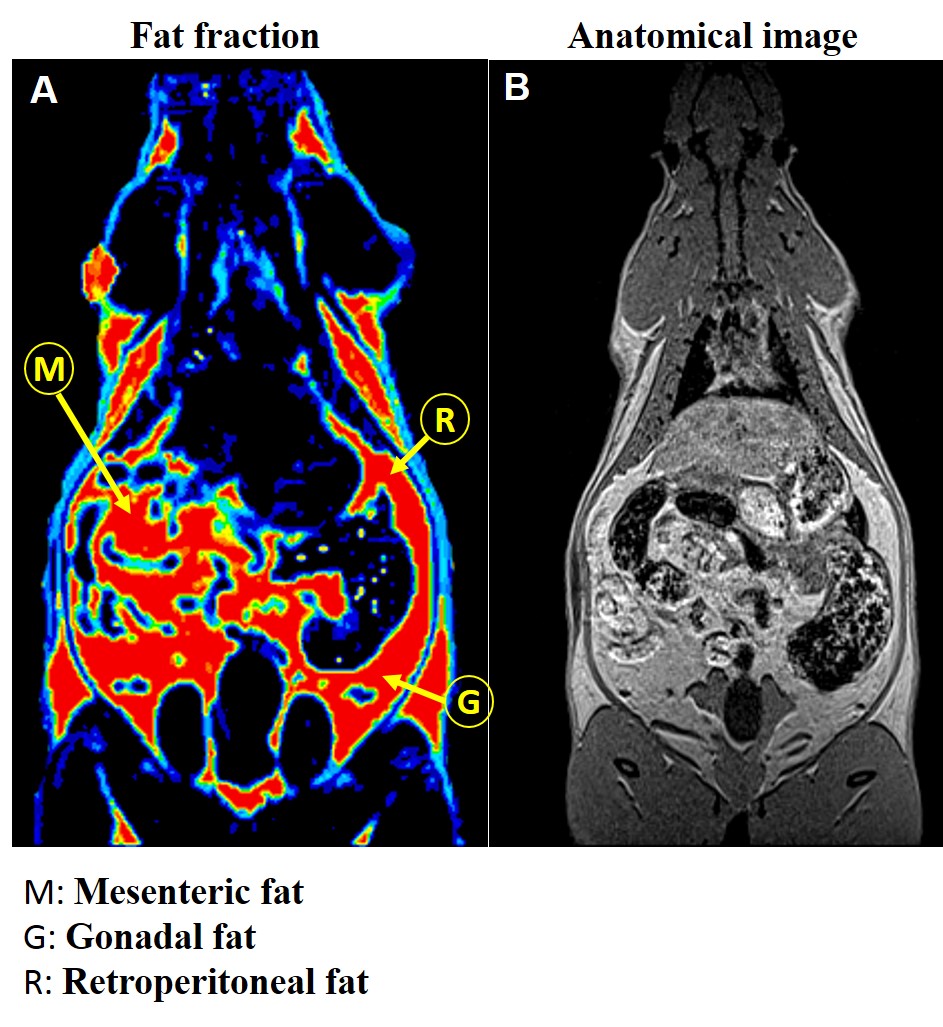
Conventional 2D imaging approaches for body applications have limited field of view and coverage and is not suitable for structures that have complex overlap with other tissue compartments. In this study, we optimized whole body 3D anatomical and fat fraction (FF) imaging to identify and characterize various fat depots. For the first time we demonstrate the feasibility of imaging supraclavicular (sBAT) and cervical BAT (cBAT) along with interscapular BAT (iBAT). Figures 1A, B and C show the coronal sections of the FF images from iBAT, cBAT and sBAT from a rat. To investigate the changes in FF due to lipolysis and also to induce beiging effects we administered β3-adrenergic agonist and compared it with control group animals which received saline treatment. Figure 2 shows the FF values in BAT and WAT depots for both saline and drug treated animals. The BAT depots including iBAT, cBAT and sBAT showed significant reduction in FF compared to saline treated group. Figures 3A, B show the FF and anatomical images from the abdominal region. The major fat depots in the abdominal cavity including mesenteric, gonadal and retroperitoneal depots were assigned. Mesenteric fat is metabolically active and absorbs the free fatty acids from the digestive system through large vascular network7-8. The FF from various depots including mesenteric fat depot showed significant reduction in drug treated group (Figure 2), suggesting that some white fat depots can undergo changes from white to beige due to β3 agonist intervention. Rendering the 3D volumes of the abdominal fat depots is feasible with 3D imaging techniques and permits assessment of changes in individual fat depots with metabolic interventions.Conclusions
We have identified and characterized various BAT depots including cBAT, iBAT and sBAT by 3D FF imaging. The FF from BAT regions reduced significantly with BAT activation by β3 agonist. Compared to conventional 2D imaging techniques, whole body 3D imaging permits reliable identification, characterization of various fat depots in the body including mesenteric, gonadal and retroperitoneal compartments in the abdominal cavity.Acknowledgements
No acknowledgement found.References
1. Joan S G, Hung C, Hung, et. al. Emerging complexities in adipocyte origins and identity, Trends in Cell Biology. 2016; 26 (5).
2. Cannon B. and Nedergaard J. Brown adipose tissue: function and physiological significance, Physiol Rev. 2004;84: 277.
3. Tarnoki D S, Tarnoki A D, Antje Richter , et al. Clinical value of whole-body magnetic resonance imaging in health screening of general adult population, Radiol Oncol. 2015; 49(1): 10–16.
4. Zhong X, Nickel MD, Kannengiesser SA, Dale BM, Kiefer B, Bashir MR. Liver fat quantification using a multi-step adaptive fitting approach with multi-echo GRE imaging. Magn Reson Med 2014;72: 1353–1365.
5. Schneider CA, Rasband WS, Eliceiri KW (2012) NIH Image to ImageJ: 25 years of image analysis. Nat Methods 9(7):671–675
6. Paul A. Yushkevich, Joseph Piven, Heather Cody Hazlett, Rachel Gimpel Smith, Sean Ho, James C. Gee, and Guido Gerig. User-guided 3D active contour segmentation of anatomical structures: Significantly improved efficiency and reliability. Neuroimage 2006 Jul 1;31(3):1116-28.
7. Wrońska Agata and Kmiec Zbigniew, Structural and biochemical characteristics of various whiteadipose tissue depots, Acta Physiologica, 2012; 205: 194.
8. Bjørndal B, Burri L, Staalesen Vidar, et al. Different adipose depots: their role in the development of metabolic syndrome and mitochondrial response to hypolipidemic agents, Journal of Obesity, 2011, doi:10.1155/2011/490650.
Figures