2502
Metabolic Imaging of Brown Adipose Tissue in Response to High Glycaemic Diet and Systemic Metabolic Effects on Whole Body Fat MetabolismJadegoud Yaligar1, Rengaraj Anantharaj1, Le Thi Thu Giang1, Sanjay Kumar Verma1, Venkatesh Gopalan1, Bhanu Prakash K N1, Karthik Mallilankaraman2, and S. Sendhil Velan1
1Laboratory of Molecular Imaging, Singapore Bioimaging Consortium, Singapore, Singapore, 2Department of Physiology, National University of Singapore, Singapore, Singapore
Synopsis
High-GI diet has been linked with insulin resistance, type 2 diabetes and cardiovascular risk factors. Brown fat activity positively correlates with increased energy expenditure during β3-agonist/cold induced BAT activation, suggesting regulatory link between BAT and energy metabolism. In this study we evaluated long term metabolic effects of high and low-GI diets on brown adipose tissue metabolism and ectopic fat accumulation in liver and abdomen by MRI and MRS. Low-GI diet fed animals were responsive to prolonged BAT activation for metabolizing the fat. Weight and volumes of iBAT increased with β3-agonist treatment, implying potential remodeling of WAT into Beige.
Purpose
Evaluating the metabolic effects of brown adipose tissue in response to high glycaemic diet and systemic effects on whole body fat metabolism.Introduction
Worldwide dietary patterns have turned toward to increased intake of refined carbohydrate and higher glycaemic index (GI) diets. High-GI diet has been linked with insulin resistance, type2 diabetes and cardiovascular diseases independent of bodyweight1-3 and low GI diets have been associated with improved insulin sensitivity. Brown adipose tissue (BAT) activity positively correlates with increment of energy expenditure during β3-agonist or cold induced BAT activation, suggesting a regulatory link between BAT and energy metabolism4. In this study we evaluated the long term metabolic effects of high and low GI diets on BAT metabolism and ectopic fat accumulation in liver and abdomen.Methods
Eight weeks old,Wister rats were randomized into two cohorts; cohort-1(n=10) and cohort-2 (n=10), were fed high and low GI diet from week 8 to 19. After 19th week, each cohort was subdivided into Group 1 and 2, which were treated with saline and CL-316243 for 14 days respectively. Longitudinal MRS and MRI measurements were performed at 8, 12, 16, 19, 20 (day 7) and 21 (day 14) weeks of age with 7T MRI/MRS scanner using 72 mm volume transmit and 2x2 phased array coils. Dixon imaging was performed in iBAT and in abdomen. Imaging parameters were: FOV;54x54mm2, matrix size;256×256, resolution;211μmx211μm, ST; 1mm, TR;8ms, FA;8°, out-of-phase(1.0ms) and in-phase(2.5ms) echo times. Localized MRS was performed with PRESS sequence in liver with TR/TE;4s/TE13ms, NA;64, voxel volume;64 mm3. Fat content from in vivo spectra were quantified using LC Model software5.Results and Discussion
Figure 1 shows body weight curves of rats fed with high & low GI diets. Body weight of high GI group rats was significantly higher starting from 11th week compared to low GI group. Figure-2A,B shows the longitudinal fat fraction (FF) images and Figure 2C shows the quantitative FF from iBAT region of high and low GI diet groups. In high GI group the FF significantly increased from 61.0±2.3% (week 8) to 70.6±1.3% (week 21) and in low GI group the FF increased from 60.9±1.6% to 67.18±3.8%. At day 7 of β3-agonist treatment, the FF reduced in both high and low GI groups of rats. Reduction in FF at day 7 in β3-agonist treated high and low GI groups was 21.1 and 23.3%. At day 14, the FF in high GI group did not decrease further where as in low GI the FF reduced to 35.9 %, indicating that the low GI diet was responsive to prolonged BAT activation for metabolizing the fat. Reduction of fat content after activation implies the lipolysis of lipids into free fatty acids utilized in β oxidation for thermogenesis. Fat pad measurements (Figures 3A,B) were performed to verify the imaging results. With the long term of feeding of GI (high and low) diets, the weight of iBAT kept reducing significantly (P<0.05) at 12, 16 and 21 weeks of age whereas after treating the animals with β3-agonist for 14 days, the weight and volume of iBAT got increased (P<0.05). Weight of iWAT decreased during the β3 agonist treatment which implies potential remodeling of WAT into beige fat. To understanding the response of abdominal fat with iBAT activation, we evaluated the visceral adipose tissue (VAT) and subcutaneous adipose tissue (SAT) volumes in both high and low GI groups. Figure-4A shows the abdominal fat segmentation images from high and low GI diet groups. Abdominal VAT (Figure-4B) and SAT (Figure-4C) volumes were significantly higher in high GI group compared to low GI group until 19 weeks. After day 7 and 14 of β3-agonist treatment, VAT volume decreased significantly both in high and low GI groups. Decrease in VAT (gonadal, mesenteric, retroperitoneal) was confirmed by fat pad measurements (Figure-4D). The liver fat (Figure-5A,B) increased progressively in high GI group and was significantly higher than low GI group. Excessive accumulation of lipids in liver is due to the De novo lipogenesis of carbohydrates from high GI diet gets converted into fatty acids which are then esterified to triacylglycerides.Conclusions
High GI diet fed group showed significant increase in body weight compared to low GI diet group. FF in iBAT of high and low GI diet groups significantly increased with diet intervention until 19 weeks and reduced with BAT activation. Low GI diet fed animals were responsive to prolonged BAT activation for metabolizing the fat. Weight and volumes of the iBAT increased with β3-agonist treatment, implying potential remodeling of WAT into Beige fat. Abdominal VAT and SAT volumes were significantly higher in high GI group compared to low GI group. Visceral fat volumes reduced significantly in both groups in response to the β3 agonist intervention.Acknowledgements
No acknowledgement found.References
- Christian K. Roberts, and Simin Liu, J Diabetes Sci Technol. 2009, 3, 697–704.
- Henry, C.J.K., & Ranawana, V. Nature, 482(7386): 471. (DOI:10.1038/482471a)
- Walter Willett, JoAnn Manson, and Simin Liu, Am J Clin Nutr , 2002,76, 274S-280S
- Villarroya L. et al, An endocrine role for brown adipose tissue. Am J Physiol Endocrinol Metab. 2013;305:E567-E572
- Provencher SW. Automatic quantitation of localized in vivo 1H spectra with LCModel.NMR Biomed. 2001;14:260-264.
Figures
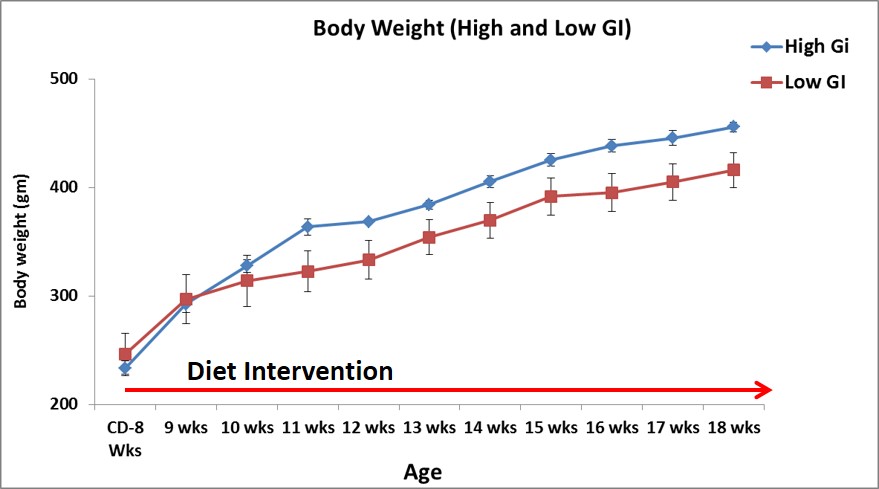
Figure 1. The body weight curves of rats fed with high and low
GI diets.
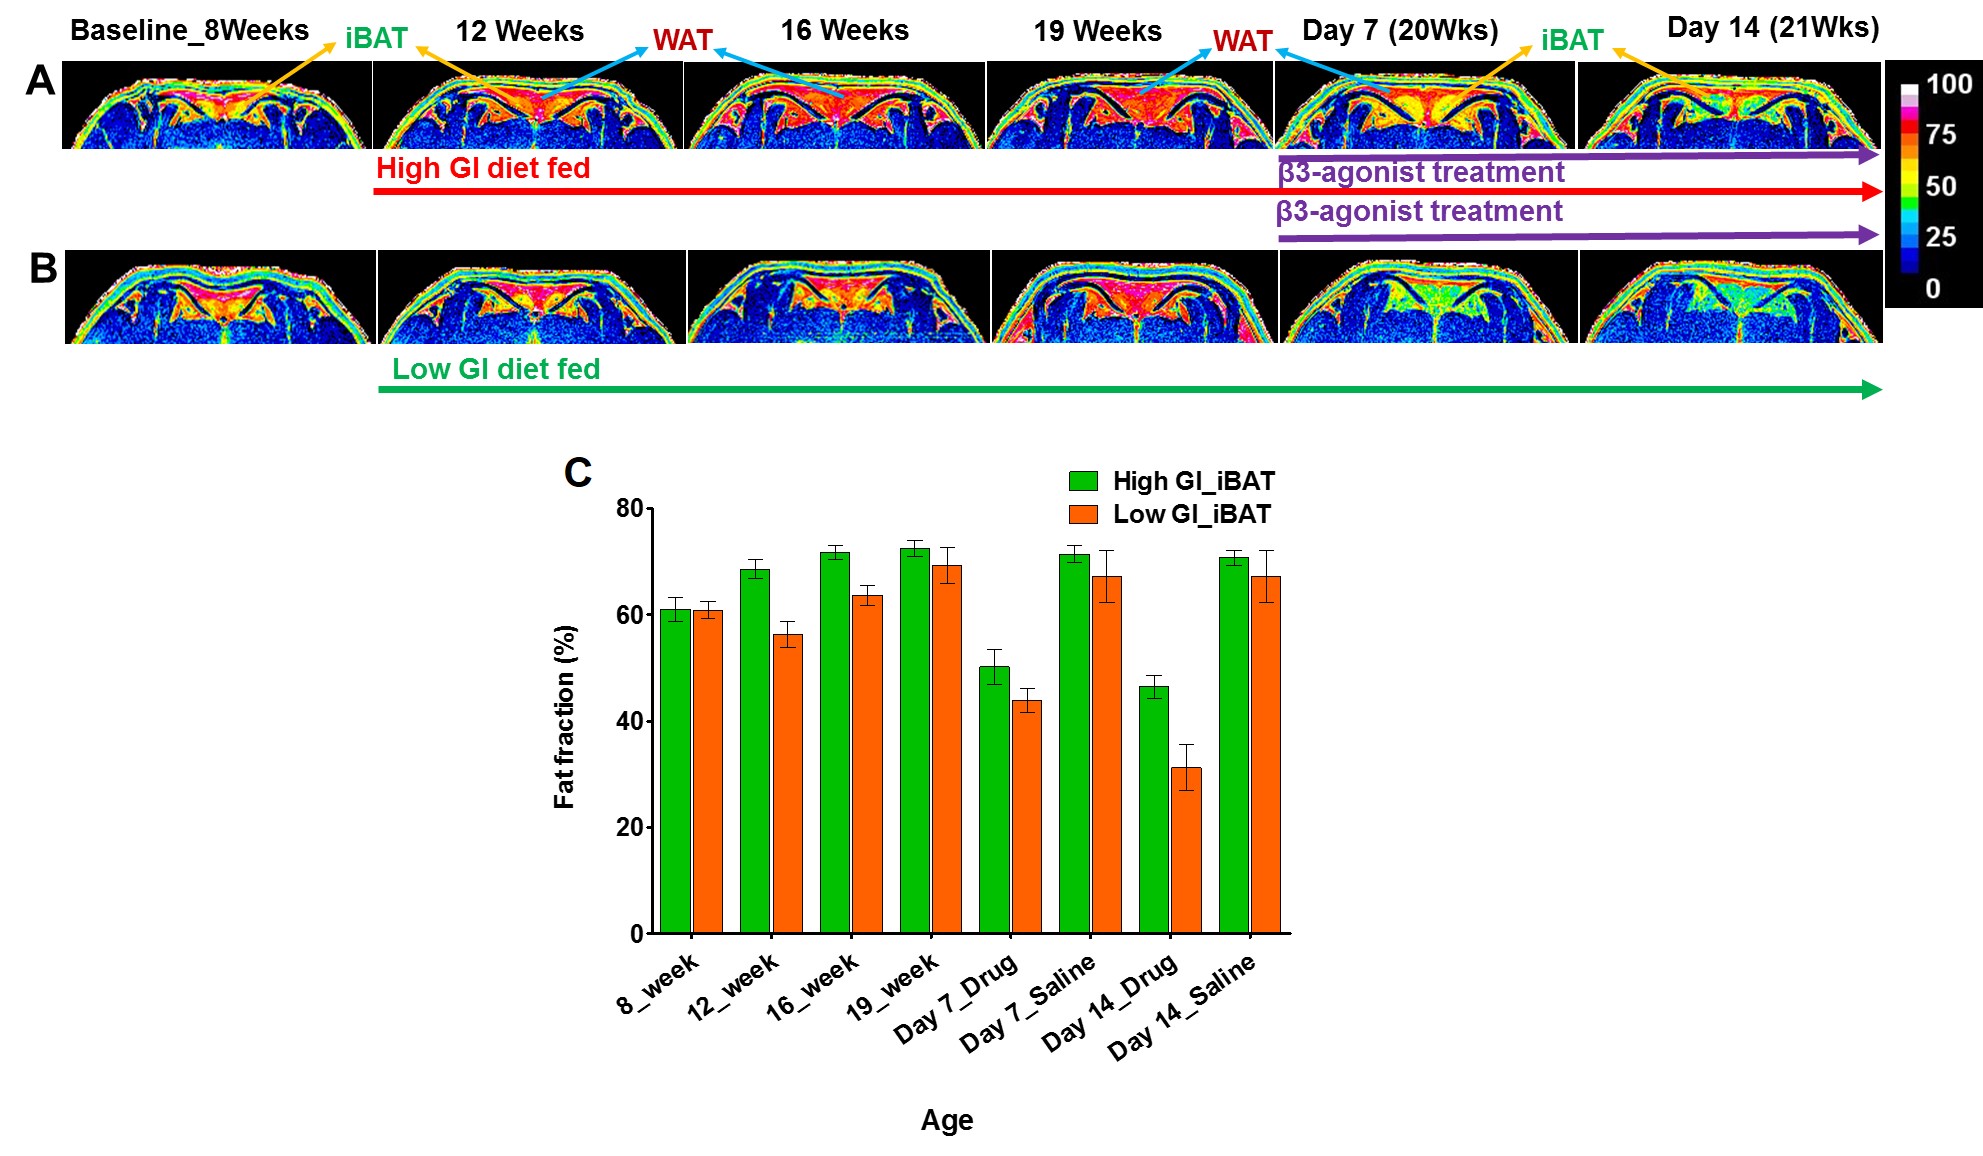
Figure 2A, B, C. Longitudinal fat fraction (FF) images at 8, 12, 16 and 19 weeks from (A)
high GI and (B) low GI diet fed rats. After 19th week, animals were
treated with β3-agonist for 14 days. The FF images from day 7 and day 14 of β3-agonist
treatment were showed. (C) The quantitative FF from iBAT region of high and low
GI diet fed rats.
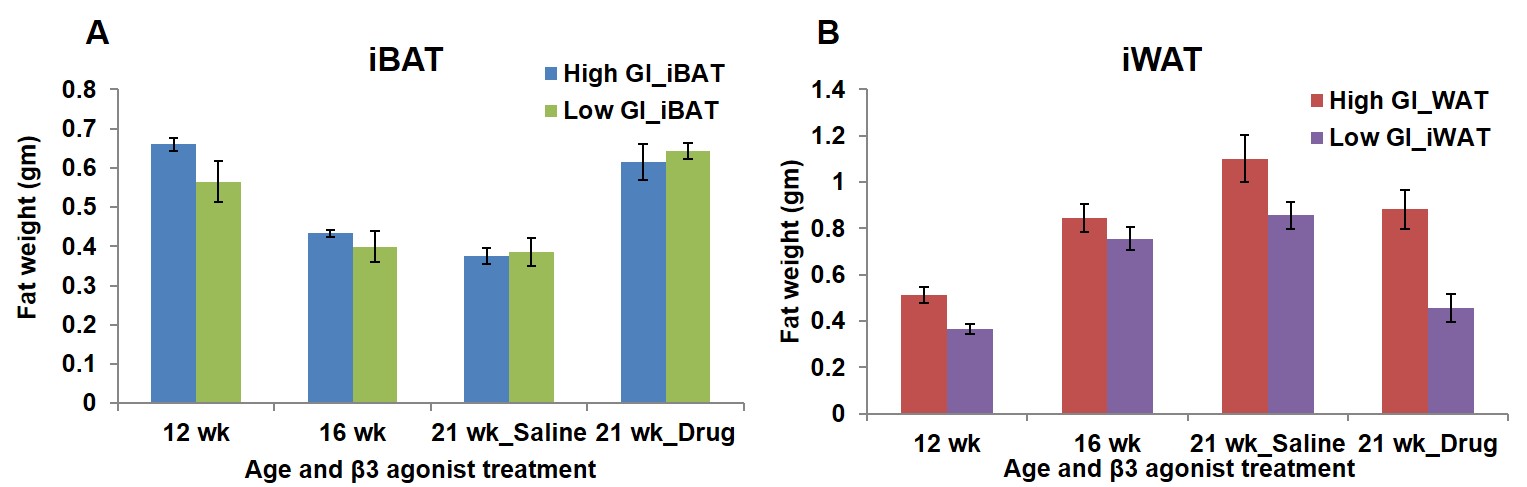
Figure 3 A, B. The
fat pad measurements from (A) iBAT and (B) iWAT of high and low GI diet fed
rats at 12, 16 and 21 weeks.
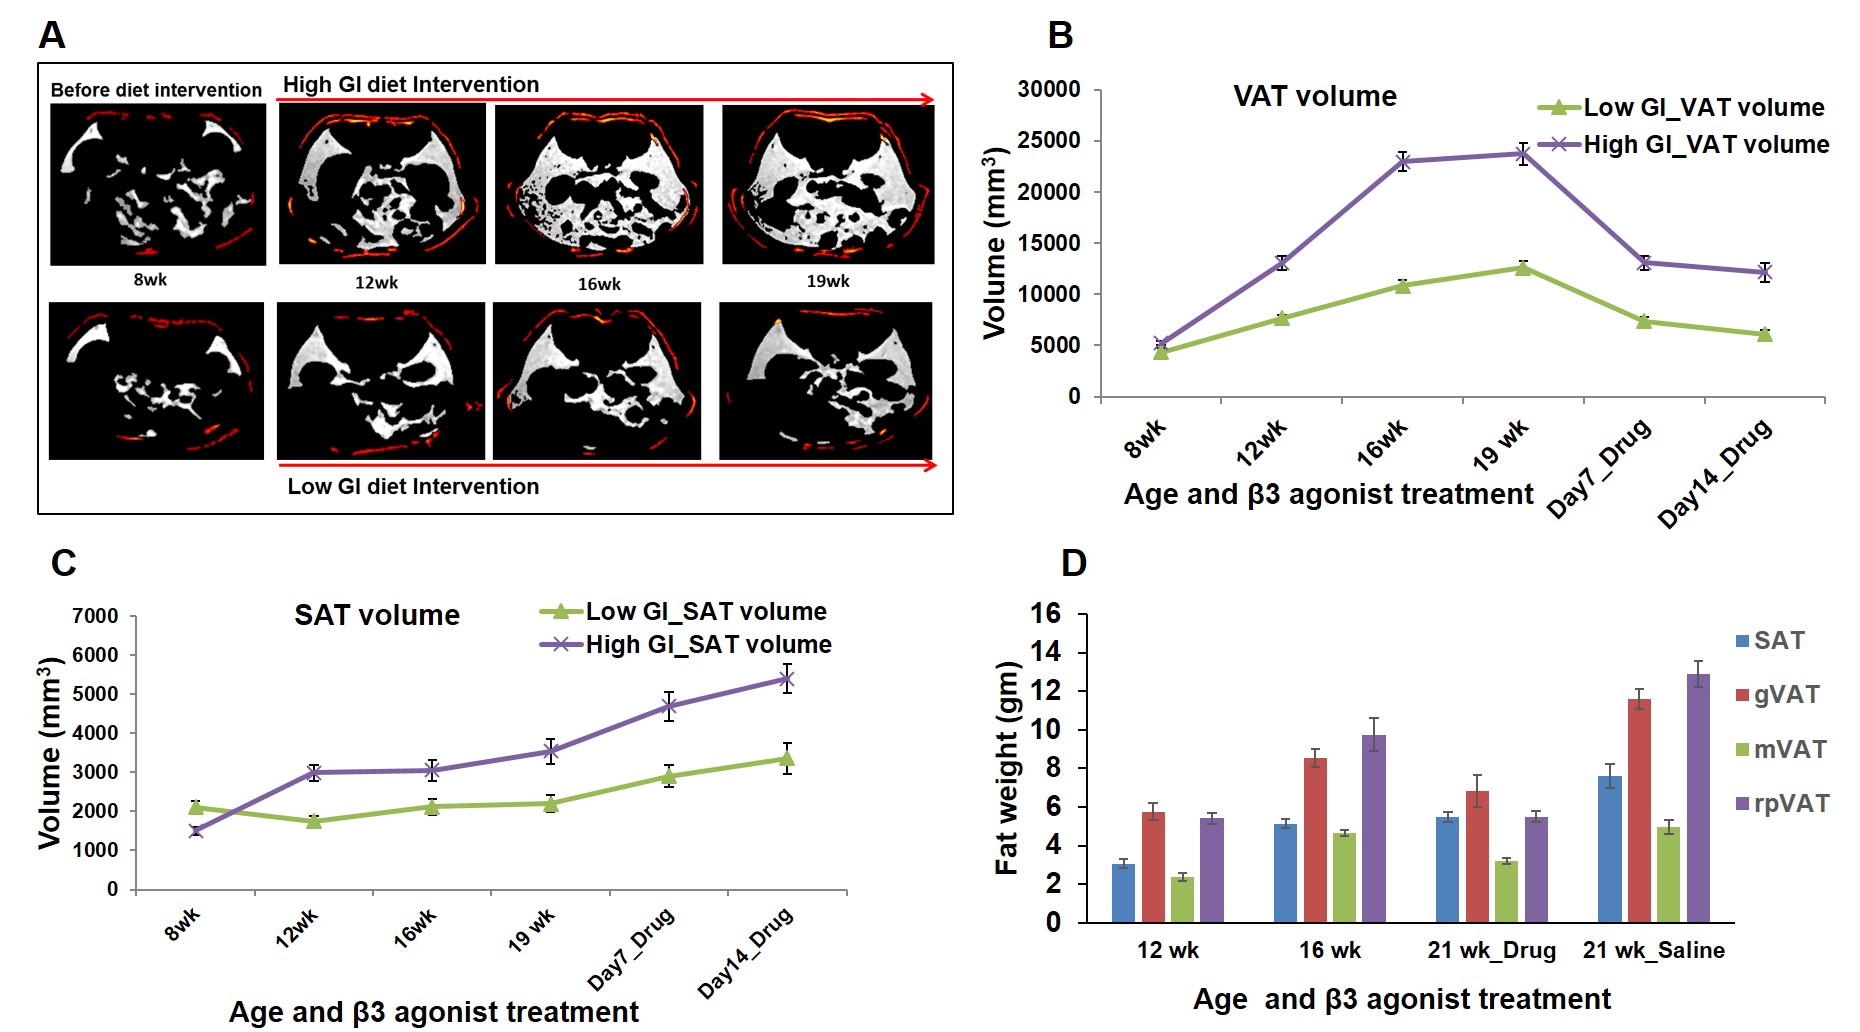
Figure 4 A, B, C, D. (A) Segmented
visceral (white) and subcutaneous (red) abdominal fat
depots from high and low GI diet fed animals. Quantitative fat volumes from (B) visceral
and (C) subcutaneous fat depot from high and low GI diet fed animals at different
time points. (D) The fat pad measurements from subcutaneous (SAT), gonadal
(gVAT), mesenteric (mVAT) and retroperitoneal (rpVAT) fat depot of high GI diet
fed rats.
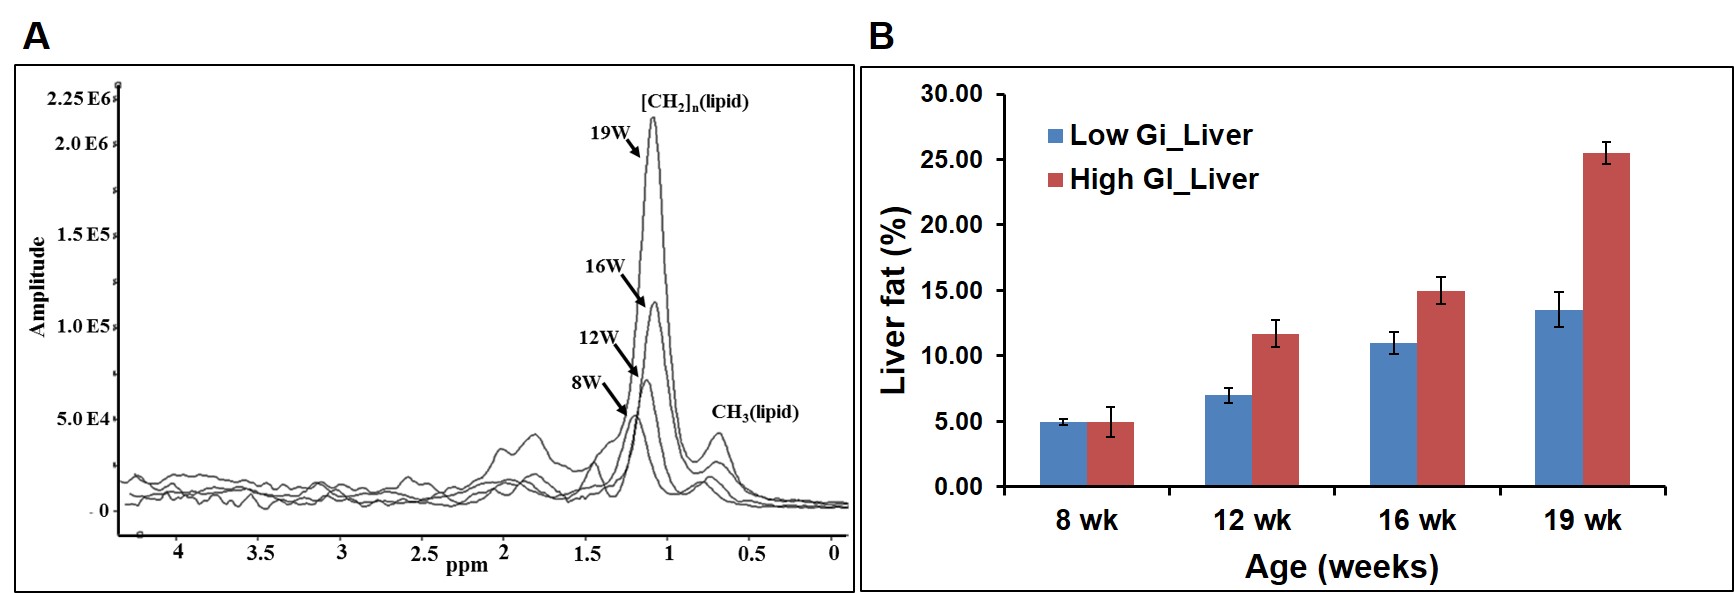
Figure 5 A, B. (A) Invivo spectra from liver of high diet fed rats at
8, 12, 16 and 19 weeks. (B) Liver fat content from high and low GI fed rats at
8, 12, 16 and 19 weeks.