2501
Metabolic Imaging and Characterization of Browning Adipose Tissue by DCE-MRI and Dixon ImagingJadegoud Yaligar1, Sanjay Kumar Verma1, Venkatesh Gopalan1, Rengaraj Anantharaj1, Giang Le Thi Thu1, and S. Sendhil Velan1
1Laboratory of Molecular Imaging, Singapore Bioimaging Consortium, Singapore, Singapore
Synopsis
Browning of white adipose tissues is emerging as a promising
Purpose
Development of non-invasive imaging methods for identification and characterization of browning adipose tissues.Introduction
Browning of white adipose tissues (WAT) is emerging as a promising strategy to increase whole-body energy expenditure and reduce obesity1-2. Earlier work has shown the vascular properties of classical iBAT with cold intervention3. Browning process is regulated by complex mechanisms and can be activated by adrenoreceptor stimulation and chronic cold exposure. Increasing the beige or BAT volume and enhancing its functional activity is a promising strategy for management of obesity. Feasibility of browning the WAT has been demonstrated by transcriptomic studies4. However, there is a lack of non-invasive methods for imaging the browning process. For the first time we demonstrate the feasibility of imaging the browning of white adipose tissue by DCE-MRI and fat fraction (FF) imaging and validated with gene expressions and histology.Methods
Eight weeks old, male Wister rats were randomized into two groups. Gp1 (n=6) rats were treated with saline and Gp2 (n=7) with β3-adrenergic agonist, CL-316243 at 1 mg/Kg body weight for 14 days. Anatomical and Dixon imaging was performed in inguinal WAT and iBAT region. Prior to imaging, all animals were catheterized for injecting the MR contrast agent gadolinium-diethylenetriamine pentaacetic acid at 0.2mmol/kg bodyweight of the animal. Dixon imaging was performed in inguinal and iBAT region. DCE-MRI was performed in inguinal region by using 3DFLASH sequence with following parameters: TR/TE;3/0.9 ms, FA;60, FOV;64x64 mm, slices;10, isotropic resolution;0.5x0.5x0.5mm, NA;1, time frames;270, temporal resolution;.9sec. Mutual information based affine registration was utilized to register all the data to average pre-contrast stack. The arterial input function was extracted from the concentration map by drawing ROI in the artery. Reference region model was used to process the DCE-MRI data by using DCE@urLAB software5. T1 values of blood ~2400ms and fat ~1000ms was utilized to compute the concentration followed by fitting the model6.Results and Discussion
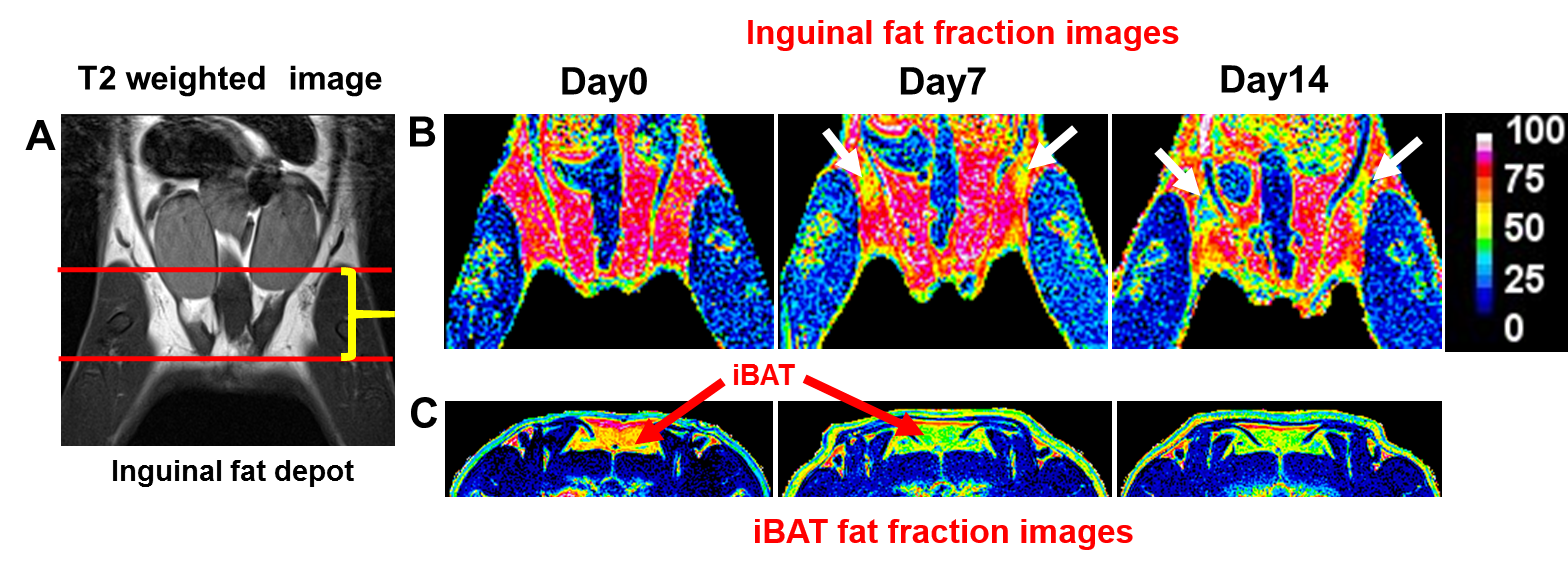
In this study, we investigated the fat metabolism and vascular perfusion characteristics of browning white adipose tissues. Figure 1A shows the anatomical MR image of inguinal white fat and the browning area is highlighted by arrows in day 7 and day 14 images. Figure 1B,C shows the changes in fat fraction within inguinal and iBAT region at day 0, 7 and 14 of β3- agonist treatment. Figure 2A shows the quantitative FF from the inguinal fat region of saline and β3 agonist treated rats. The FF from the highlighted area in inguinal region progressively decreased from 80.9±1.52 % (day 0), 59.62 ±1.52 % (day 7) and 45.10±2.2 % (day 14) respectively after drug intervention. Reduction of fat fraction FF is was due to the conversion of WAT into beige tissue and it involves the lipolysis of lipids into free fatty acids utilized for mitochondrial beta-oxidation. Figure 2B shows quantitative FF from classical iBAT. The FF was reduced from 54.27±2.0 % (day 0) to 43.2±1.8 % (day 7) respectively after drug intervention. Figure 3A shows the shows the Ktrans maps from inguinal region. Ktrans computed from the browning area (Figure 3B) at day 0 was 0.039±0.01 mL/100g/min which increased significantly to 0.179±0.01 mL/100g/min at day 7 and 0.468±0.02 mL/100g/min on day 14 (P>0.001) respectively. Increase of Ktrans during day 7, 14 after β3 agonist treatment, implies increased blood flow to the inguinal area due to browning process. Figure 4 shows the plot of extravascular-extracellular volume per unit of volume of tissue (ve) from the browning region. The ve significantly (P<0.05) increased at day 7, 14 in β3 agonist treated rats compared to saline group indicating increase in extracellular volume due to increased blood flow during browning process. Browning process is triggered by the secretion of fibroblast growth factors-21 and it plays physiological role in browning of WAT through autocrine and paracrine manner to increase the UCP1 and thermogenic gene PGC-1α7. Browning adipose tissues showed significantly increased UCP1 and PGC-1α expression in inguinal tissue. (Figure 5A,B). Browning of inguinal fat was further confirmed by H&E staining (Figure 5C,D). Clusters of beige/brown adipocytes were observed in β3-agonist treated rats, whereas large white adipocytes were dominant in saline treated rats.Conclusions
For the first time, we report the feasibility of non-invasive imaging of browning adipose tissues by FF imaging and DCE-MRI. We characterized the longitudinal changes in fat content and perfusion properties during browning process. Browning adipose tissues show significant reduction in FF and increase in tissue perfusion (Ktrans and ve) after treating with β3 agonist. Browning markers including UCP1 and PGC-1α levels increased in browning fat compared to WAT. Non-invasive longitudinal imaging approaches can be used for tracking the browning process and also to screen potential molecules that can induce browning for targeted conversion of WAT into beige fat.Acknowledgements
No acknowledgement found.References
- So Hun Kim and Jorge Plutzky, Brown Fat and Browning for the Treatment of Obesity and Related Metabolic Disorders, Diabetes Metab J. 2016 Feb; 40(1): 12–21.
- Harms M, Seale P, Brown and beige fat: development, function and therapeutic potential. Nat Med. 2013 Oct; 19(10):1252-63.
- Jadegoud Yaligar, et al., Evaluation of the Vascular Perfusion in Activated Brown Adipose Tissue by Dynamic Contrast Enhanced MR imaging, Proc. Int. Soc. Mag. Reson. Med. Program number # 1067.
- Harms M, Seale P. Brown and beige fat: development, function and therapeutic potential. Nature medicine. 2013;19(10):1252–63.
- Ortuno J.E. et al. DCE@urLAB: a dynamic contrast-enhanced MRI pharmacokinetic analysis tool for preclinical data. BMC Bioinformatics. 2013;14:316.
- Barbier EL, et al. A model of blood-brain barrier permeability to water: accounting for blood inflow and longitudinal relaxation effects. Magn Reson Med. 2002;47:1100-9.
- Cannon B, Nedergaard J. Brown adipose tissue: function and physiological significance. Physiol Rev. 2004;84(1):277–359
Figures
Figure
1 A, B, C. (A) T2 weighted anatomical MR image
of inguinal white fat. The fat fraction image from (B) inguinal fat and (C)
iBAT at day 0, day 7 and day 14 of β3-adrenergic agonist treatment, [browning
area in inguinal fat was highlighted]
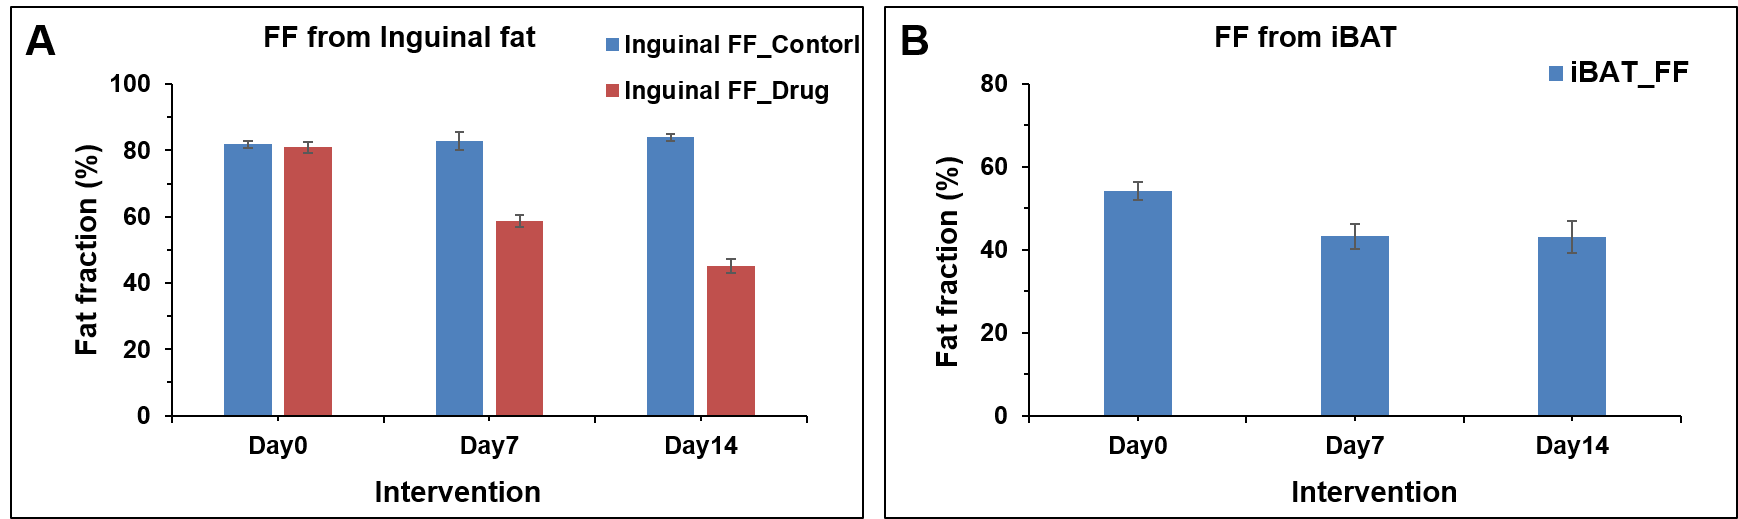
Figure 2 A, B. Quantitative FF from (A) inguinal fat
region and (B) classical iBAT of saline and β3
agonist treated
rats
at different time points.
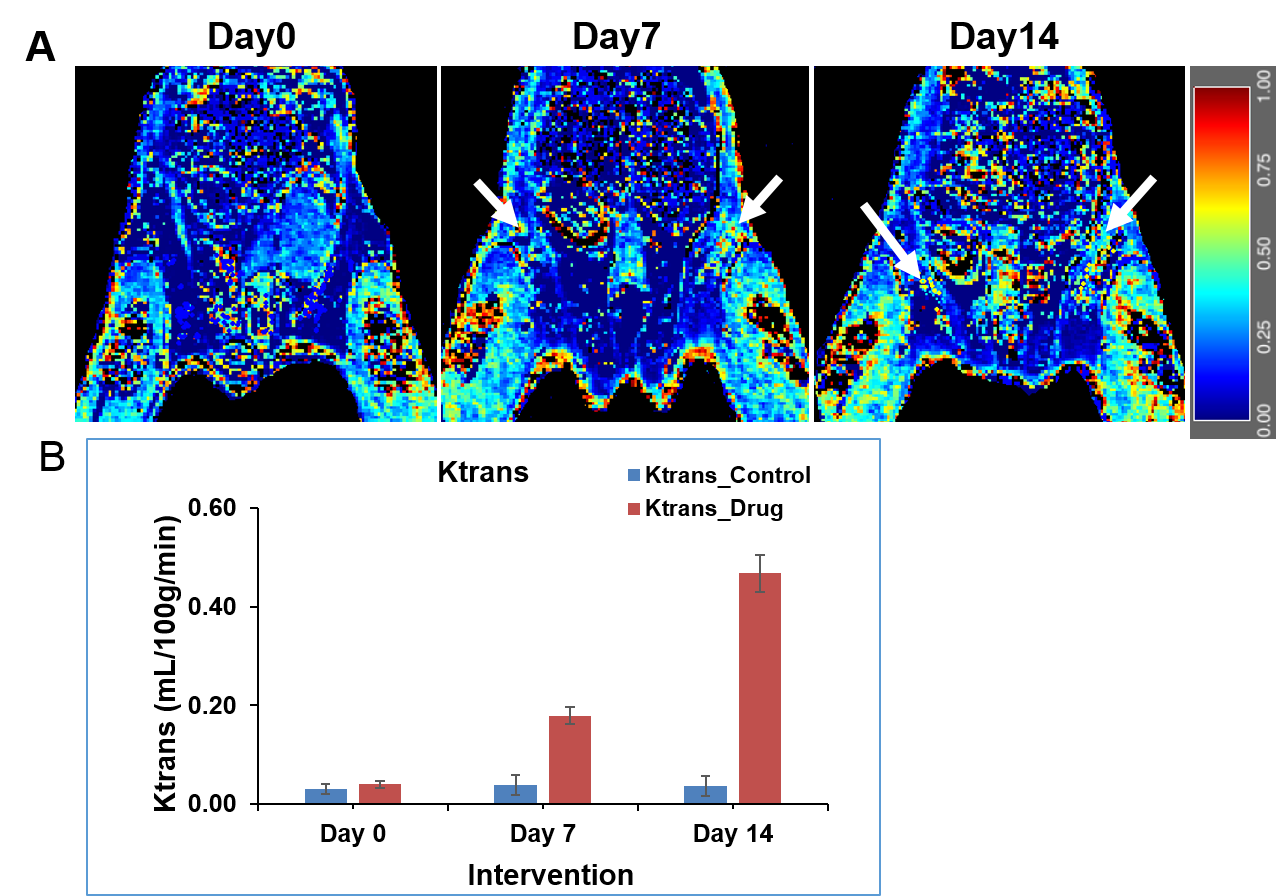
Figure 3 A, B. (A) The Ktrans maps from inguinal region at day 0, day 7 and day 14 of β3 agonist treatment. (B) The Ktrans from inguinal fat of saline and β3 agonist treated rats at day 0, day 7 and day 14.
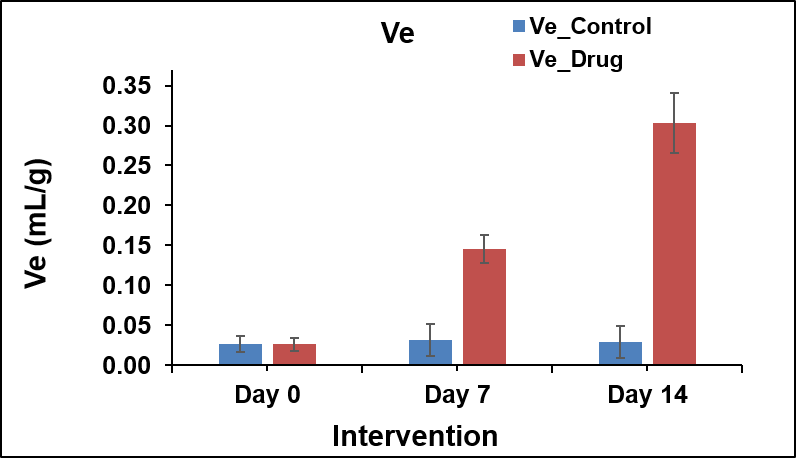
Figure 4. The plot of the extravascular-extracellular volume per
unit of volume of tissue (ve) from the browning region of
saline and β3 agonist treated rats at day 0, day 7 and day 14.
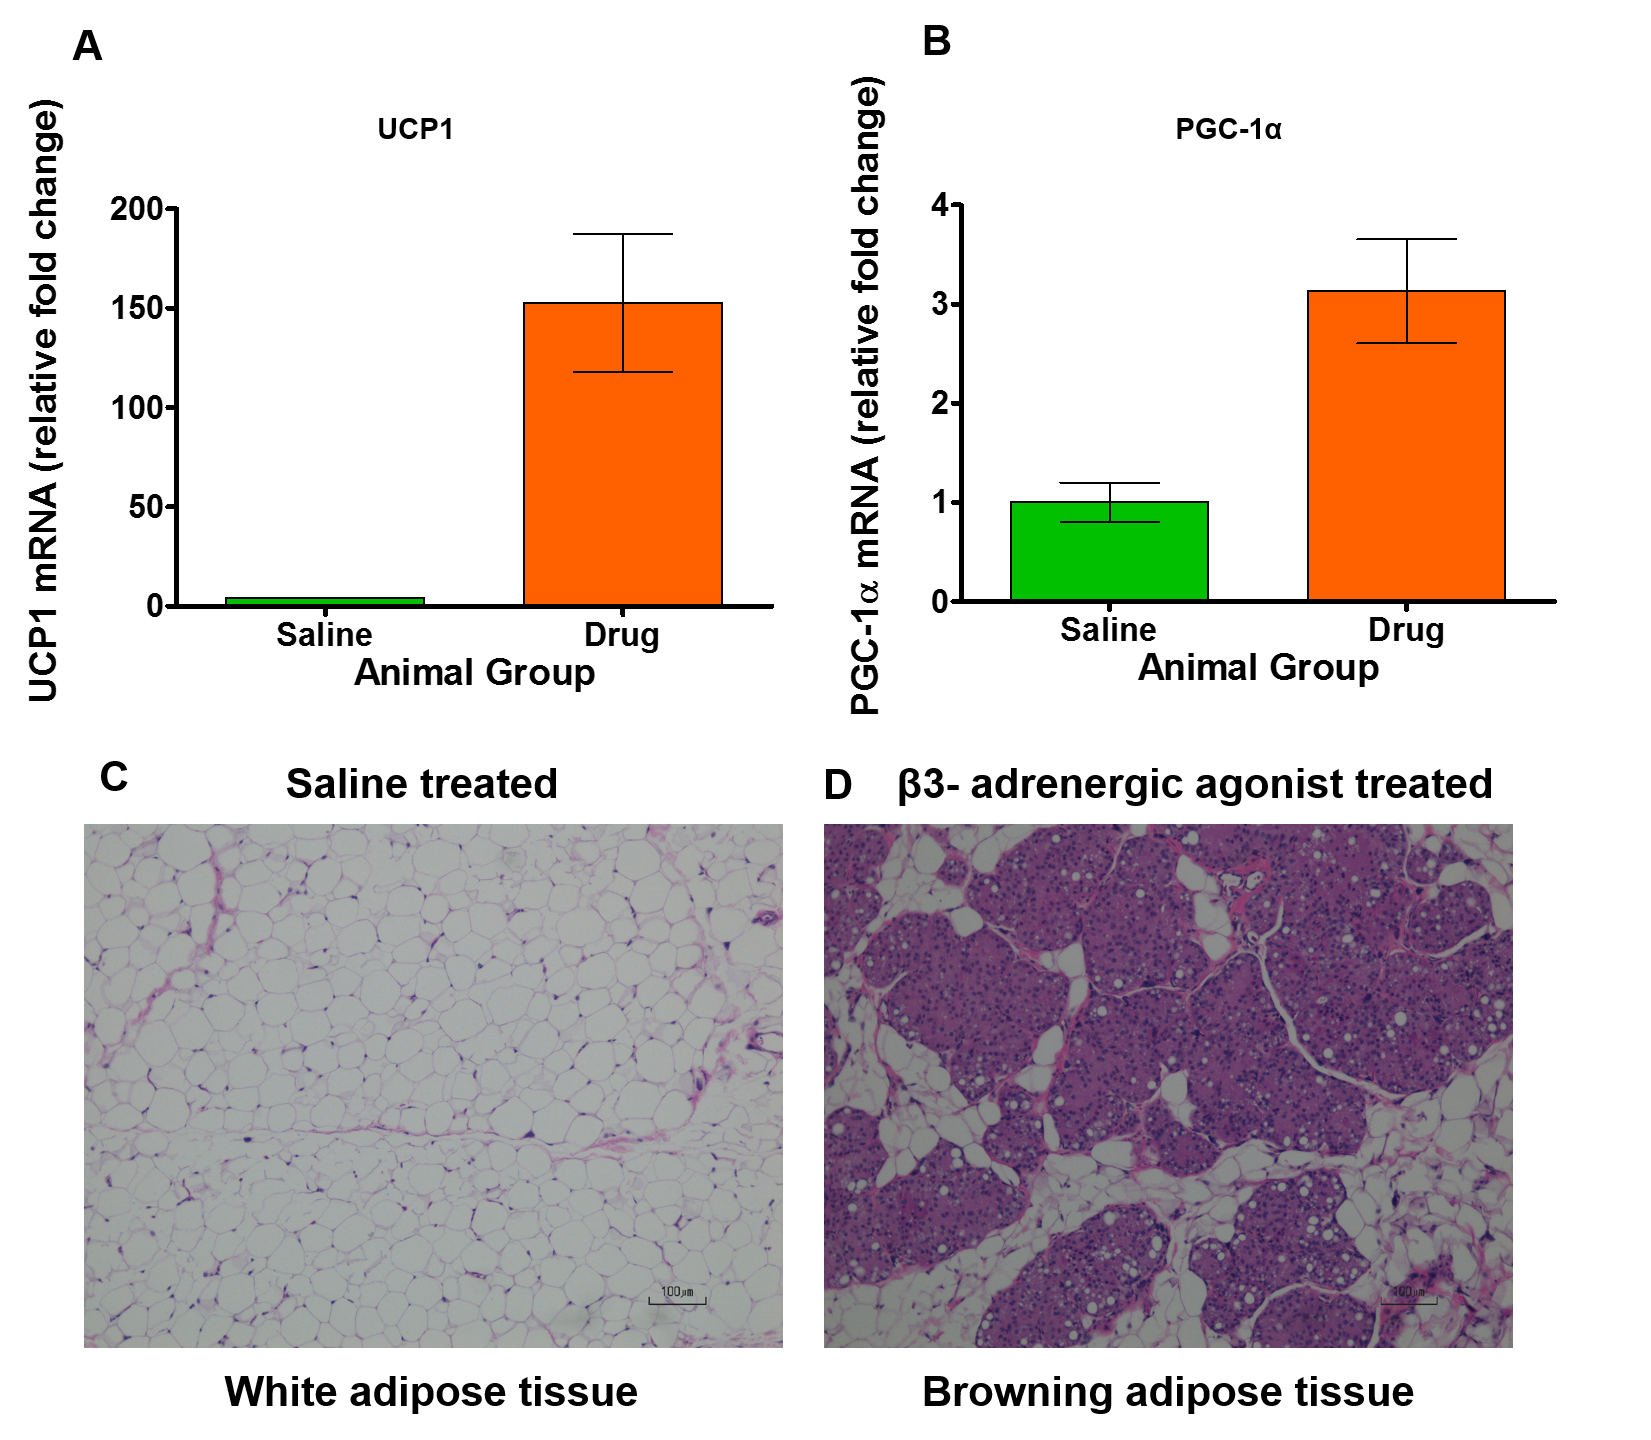
Figure 5 A, B. (A) The UCP1, (B) PGC1-α mRNA expression from the browning inguinal fat of β3- adrenergic agonist treated rats. Haemotoxylin and Eosin staining of (C) inguinal white fat treated saline and (D) browning fat treated with β3- adrenergic agonist.