2500
Abdominal and organ fat content quantification in PROFAST trial (Probiotics and intermittent fasting to improve pre-diabetes)1Auckland University of Technology, Auckland, New Zealand, 2University of Auckland, Auckland, New Zealand, 3School of Science, Auckland University of Technology, Auckland, New Zealand, 4College of Life Sciences, Shenzhen University, Shenzhen, China
Synopsis
The primary objective of this study was to test quantification protocols on human abdominal and organ fat data acquired using magnetic resonance (MR) imaging or spectroscopy. Liver, pancreatic, visceral and subcutaneous fat in 10 obese patients with prediabetes were measured before and after a 12-week intermittent fasting programme with daily probiotic or placebo supplementation. All participants were scanned by a Siemens 3.0T MR scanner. The quantification of fat contents was performed using ImageJ (for MRI data) and SIVIC software (for MRS data). Two methods of quantifying pancreas fat were compared.
Introduction
Visceral, liver and pancreas fat have been linked to type 2 diabetes risk1. In particular, accumulation of ectopic fat in the pancreas has been shown to increase the risk of metabolic syndrome2,3. Probiotic supplementation appears to be effective in glycemic control4. However, the effect of this treatment on visceral, liver and pancreas fat has not been thoroughly investigated. The most accurate ectopic fat measurement is via magnetic resonance (MR) technique5-8. We are conducting a clinical trial to study the effect of intermittent fasting with a probiotic supplement on visceral, liver and pancreas fat. The objective of this study was to test, compare and discuss the fat quantification protocols to determine their appropriateness for application in that trial.Methods
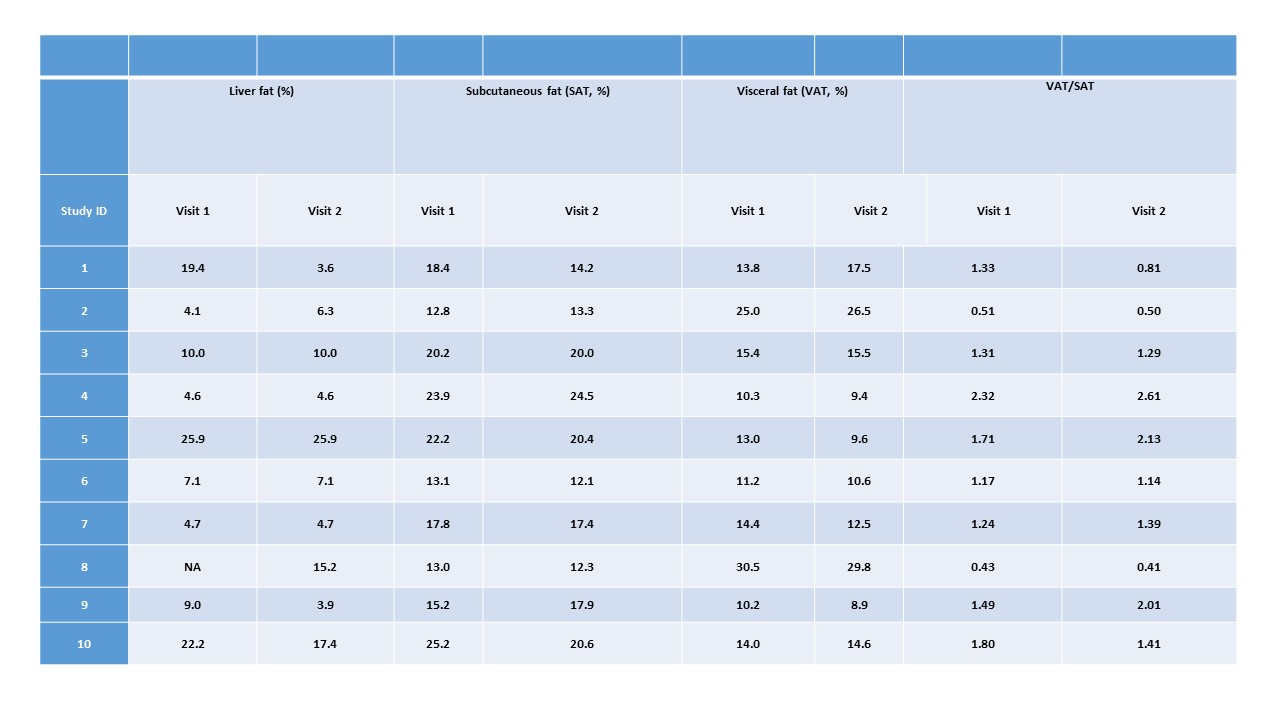
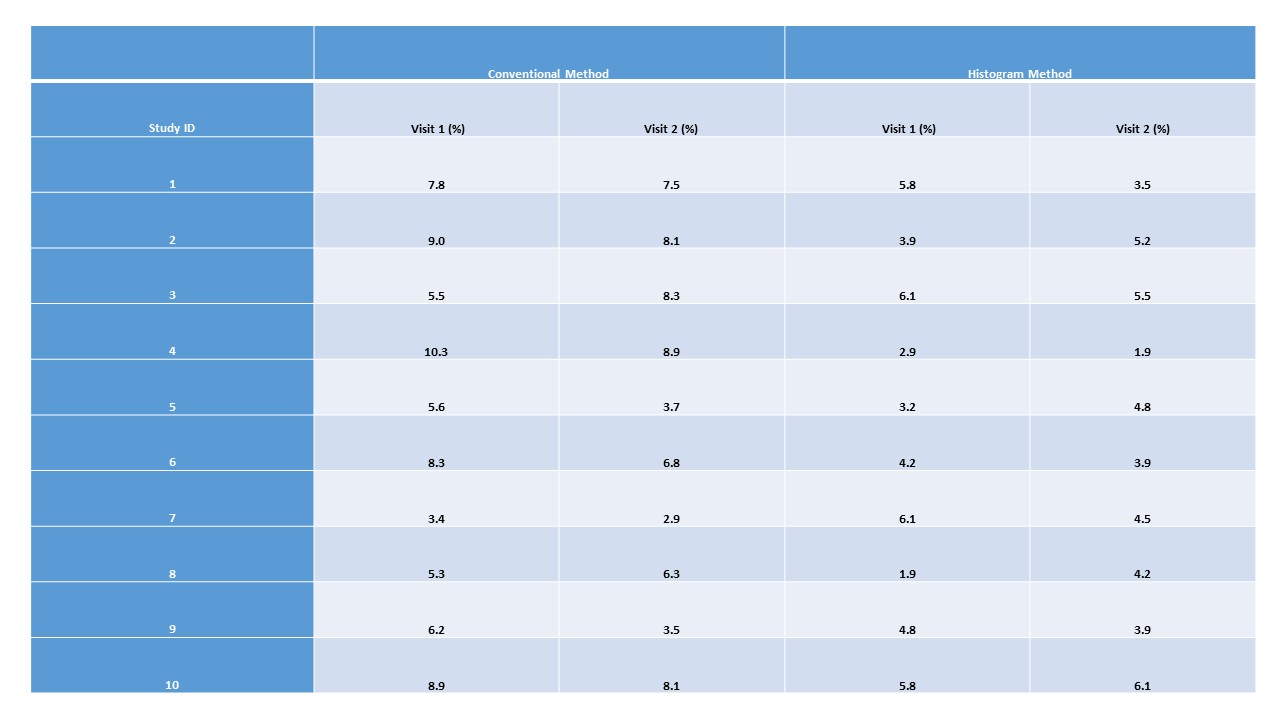
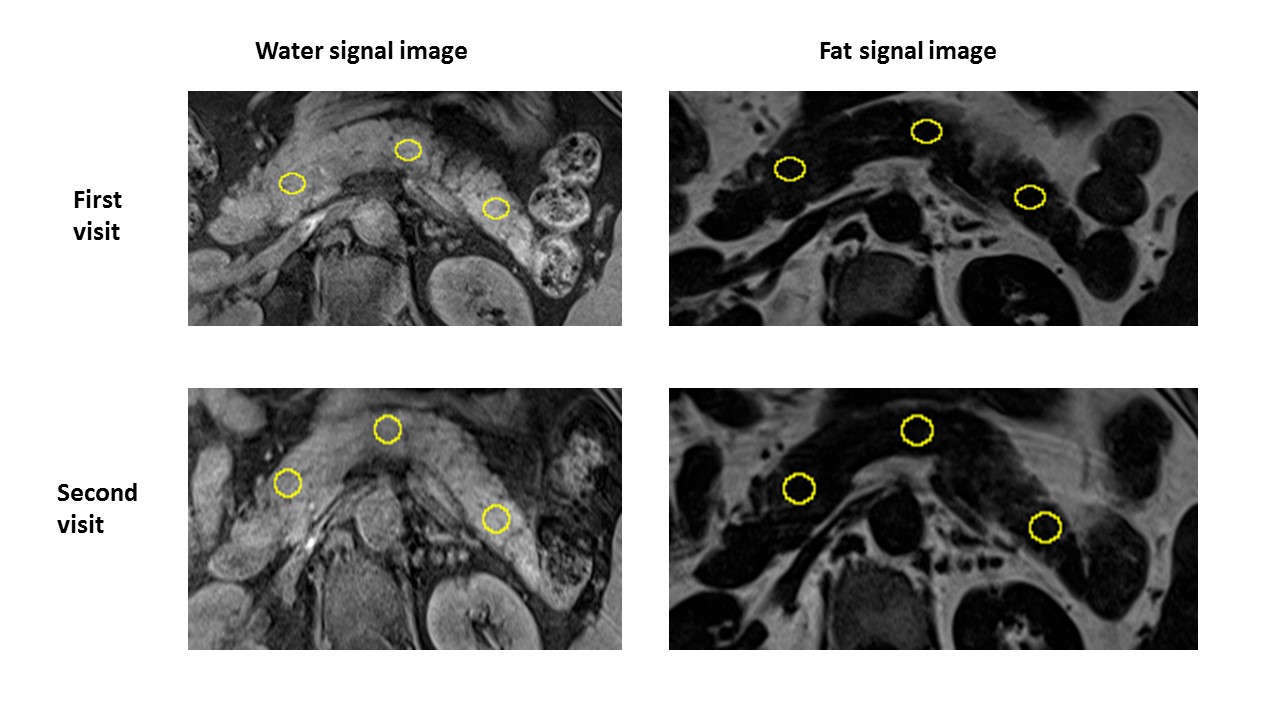
A pilot study was performed on 10 obese participants with prediabetes. Participants had followed the prescribed dietary programme for 12 weeks. Patients were MR-scanned before and after the dietary intervention. Each patient was scanned for the entire abdomen by a 3.0 Tesla Siemens MR scanner. A 3D dual gradient-echo sequence acquired water/fat images in one acquisition using a 2-point Dixon technique. T1-weighted spin echo pulse sequence was used with: TR, 6.5 msec, TE, 2.4/4.8 msec, flip angle, 12 degrees, matrix, 256 x 128, and 0.7 excitation. The pancreas was scanned using a similar protocol, with 12-second breath hold and a number of 5.0 mm slices. MR proton spectroscopy (MRS) was performed to determine liver fat. A 2x2x2 cm3 voxel was selected within the right lobe of the liver. MRS of the selected voxel was performed with an echo time of 20 msec, a TR of 3000 msec and mixing time of 33 msec, 1024 data points over 1200 kHz spectral width with 50 averages. Subcutaneous adipose tissue (SAT) and visceral adipose tissue (VAT) were distinguished through image processing in ImageJ, and the volumes calculated and presented as percentages of the total abdominal volume. For MRS, area under the curve (AUC) of the water and fat peaks were calculated from spectra using SIVIC software, and liver fat was presented as AUCfat/(AUCfat+AUCwater) in percentage. For pancreas fat, two methods were used. Firstly, the coverage of the entire pancreas including slices and boundaries was determined, and then the fat volume was calculated in the fat-only images. Fat content was presented as total fat volume/total pancreas volume in percentage. The second method was termed histogram method9. Three 100 mm2 regions of interest (ROIs) were selected in head, body and tail of one slice of pancreas image. Then un-excluded total fat content data were achieved from analyse and histogram commands. By excluding the pixels of <1% and > 20% of fat, the corrected pancreatic fat content can be obtained. Fat content was presented as percentage and considered to be representative of the whole pancreas.Results
The VAT, SAT and liver fat are summarized in Table 1. The pancreas fat results are summarized in Table 2. Figure 1 shows the process of the histogram method with selection of 3 ROIs in one slice of pancreas image. Generally, histogram method produces lower values compared with the conventional whole pancreas fat measurement.Discussion
This is the first study to assess changes in abdominal, liver and pancreas fat in prediabetes patients on intermittent fasting with probiotic or placebo supplement for 12 weeks. For liver fat measurement, MRS method appears to be robust and reliable with multiple operators getting identical results. For VAT and SAT, using ROI identification and measurement appears to be acceptable as the ROIs are relatively large and less likely to be significantly affected by observer’s experience. For pancreatic fat, the histogram method is easy to operate and yields fast results as only a pair of images are utilised (Figure 1). However, when before and after intervention images are not near identical, the ROIs may not represent the same region, which introduces error. Also, inhomogeneity of fat distribution in the pancreas may result in either under- or over-estimation. For conventional fat measurement, the entire pancreas is used for calculating the result. Greater consistency of results could be achieved than for the histogram method. However, the method is labour-intensive and extensive training in boundary recognition is required of the observer.Conclusion
MRS/MRI methods for liver, VAT and SAT measurement appear feasible for the trial. For pancreas fat, a combination of histogram and conventional method (i.e. conventional method only to be applied when near identical images before and after treatment are not available) may provide reliable results with reduced labour.Acknowledgements
We'd like to thank Dr. Kieren G. Hollingsworth of Newcastle University, UK for technical advice.References
1. Heni M, Machann J, Staiger H, Schwenzer NF, Peter A, Schick F, et al. Pancreatic fat is negatively associated with insulin secretion in individuals with impaired fasting glucose and/or impaired glucose tolerance: a nuclear magnetic resonance study. Diabetes/metabolism research and reviews. 2010;26(3):200-5.
2. Toledo-Corral CM, Alderete TL, Hu HH, Nayak K, Esplana S, Liu T, et al. Ectopic fat deposition in prediabetic overweight and obese minority adolescents. The Journal of Clinical Endocrinology & Metabolism. 2013;98(3):1115-21.
3. Singh RG, Yoon HD, Wu LM, Lu J, Plank LD, Petrov MS. Ectopic fat accumulation in the pancreas and its clinical relevance: A systematic review, meta-analysis, and meta-regression. Metabolism-Clinical and Experimental. 2017;69:1-13.
4. Luoto R, Laitinen K, Nermes M, Isolauri E. Impact of maternal probiotic-supplemented dietary counselling on pregnancy outcome and prenatal and postnatal growth: a double-blind, placebo-controlled study. British journal of nutrition. 2010;103(12):1792-9.
5. Kim H, Taksali SE, Dufour S, Befroy D, Goodman TR, Petersen KF, et al. Comparative MR study of hepatic fat quantification using single‐voxel proton spectroscopy, two‐point dixon and three‐point IDEAL. Magnetic resonance in medicine. 2008;59(3):521-7.
6. Springer F, Machann J, Claussen CD, Schick F, Schwenzer NF. Liver fat content determined by magnetic resonance imaging and spectroscopy. World journal of gastroenterology: WJG. 2010;16(13):1560.
7. Machann J, Thamer C, Schnoedt B, Haap M, Haring HU, Claussen CD, et al. Standardized assessment of whole body adipose tissue topography by MRI. Journal of Magnetic Resonance Imaging. 2005;21(4):455-62.
8. Hu HH, Kim HW, Nayak KS, Goran MI. Comparison of Fat–Water MRI and Single‐voxel MRS in the Assessment of Hepatic and Pancreatic Fat Fractions in Humans. Obesity. 2010;18(4):841-7.
9. Al-Mrabeh A, Hollingsworth KG, Steven S, Tiniakos D, Taylor R. Quantification of intrapancreatic fat in type 2 diabetes by MRI. PloS one. 2017;12(4):e0174660.
Figures