2498
Differentiating supraclavicular from gluteal adipose tissue based on simultaneous PDFF and T2* mapping using a twenty-echo gradient echo acquisition1Ismaninger Str. 22, Department of Diagnostic and Interventional Radiology, Technical University of Munich, Munich, Germany, 2Else Kröner Fresenius Center for Nutritional Medicine, Technical University of Munich, Munich, Germany
Synopsis
PDFF and T2* have been previously proposed as two important parameters in quantitative MRI of adipose tissue. This study investigates the difference between gluteal and supraclavicular adipose tissue T2* and the relationship between adipose tissue T2* and PDFF using a twenty-echo multi-echo gradient echo acquisition. A highly significant difference between the PDFF in different fat regions was detected in water-fat separation results when using either the first 6 echoes or the full 20 echoes. However, T2* values were only significantly different between fat regions, when using the full 20 echoes and not when using the first 6 echoes. PDFF also correlated with T2* when using the full 20 echoes.
Purpose
Adipose tissue can be classified based on histological and functional properties as white, brown or beige. Chemical shift encoding-based water-fat MRI techniques have gained popularity in differentiating the compositional difference between white and brown adipose tissue based on simultaneous mapping of the proton density fat fraction (PDFF) and T2* [1]. Specifically, there have been multiple studies showing that PDFF is lower in the frequently-brown-fat-containing supraclavicular fossa compared to other white fat depots [2-7]. T2* has been also reported to be lower in supraclavicular fat compared to other white fat depots [2-5]. However, the range of adipose tissue T2* values reported in the literature for either supraclavicular or white fat is relatively wide and primarily based on 6-echo data [2-5]. Increasing the number of echoes in a multi-echo gradient echo acquisition is expected to at least increase the precision of adipose tissue T2* mapping. The purpose of this study was to investigate the difference between gluteal and supraclavicular adipose tissue T2* and the relationship between adipose tissue T2* and PDFF using a twenty-echo multi-echo gradient echo acquisition.Methods
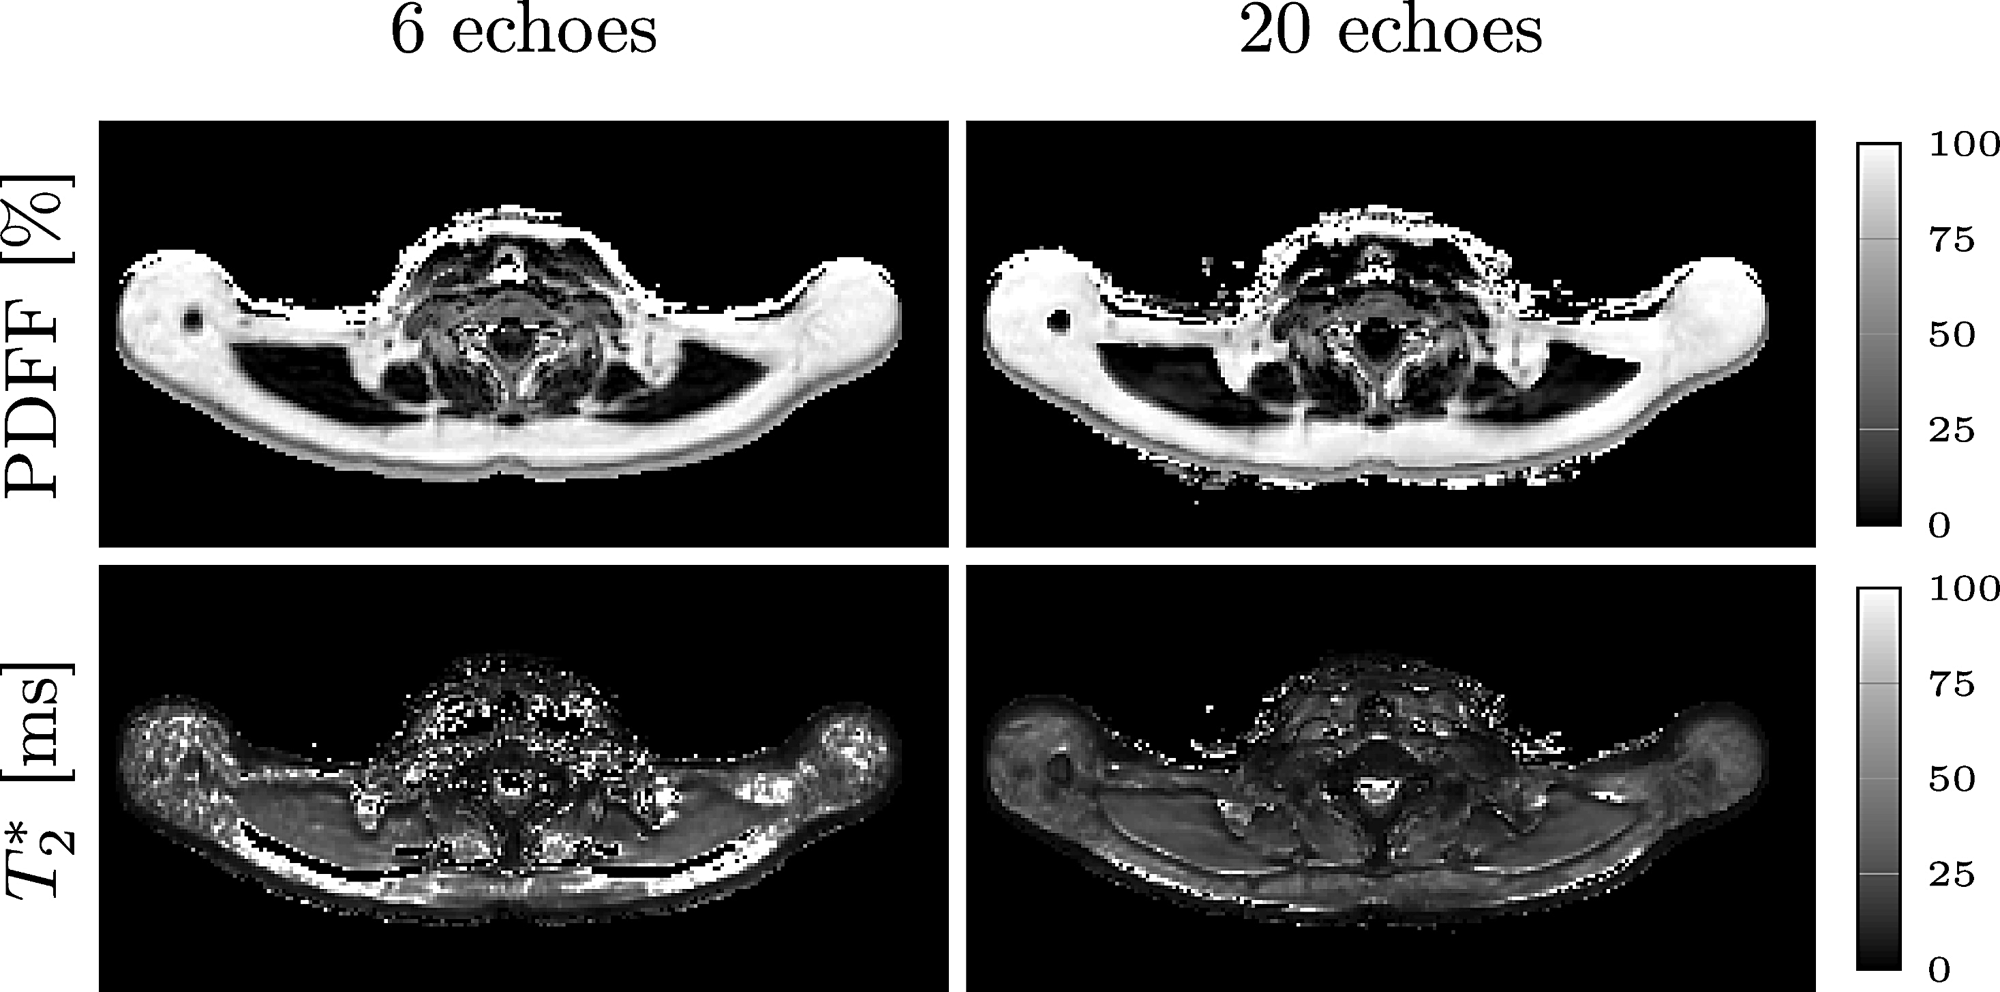
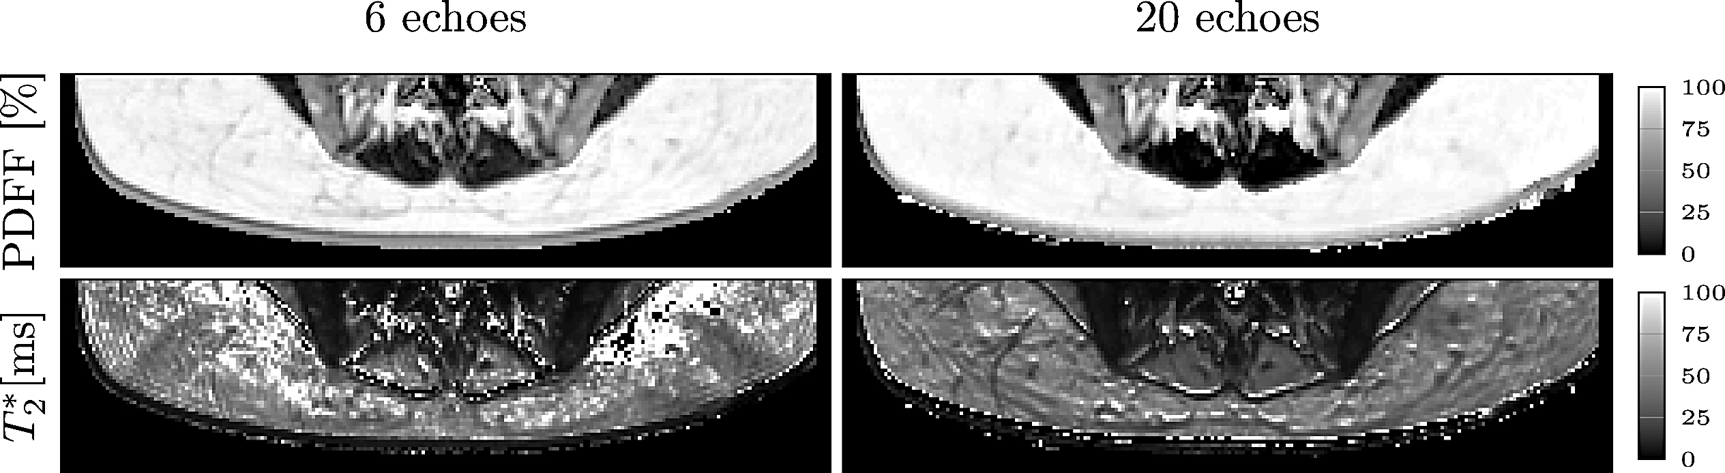
For this prospective study, 16 healthy subjects (10 females and 6 males; median BMI 22.7 kg/m2, range 17.2-44.5 kg/m2; median age 40.7 years, range 22.5-63.1 years) underwent an MRI of the neck and the abdomen/ pelvis on a 3T scanner (Ingenia, Philips Healthcare). To measure the supraclavicular and gluteal PDFF, a time-interleaved twenty-echo multi-echo gradient-echo sequence with monopolar gradients was used: 2 interleaves, 10 echoes per interleaf, TR=24 ms, TE1=1.5 ms, ΔTE=1.0, flip angle=5°, bandwidth=961.5 Hz/pixel, FOV=400x300x140 mm³, 2 mm isotropic voxel size, SENSE with R=2.5. PDFF maps were generated using an off-line complex-based water-fat separation routine accounting for known confounding factors including the presence of multiple fat peaks (based on the previously determined subcutaneous fat spectrum in [8]), a single T2* correction and phase errors. The effect of concomitant gradients was corrected as in [9]. The water-fat separation was performed once for the first 6 echoes and once for the full 20 echoes. For segmentation of the supraclavicular and subcutaneous fat, a custom-built MATLAB-algorithm was used, delineating the deep supraclavicular and gluteal subcutaneous fat pockets bilaterally (Figure 1 and 2). BMI was calculated as weight in kg divided by height squared in m².Results
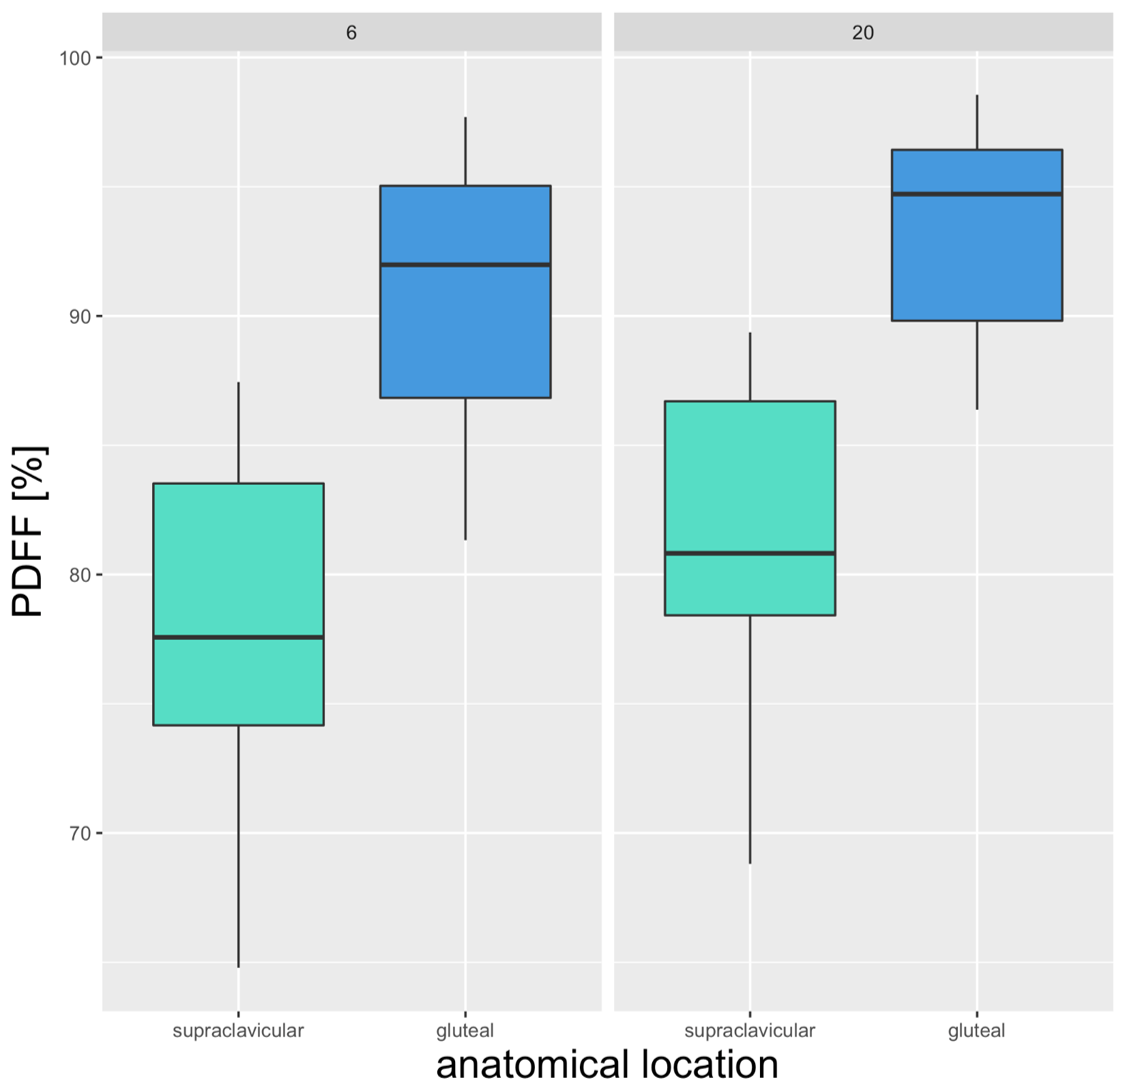
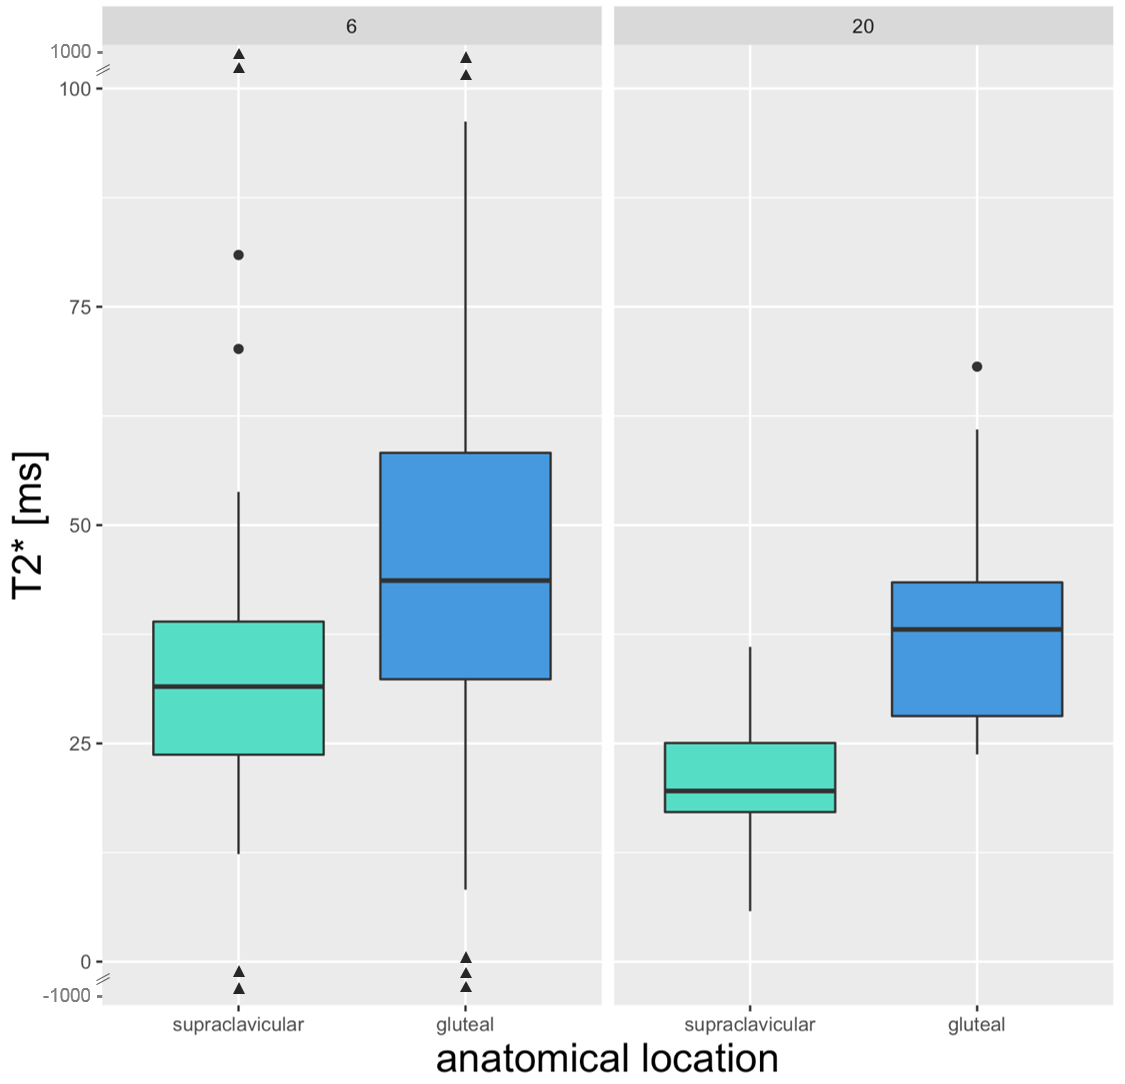
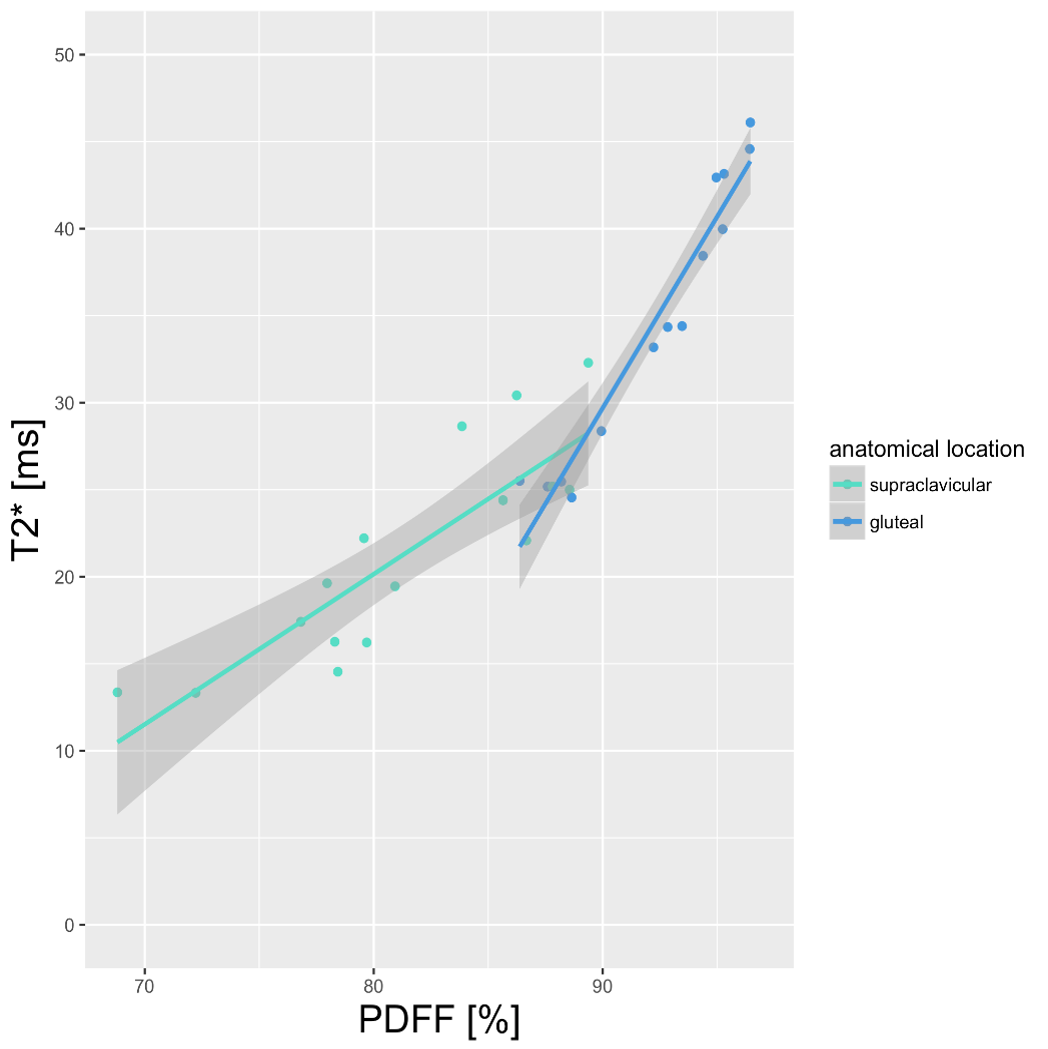
Both in the 6-echo-data and in the 20-echo-data, PDFF was significantly different in supraclavicular vs. gluteal fat. With the 6-echo-data, PDFF was 78.4% supraclavicular and 90.3% gluteal (p<0.0001). The 20-echo-data resulted in a PDFF of 81.9% supraclavicular and 93.4% gluteal (p<0.0001) (Figure 3). For T2*, a significant difference between supraclavicular and gluteal fat was only visible in the 20-echo-dataset (20.9 ms supraclavicular, 38.7 ms gluteal adipose tissue, p<0.0001) (Figure 4). Correlation analyses showed a strong correlation between PDFF and T2* in both supraclavicular and gluteal fat for the 20-echo-data (r=0.77, p<0.0001 supraclavicular and r=0.72, p<0.0001 gluteal) (Figure 5), but not for the 6-echo-data. Both PDFF and T2* of supraclavicular and gluteal fat correlated with BMI for the 20-echo-data with r=0.5, p=0.004 for supraclavicular T2*, r=0.37, p=0.03 for gluteal T2*, r=0.48, p=0.006 for supraclavicular PDFF and r=0.38, p=0.03 for gluteal PDFF.Discussion & Conclusion
The present study shows a highly significant difference between the PDFF in different fat regions for both 6- and 20-echo-data. However, T2* values were only significantly different between fat depots in the 20-echo, but not the 6-echo-dataset. PDFF correlated with T2* for the 20-echo-dataset. Furthermore, BMI correlated with both PDFF and T2* for the 20-echo-dataset. Therefore, the present findings suggest that adipose tissue PDFF quantification is not affected by the number of sampled echoes, whereas adipose tissue T2* is more significantly affected by the number of sampled echoes. A 20-echo multi-echo gradient acquisition enables thus a multi-parametric analysis of both adipose tissue PDFF and T2* and may improve the MR-based differentiation between white and brown fat.Acknowledgements
The present work was supported by the European Research Council (grant agreement No 677661 – ProFatMRI) and Philips Healthcare.References
[1] Hu, Quantitative proton MR techniques for measuring fat
[2] Hu, Comparison of brown and white adipose tissues in infants and children with chemical-shift-encoded water-fat MRI
[3] Gifford, Characterizing active and inactive brown adipose tissue in adult humans using PET-CT and MR imaging
[4] McCallister, A Pilot Study on the Correlation Between Fat Fraction Values and Glucose Uptake Values in Supraclavicular Fat by Simultaneous PET/MRI
[5] Hui, Quantification of Brown and White Adipose Tissue Based on Gaussian Mixture Model Using Water–Fat and T2 MRI in Adolescents
[6] Franssens, Relation Between Brown Adipose Tissue and Measures of Obesity and Metabolic Dysfunction in Patients With Cardiovascular Disease
[7] Franz, Association of proton density fat fraction in adipose tissue with imaging-based and anthropometric obesity markers in adults
[8] Hamilton, In Vivo Triglyceride Composition of Abdominal Adipose Tissue Measured by 1H MRS at 3T
[9] Ruschke, Correction of Phase Errors in Quantitative Water–Fat Imaging Using a Monopolar Time-Interleaved Multi-Echo Gradient Echo Sequence
Figures