2497
In Vivo Proton Magnetic Resonance Spectroscopy of Hepatic Fatty Acid Change: Identification of Lipid Contents with Correct and Incorrect Terminal Methyl Group in Hepatic Steatosis at Ultra High Field1Department of Biomedical Engineering and Research Institute of Biomedical Engineering, College of Medicine, The Catholic University of Korea, Seoul, Republic of Korea
Synopsis
Magnetic resonance spectroscopy (MRS) with optimized relaxation time provides an effective means for quantifying lipid content and characterizing hepatic steatosis. The aim of this study was to quantify the difference in hepatic lipid content with metabolic changes and determine effect of diet on high-fat diet (HFD)-fed mice by measuring the main localized MRS sequence with relaxation times.
Purpose
The pathogenesis of storage disease or metabolic disorders depends on their specific effect on metabolism. Complex interactions occur between the metabolic pathways of fatty acids, glucose, and lipoproteins.1,2 Changes in the expression of metabolites, in addition to changes in saturated and unsaturated fatty acid contents following formation of abnormal metabolites, play an important pathogenic role and can be measured by proton MRS.3,4 The aims of this study were to: (1) validate a noninvasive MRS-based procedure for quantifying differences in hepatic lipid content of the liver with respect to metabolic changes; (2) determine the possible effect of a HFD on the hepatic lipid content in mice with serum biochemistry; and (3) demonstrate that incorrect and correct relaxation times yield contradictory quantification results for liver fat tissue.Materials and Methods
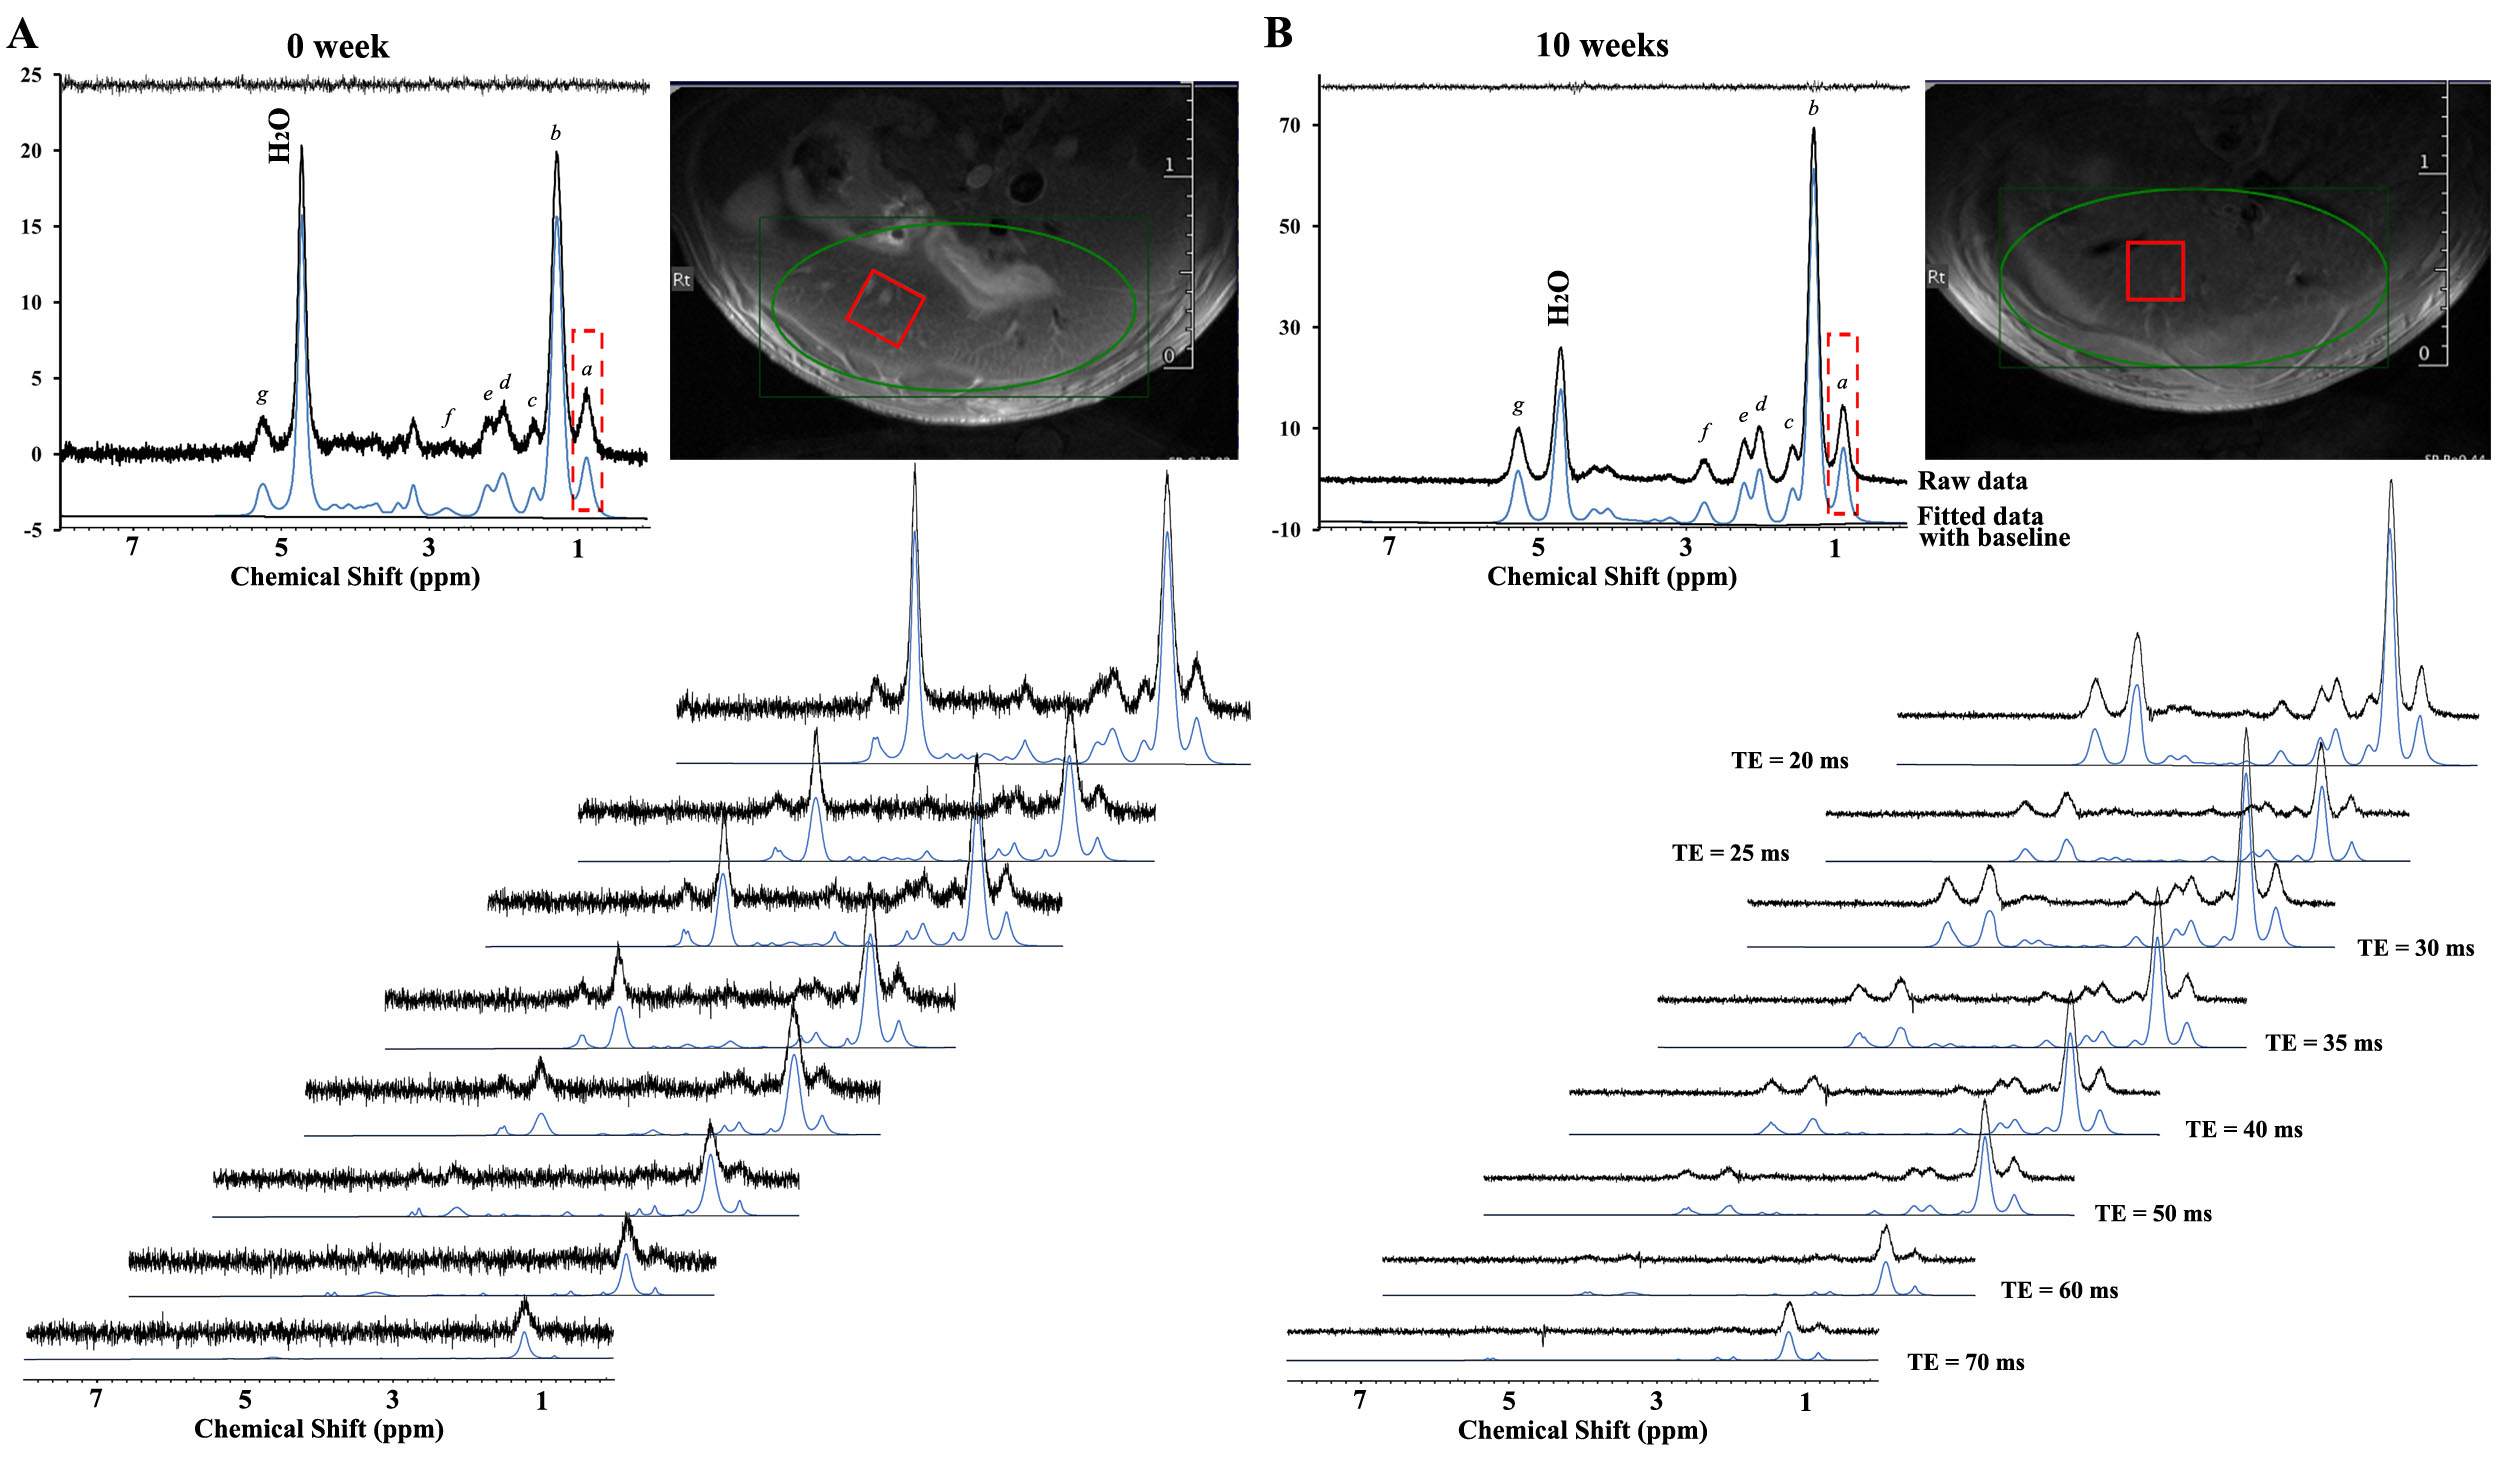
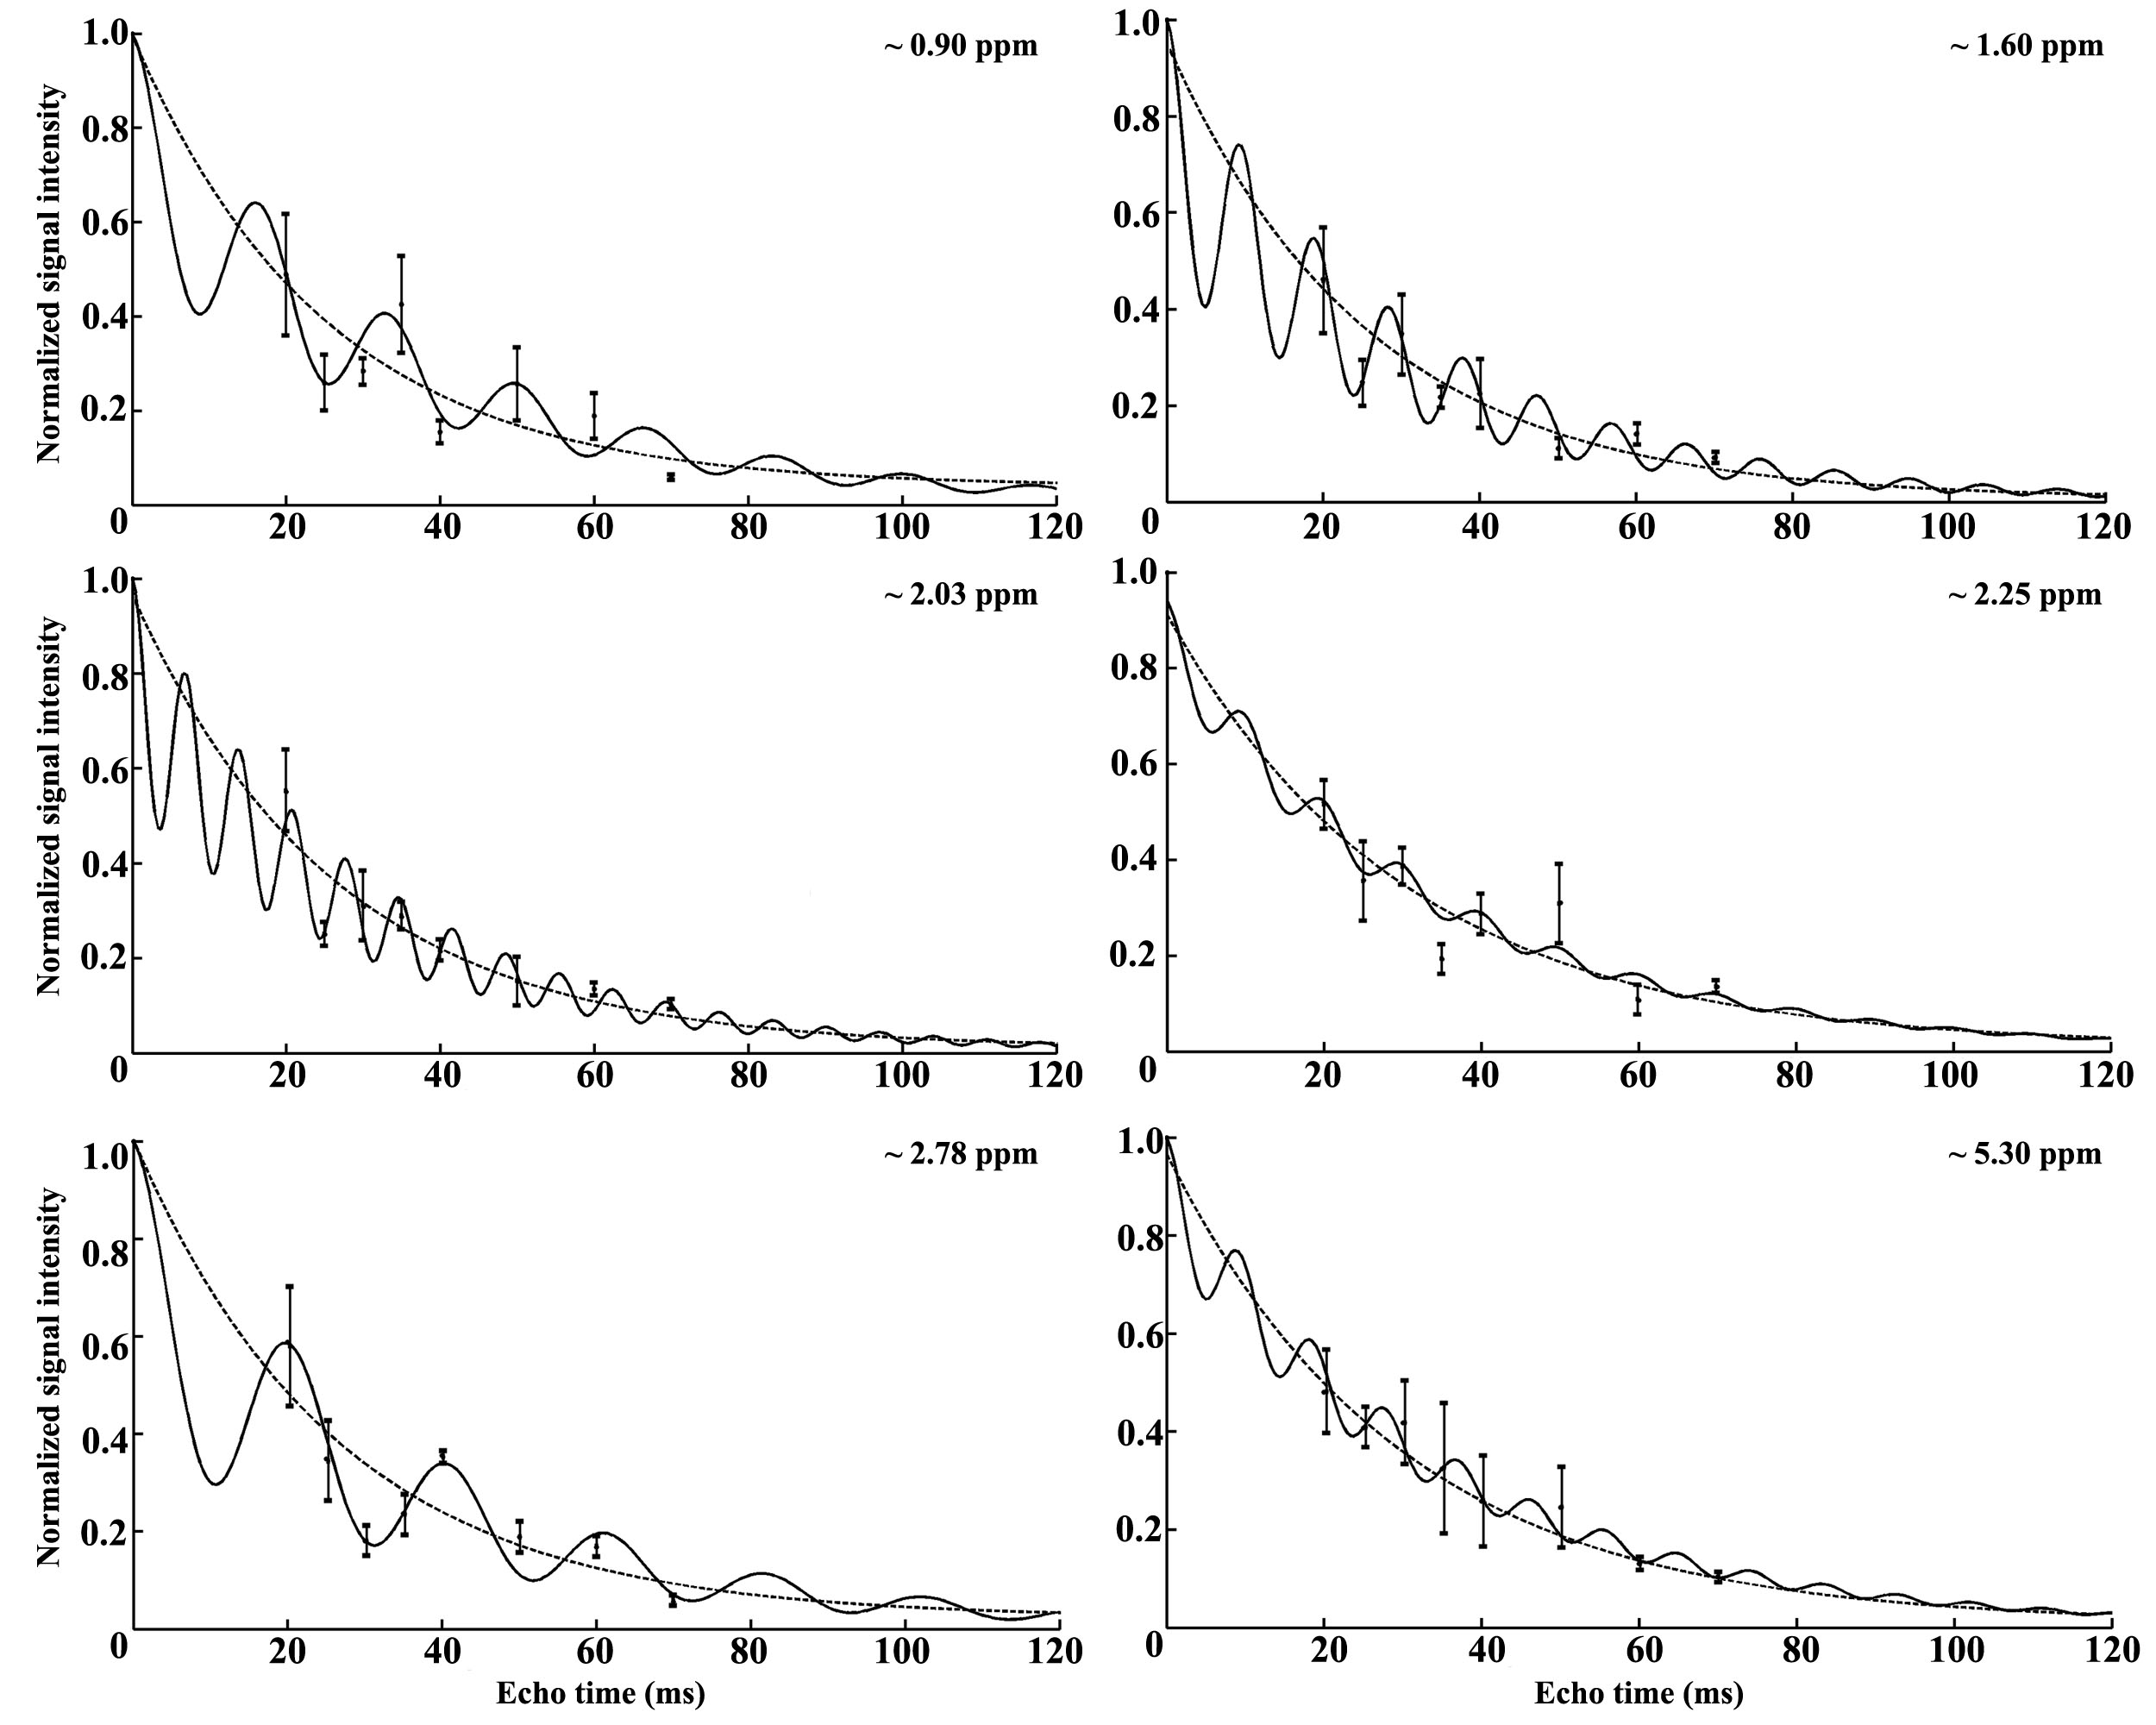
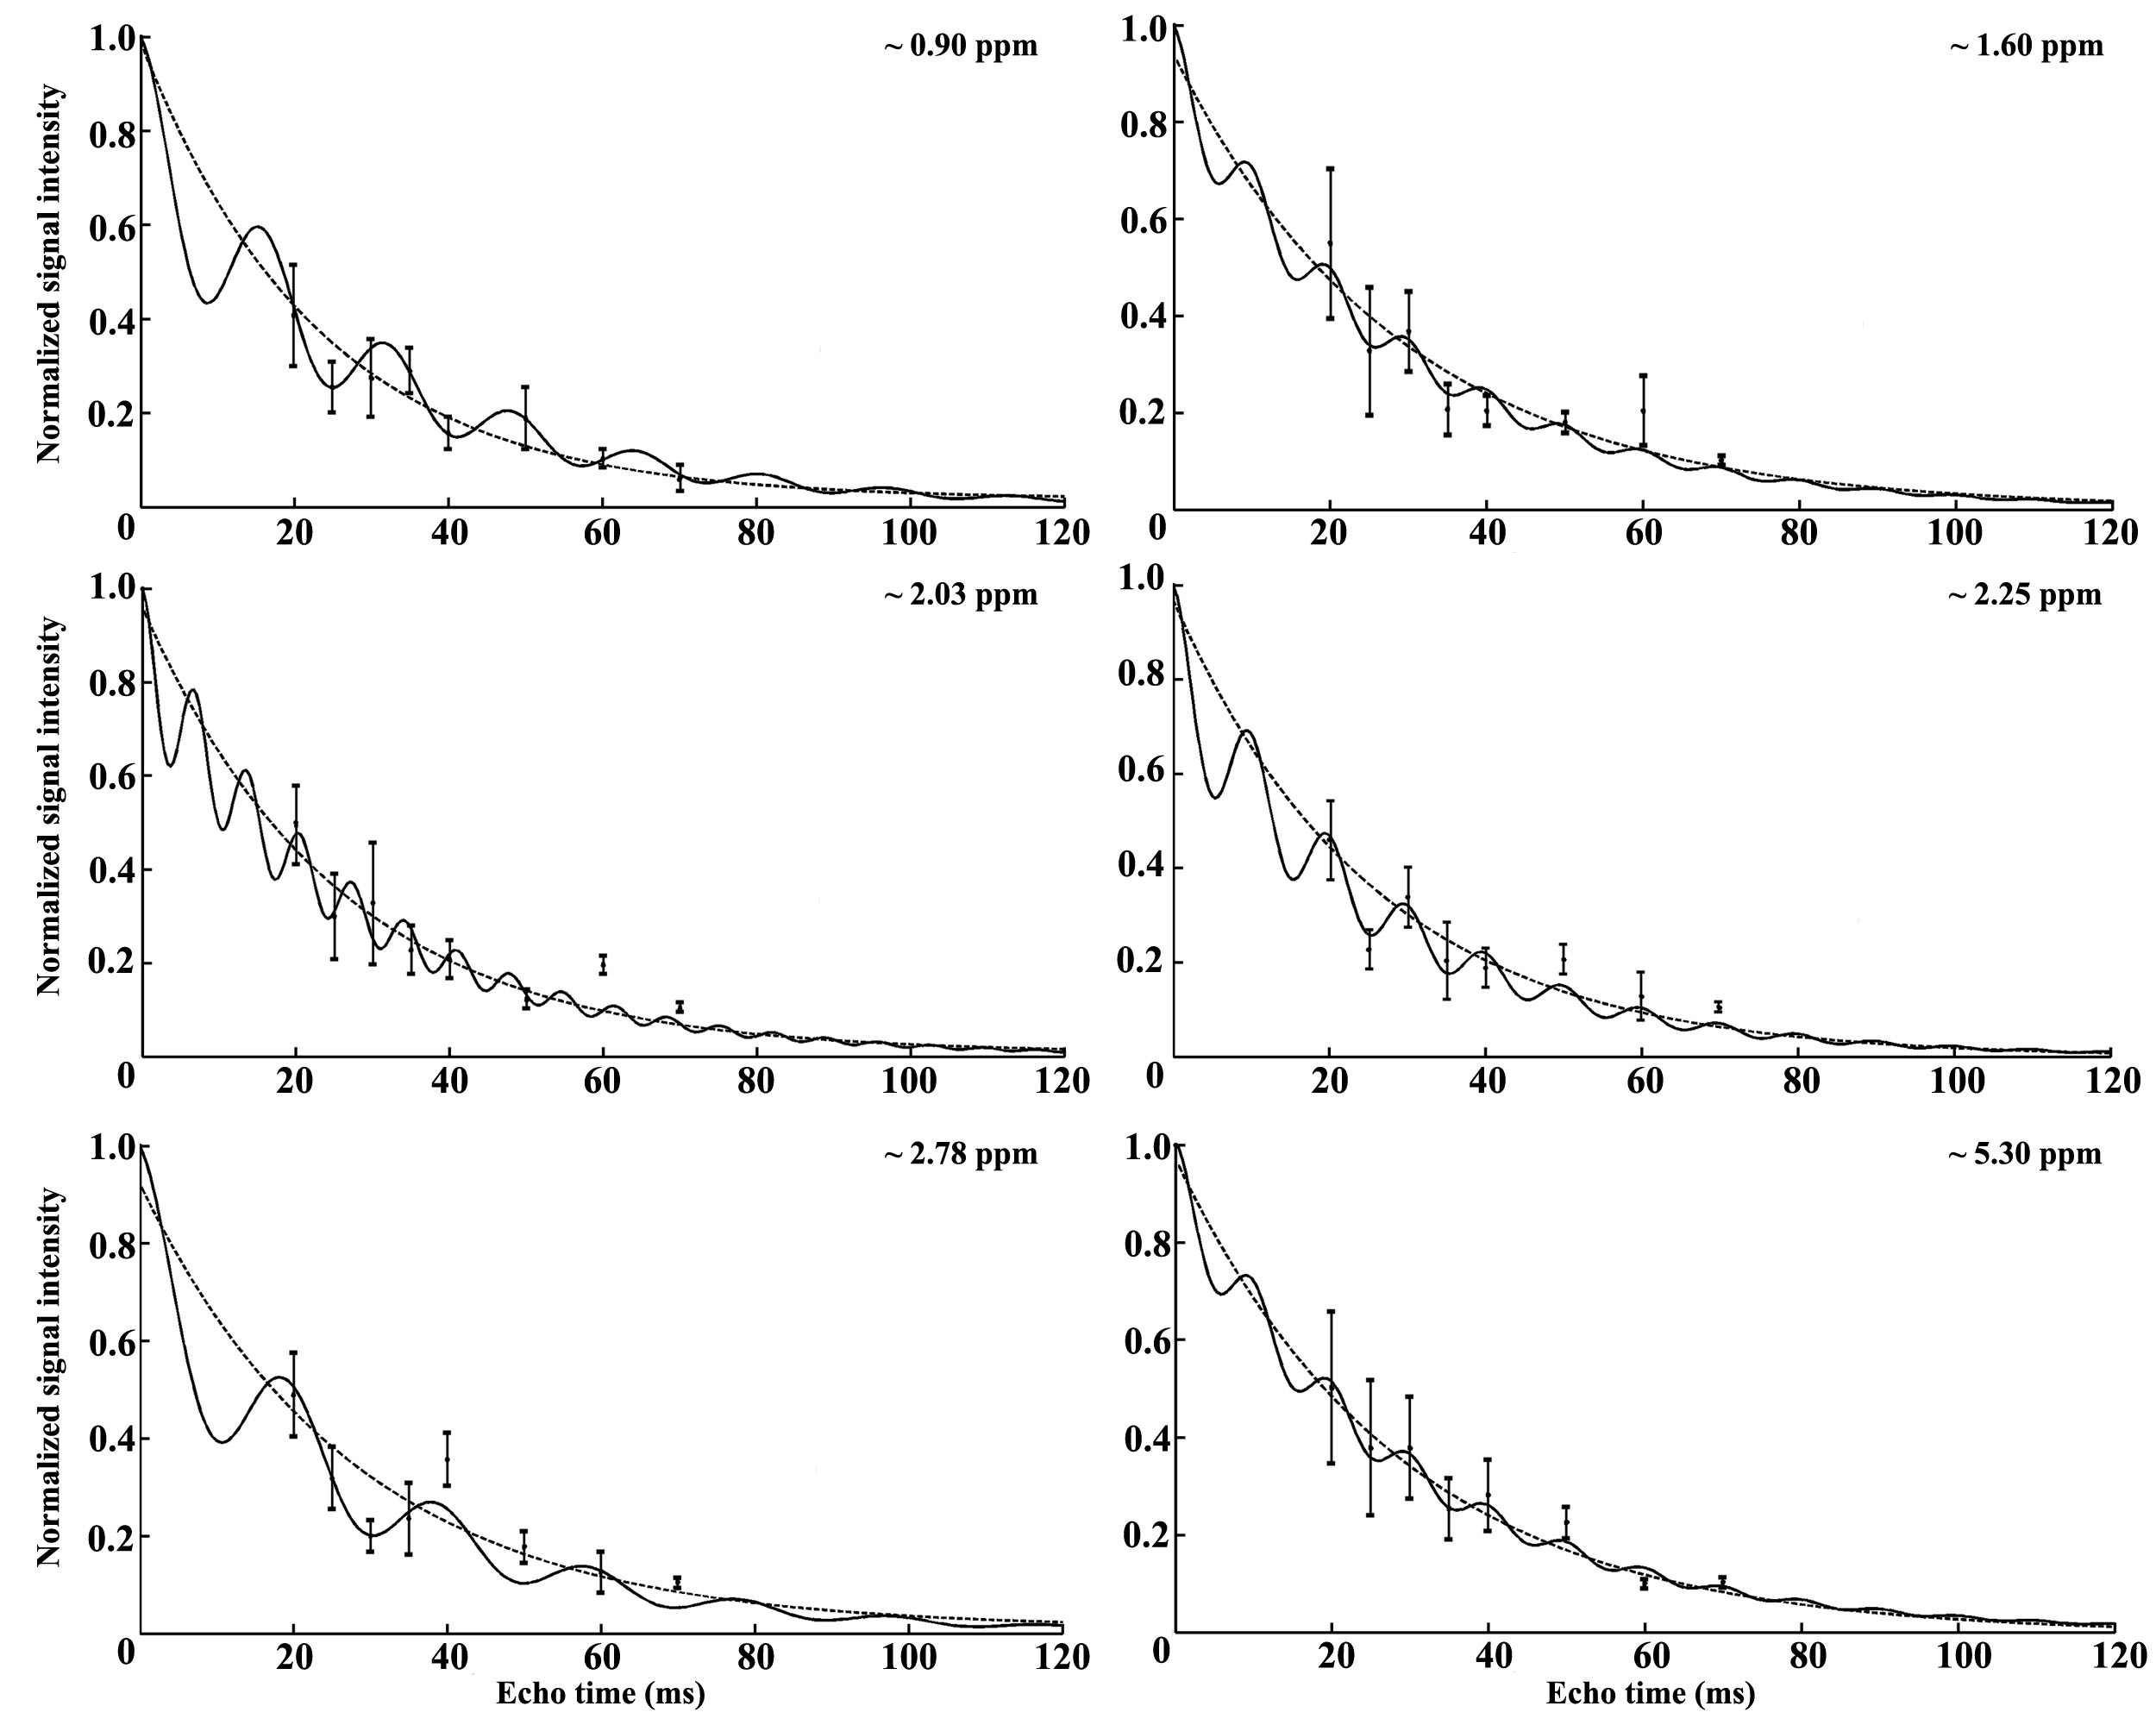
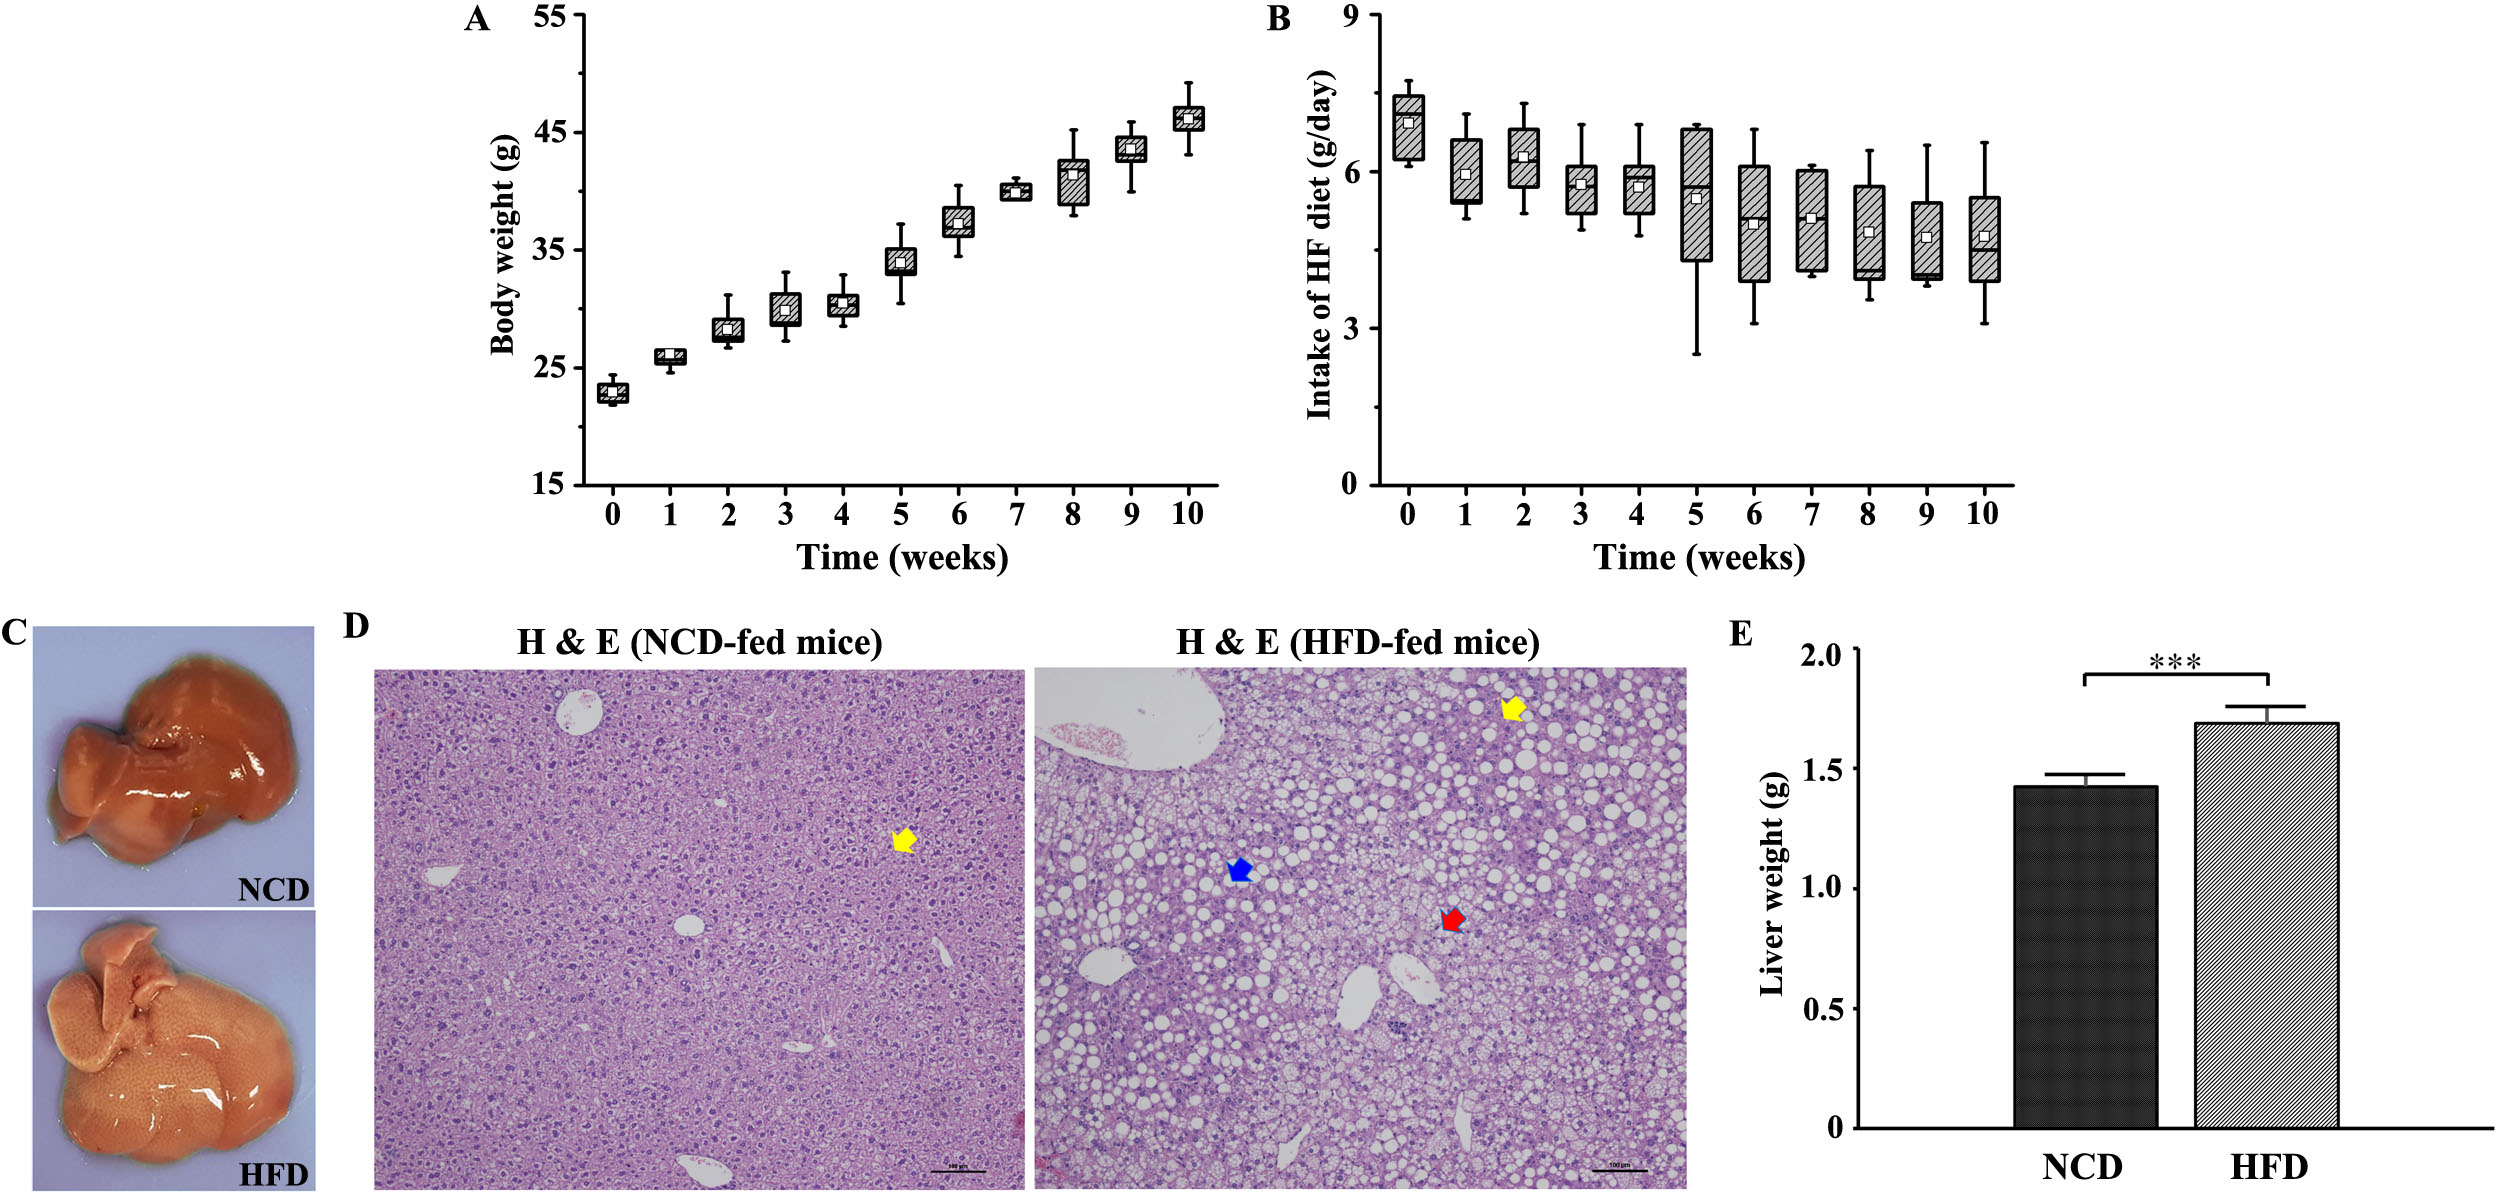
Hepatic steatosis (ten male C57BL/6N mice) was induced in the mice via HFD pellets composed of 60% fat, 20% protein, and 20% carbohydrates. Magnetic resonance imaging (MRI) and MRS analyses were performed using a horizontal 9.4 T MRI animal scanner (Biospec 94/20 USR, Bruker Biospin GmbH, Ettlingen, Germany) equipped with a 20-cm bore magnet with a 400 mT/m gradient and a four-channel receive-only array animal coil. The MRS scan parameters were as follows: standard stimulated echo acquisition mode (STEAM) sequence (repetition time [TR], 5,000 ms; mixing time [TM], 10 ms; echo time [TE], 20 ms; number of signal average, 128; acquisition data point, 2,048; acquisition bandwidth, 4,401.41 Hz; repetition time, 1; scan time, ~11 min) and multi-TEs STEAM sequence (with TE, 20–70 ms). For animal proton MRS, a voxel size of 3×3×3 mm3 (2.7 mL) was selected. Before the MRS scan, the water resonance signal in the volume of interest of the livers of HFD-fed mice was suppressed by variable pulse power and optimized relaxation delays.5 All the MRS data were quantified using the Linear Combination of Model Spectra (Version 6.3.1).6 The following correct curve-fitting equation (M(TE)=M0e(-TE/T2)[cos(πJETE)+b]) was used to measure the relaxation times of lipid resonance, where JE and b are the values of the J-coupling evolution and complement number to M0 in cases with nonzero JE values, respectively.7Results
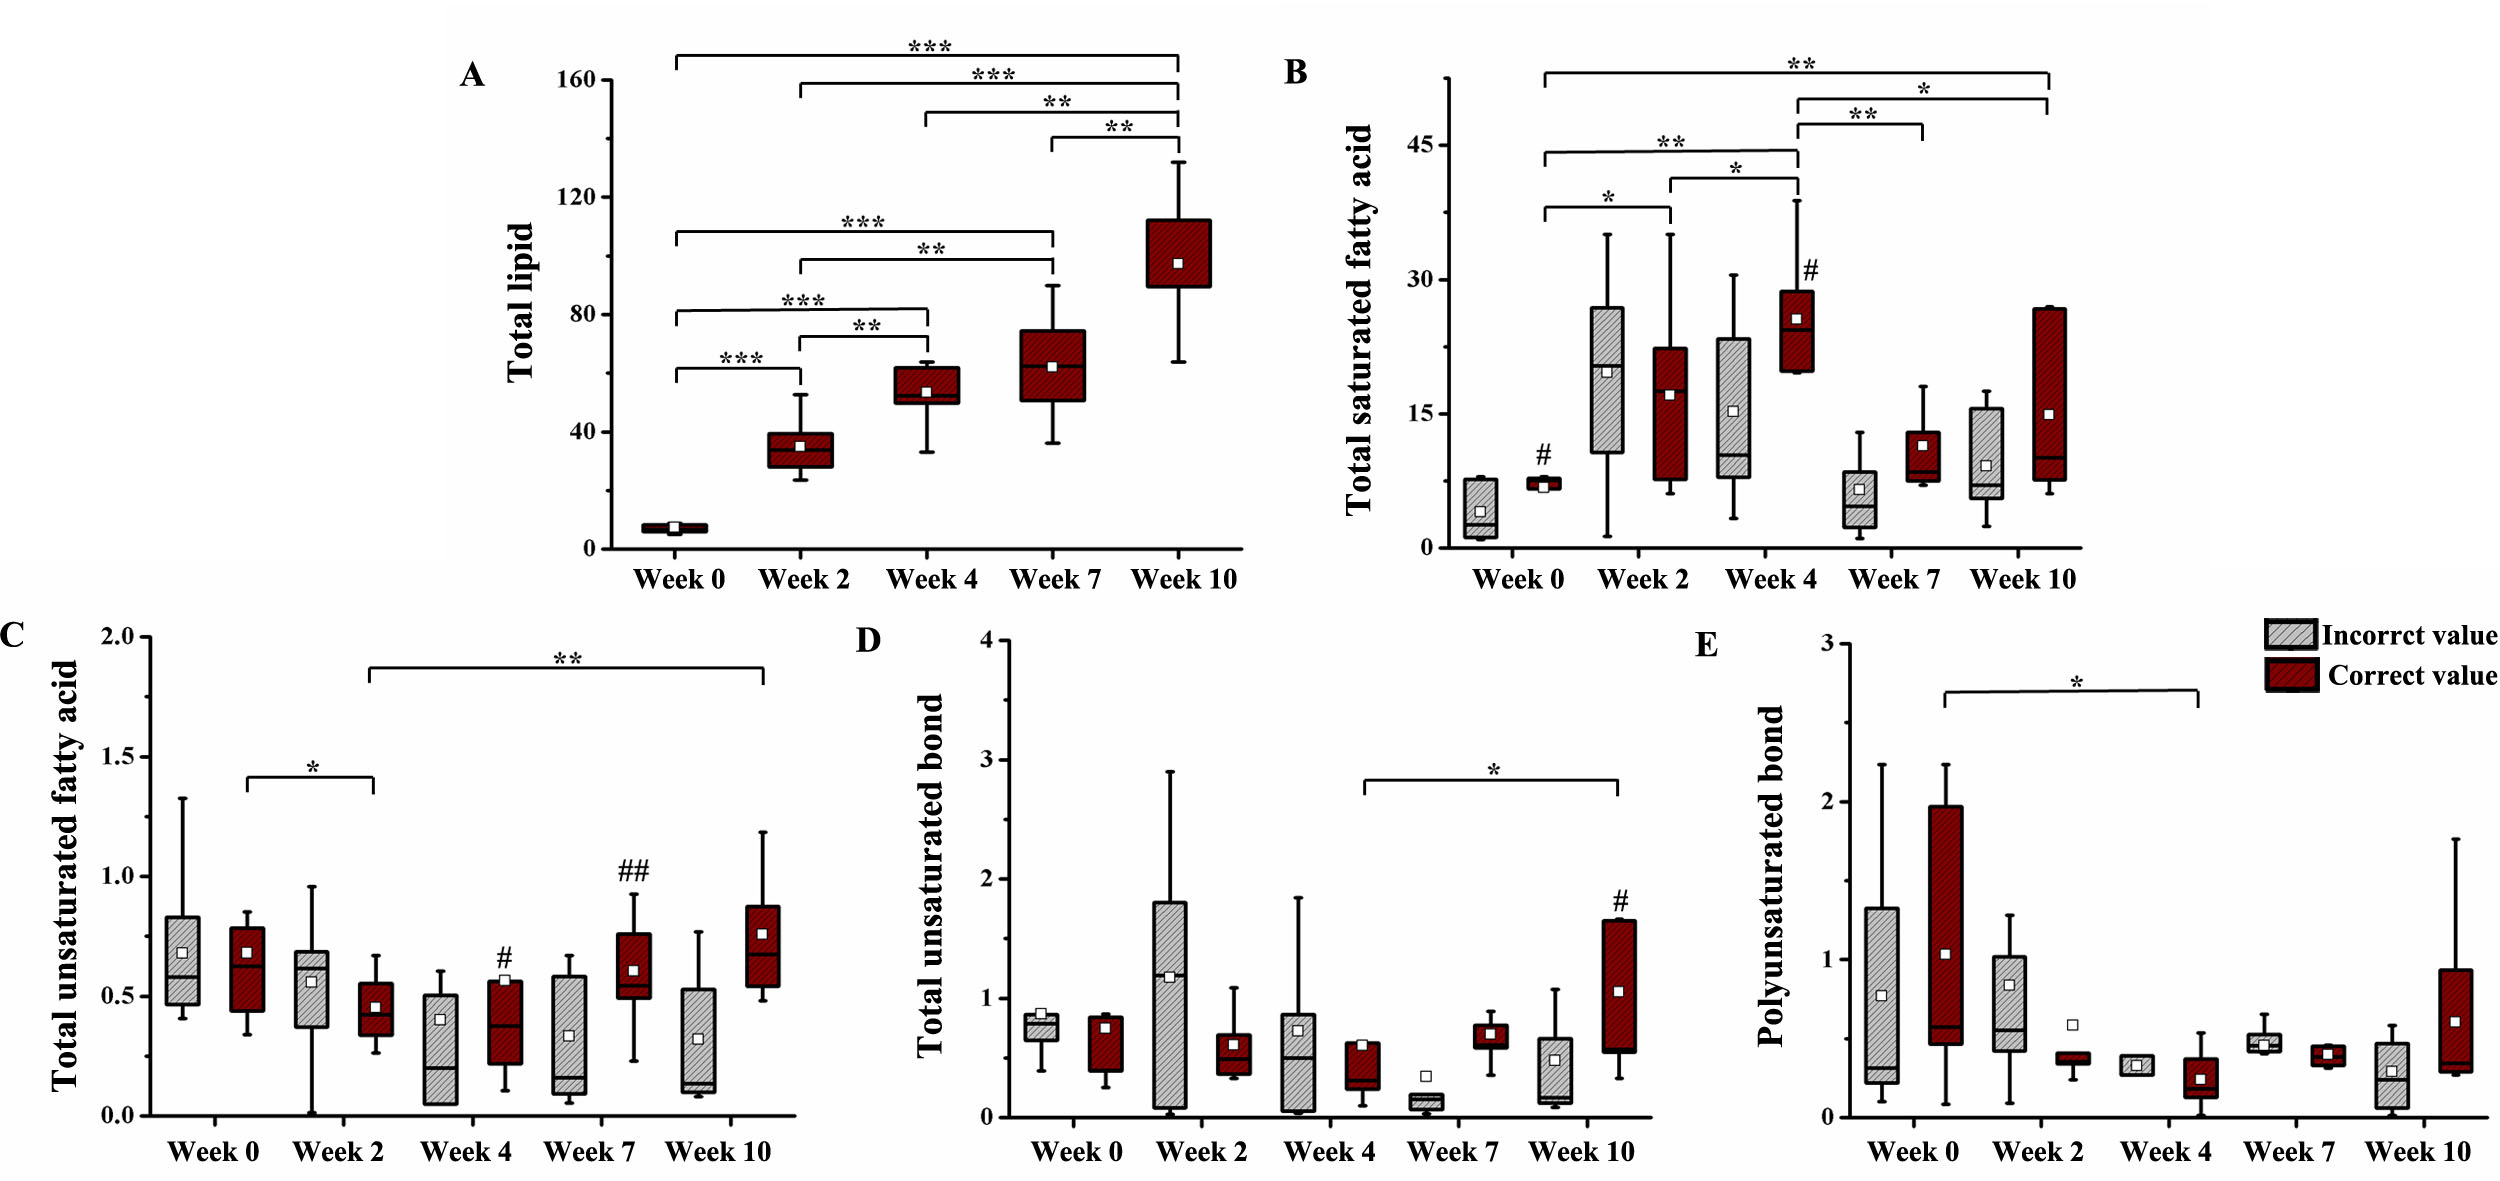
To measure the lipid metabolite peaks, we analyzed the time points shown in Fig 1. The signal-to-noise ratios for methylene protons of the liver were as follows: 0 week, 33.2 ± 10.1; 2 weeks, 58.2 ± 8.2; 4 weeks, 70.9 ± 6.4; 7 weeks, 106.0 ± 9.2; 10 weeks, and 114.2 ± 10.9. As shown in Fig 2 and 3, the differences in relaxation times with incorrection and correction values were as follows: ~0.90 ppm (week 0: p < 0.001; week 10: p < 0.001), ~1.60 ppm (week 0: p < 0.001), ~2.03 ppm (week 0: p < 0.05), ~2.78 ppm (week 0: p < 0.001; week 10: p < 0.05), and ~5.30 ppm (week 0: p < 0.05). Figure 4 shows the total saturated fatty acid levels calculated at 2 (p < 0.05), 4 (p < 0.01), and 10 (p < 0.01). The change in the total unsaturated fatty acid was statistically significant at week 2 (p < 0.05) (week 2-10, p < 0.01) and the change in the total unsaturated bonds was statistically significant from week 4 to 10 (p < 0.05). In addition, the change in the polyunsaturated bonds was statistically significant at week 4 (p < 0.05). As shown in Fig. 5, liver weights in HFD-fed mice (1.69 ± 0.14 g) were significantly higher than those in normal-chow diet-fed mice (1.43 ± 0.10 g) as controls. Serum glucose (p < 0.05), aspartate transaminase (p < 0.001), and alanine transaminase (p < 0.001) concentrations were significantly elevated in HFD mice. Serum albumin (p < 0.05) and total bilirubin (p < 0.05) concentrations were also significantly lower in HFD mice.Discussion and Conclusion
Our results indicate that methyl and methylene protons are sensitive to HFD-induced lipid accumulation in the fatty liver and reveal that the relaxation times of resonances yield significantly different quantification of lipid contents in animals. In conclusion, we suggest that for the research and clinical evaluation of disease, obtaining a STEAM sequence with T2 correction using an ultra-high field scanner is an appropriate method for lipid content quantification. The resonances are dependent on the relaxation correction for metabolite quantification. We analyzed the lipid content (upregulated saturated and unsaturated fatty acids; downregulated polyunsaturated fatty acids) in the liver of HFD-fed mice and evaluated the lipid quantification with a sufficiently high signal-to-noise ratio.Acknowledgements
This study was supported by grants (2012-007883) from the Mid-career Researcher Program through the National Research Foundation (NRF) funded by the Ministry of Science, ICT & Future Planning (MSIP) of Korea.References
1. Cheung JS, Fan SJ, Gao DS, et al. In vivo lipid profiling using proton magnetic resonance spectroscopy in an experimental liver fibrosis model. Acad. Radiol. 2011;18(3):377-383.
2. Cobbold JF, Patel JH, Goldin RD, et al. Hepatic lipid profiling in chronic hepatitis C: an in vitro and in vivo proton magnetic resonance spectroscopy study. J. Hepatol. 2010;52(1):16-24.
3. Bugianesi E, Leone N, Vanni E, et al. Expanding the natural history of nonalcoholic steatohepatitis: from cryptogenic cirrhosis to hepatocellular carcinoma. Gastroenterology. 2002;123(1):134-140.
4. Chabanova E, Bille DS, Thisted E, et al. 1H MRS assessment of hepatic steatosis in overweight children and adolescents: comparison between 3T and open 1T MR-systems. Abdom. Imaging. 2013;38(2):315-319.
5. Tkáč I, Starčuk Z, Choi IY, et al. In vivo 1H NMR spectroscopy of rat brain at 1 ms echo time. Magn. Reson. Med 1999;41(EPFL-ARTICLE-177519):649-656.
6. Provencher SW. Automatic quantitation of localized in vivo 1H spectra with LCModel. NMR Biomed 2001;14(4):260-264.
7. Yahya A, Tessier AG, Fallone BG. Effect of J‐coupling on lipid composition determination with localized proton magnetic resonance spectroscopy at 9.4 T. J. Magn. Reson. Imaging. 2011;34(6):1388-1396.
Figures